Université de Montréal
Genetic analysis of cell size homeostasis in human cells
Par
Marcela Farias Costa
Département de biologie moléculaire Faculté de médecine
Mémoire présentée à la Faculté de medecine en vue de l’obtention du grade de maîtrise en biologie moléculaire
Mai, 2020
ii
Résumé
Les cellules sont la plus petite forme de vie individuelle qui forme un organisme. La structure et la santé de tous les organismes est essentiellement définie par le nombre, le type et la taille de leurs cellules. Composé d'environ 30 trillions de cellules, l'homme possède des cellules aux fonctions et aux tailles remarquablement variées, allant d'un neurone pouvant atteindre un mètre à une cellule lymphoïde d'environ 16 µm de diamètre. Il est connu que la taille est fondamentalement l'équilibre entre la croissance cellulaire et la division cellulaire. Néanmoins, les questions sur les réseaux moléculaires qui contrôlent et déterminent le maintien de la taille optimale des cellules restent à déchiffrer. D'innombrables travaux ont caractérisé mTORC1 comme une voie régulatrice majeure de la croissance cellulaire jouant un rôle central, intégrant des stimuli intra et extracellulaires. Ce travail porte sur l'investigation et la caractérisation des acteurs moléculaires et des processus qui orchestrent la taille des cellules humaine déterminées par l'épistase chimique. J'ai entrepris une bibliothèque CRISPR / Cas9 à inactivation prolongée (EKO) dans NALM-6 (lignée cellulaire de lymphome pré-B), suivie d'un fractionnement de la taille des cellules par élutriation à contre-courant en présence de rapamycine (inhibiteur de mTOR), et comparé aux données non publiées données du laboratoire utilisant les mêmes méthodes sans rapamycine. Cette analyse de l'étude indique que dans le contexte amont de mTOR, la perte de gènes liés à la détection des nutriments entraîne une perte de taille en présence d'inhibition de mTOR. En outre, plusieurs knockouts géniques dans la biogenèse des ribosomes et l'homéostasie du calcium ont conduit à une perte ou un gain de taille, montrant un rôle pivot possible de ces processus dans le contrôle de la taille des cellules d'une manière dépendante de mTOR. Ce travail a fourni des informations sur les gènes et réseaux connus et inconnus qui peuvent réguler la taille des cellules d'une manière dépendante de mTOR. Ces résultats doivent être validés et approfondis.
Mots-clés: taille des cellules, mTOR, CRISPR / Cas9, épistase, biogenèse des ribosomes, homéostasie calcique.
iii
Abstract
All organisms are essentially structured and fitness defined by cell number, type and size. Composed of around 30 trillion cells, humans have cells with remarkably varied functions and size, ranging from a neuron that can reach one meter in length to a lymphoid cell that is around 16 µm in diameter. At a fundamental level, size is determined by the balance between cell growth and cell division. The molecular networks that control and maintain optimal cell size are yet to be deciphered. The mTORC1 pathway is a major regulator of cell growth that plays a central role in integrating intra- and extra-cellular stimuli. This study addresses the investigation and characterization of the molecular players and processes that orchestrate cell size in human cells, as determined by chemical-genetic size screens and epistasis analysis. I undertook a CRISPR/Cas9 extended-knockout (EKO) genome-wide library screen in the NALM-6 pre-B lymphoma cell line, followed by cell size fractionation by counter flow elutriation in the presence of the mTOR inhibitor rapamycin, and compared the screen data to a similar screen performed in the absence of rapamycin. The analysis indicates that upstream of mTOR, the loss of genes that are related to nutrient sensing, results in size changes in the presence of mTOR inhibition. Also, several gene knockouts in ribosome biogenesis and calcium homeostasis led to size alterations, suggesting a possible a pivotal role of these processes in cell size control in a mTOR-dependent fashion. This study provides insights into the genetic networks that regulate cell size in a mTOR-dependent fashion and establishes new hypotheses for future experimental tests.
Keywords: Cell size, mTOR, CRISPR/Cas9, epistasis, ribosome biogenesis, calcium homeostasis.
iv
Table of Contents
Résumé iii Abstract iiii Table of figures v List of abbreviations vi Acknowledgements vii Chapter 1 7 Introduction 71.1 The enormous variation of cell and organism size in nature 7
1.2 The concepts of size, growth and division 8
1.3 Size homeostasis results from the balance between cell growth and cell division 10
1.4 Cell size threshold in yeast 11
1.5 Cell size threshold in animals 12
1.6 Cell size screens in yeast 14
1.7 The mechanistic target of rapamycin 15
1.8 Downstream effectors of mTORC1 18
1.9 mTORC1 and cancer 20
1.10 Systematic mammalian cell size screens and CRISPR/Cas9 genome-editing technology 21
Chapter 2 24
2. RESULTS 24
2.1. Culture density effects on cell size and cell cycle distribution 24
2.2 A chemical epistasis size screen with rapamycin 29
2.3. Analysis of the rapamycin size screen dataset 33
Discussion 40
Materials and methods 44
v
Table of figures
FIGURE 1: Cell size heterogeneity in nature. 8
FIGURE 2: Critical cell size threshold 14
FIGURE 3: MTORC1 and MTORC2 complexes: composition, extracellular interactors, and
cellular responses. 16
FIGURE 4: The crispr/cas9 function 22
FIGURE 5: Cell size depends on coulter density. 25
FIGURE 6: Cell proliferation achieves saturation in similar coulter density. 26 FIGURE 7: Cell cycle distribution changes according to coulter density. 27
FIGURE 8: Eko library cell fractions by cell volume. 30
FIGURE 9: Cell size fractionation based on size using counterflow elutriation 31
FIGURE 10: Elutriation samples labeling PCR 1. 32
FIGURE 11: Elutriation samples labeling pCR 2. 32
FIGURE 12: Comparison analysis between short-term eko library rapamycin-treated and eko
library not treated with rapamycin. 33
FIGURE 13: Comparison analysis between long-term eko library rapamycin-treated and eko
library not treated with rapamycin. 34
FIGURE 14: Comparison analysis between long-term and short-term eko library rapamycin-treated combined, and eko library not rapamycin-treated with rapamycin. 35
vi
List of abbreviations
CAD: Carbamoyl-phosphate synthetase CDC: Cell division cycle
CRISPR: Clustered regularly interspaced short palindromic repeats EIF3: Eukaryotic initiation factor 3
eIF4E: Eukaryotic translation initiation factor 4E EKO: Extended knockout
FBS: Fetal Bovine Serum
FKBP12: FK506-binding protein of 12 kDa GAP: GTPase activating protein
GeCKO: Genome-scale CRISPR/ Cas9 KO
HER2: Human epidermal growth factor receptor 2 HIF1α: Hypoxia-inducible factor 1-alpha
IGFR: Insulin-like growth factor receptor LAM: Angioleiomyomatosis
LKB1: Serine/Threonine-Protein Kinase LKB1 ml: Milliliter
MOI: Multiplicity of infection
MTHFD2: Bifunctional methylenetetrahydrofolate dehydrogenase/cyclohydrolase mTOR: Mechanistic target of rapamycin
mTORC1: Mechanistic target of rapamycin complex 1 mTORC2: Mechanistic target of rapamycin complex 2
NADPH: Nicotinamide adenine dinucleotide phosphate hydrogen NHEJ: Non-homologous end joining
PAM: Protospacer Adjacent Motif PBS: Phosphate buffered saline PPP: Pentose buffered saline
RANKS: Robust Analytics and Normalization for Knockout Screens S6Ks: Ribosomal S6 kinase proteins
S6K1: p70S6 Kinase 1
SREBP: Sterol responsive element protein TOR: Target of Rapamycin
TSC: Tuberous Sclerosis
TSC1: Tuberous Sclerosis 1 Protein TSC2: Tuberous Sclerosis 2 Protein
µg: Microgram
ULK1: Unc-51 Like Autophagy Activating Kinase 1 4E-BPs: eIF4E binding proteins
vii
Acknowledgements
I would like to thank all people whose assistance was special in the completion of this study. Firstly, I want to thank my supervisor Mike Tyers, who gave me the opportunity to work and learn a great deal during the time I spent in his lab. I am sure this opportunity is one of a kind, and will open many doors for me, professionally and as a person.
I want to thank all members of Tyer’s lab, who openly welcomed me and made my transition from the tropics to Canada a bit smoother. I’m grateful to have had the chance to share my days with such compassionate, helpful and fun people. Thanks Thierry, for your mentorship and effort. Thanks Jasmin, for your contribution to this study, it definitely would not have been feasible without your participation. I would also like to give a special thanks to Carol and Roger, both helped me both as a scientist and as a human being (and this is priceless), I really appreciate your time and care. Also, it was delightful to spend my days with Ghada, Samuel, Linnea and Daniel, all of them always bringing some fun and light (and sometimes snacks) to the room. Moreover, thanks to the whole group for sharing the days and the lab, you were incredible colleagues.
I have to also thank so many amazing people, that I have the blessing to know and were definitely angels in my journey: Unain, Wenn, Victor and Pedro. I honestly, would not have made it without you guys. The rest, I said already personally. And, a big list of amazing bright shining human beings that helped me in my journey: Jalila, Tulika, Nandita, Gabi, Mayra, Mari and Rafael.
Finally, I am grateful for my beautiful family and friends in Brazil for their support and being present as much as they could. Thank you Hanninha, for being family, loving, caring and supporting, Abdullah for being my beautiful partner in life and adventures. Ahabak, habibi.
7
Chapter 1
Introduction
1.1 The enormous variation of cell and organism size in nature
Among the ∼8.74 million species of existing eukaryotes on Earth (Mora et al. 2011), from fungi to mammals, size heterogeneity is amongst the most prominent features. Size and shape at the cell, tissue and organism level are characteristic for each species, and can often vary in accordance with environmental conditions (Vollmer, Casares, & Iber, 2017).
In 1926, Haldane stated “The most obvious differences between different animals are differences
of size, but for some reason the zoologists have paid singularly little attention to them”, and in
the same work concluded: “For every type of animal there is a most convenient size, and a large
change in size inevitably carries with it a change of form” (Haldane, 1926).
Andersen et al. (2015) stated how despite obvious differences in all organisms “biologists have
used organism size as a master trait to characterize the capabilities and limitations of individual organisms” (Andersen et al., 2015). Size has been used as a parameter to study a diverse range of traits in biology such as in predator and prey relationships (Hansen, Bjørnsen, & Hansen, 1997; Rall et al., 2012), fluid mechanical forces (Bejan, Marden, & Ansell, 2006), and metabolism (West, Brown, & Enquist, 1997). Moreover, differences in animal size have been shaped by evolution and has direct consequences on organism fitness (West et al., 1997).
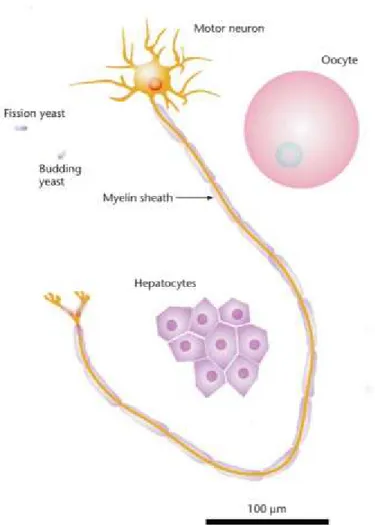
Animal development usually occurs in sequence from a smaller version of the individual organism followed by growth to the optimal size, as accomplished by cell growth and/or division (Conlon & Raff, 1999). Similarly, in metazoans different types of cells have different sizes and shapes that are attuned to specific functions. The heterogeneity in cell sizes is enormous, for example in humans a neutrophil is approximately 10 um in diameter while an adult neuron can be one meter in length (Figure 1) (Guertin & Sabatini, 2006). These observations underscore the importance of regulation of cell size and the underlying control mechanisms.
8
Figure 1: Cell size heterogeneity in nature.
Schematic representation of cell size variation within and between species. Single celled budding and fission yeast have an average size of 3µm, whereas in mammals hepatocytes are on average 20-30µm in diameter, oocytes are 100 µm in diameter, and neuron can be up to 1 meter-long. Taken from Guertin and Sabatini (2006).
1.2 The concepts of size, growth and division
In the present study, cell growth in dividing cells will be discussed. Accompanied by proliferation, cell size across successive generations is remarkably constant and characteristic of each species or cell type (Jorgensen & Tyers, 2004). This phenomenon is referred to as size homeostasis.
9
The terms cell size, growth, division and proliferation are often confused. Here, the term cell size is used to refer to the volume of a cell at the time of the measurement, typically measured by electrolyte displacement with a Coulter multisizer, which will usually correlate with cell mass. Cell growth is used to describe the process of mass accumulation due to macromolecular biosynthesis. This process leads to an increase in size or volume. For this reason, the term cell growth if often used to refer to the process of volume and size accumulation that results from an increase of mass (Guertin & Sabatini, 2006; Lloyd, 2013). Cell proliferation or cell division refers to duplication and segregation of the genome and other cellular components that generates two daughter cells from a precursor mother cell. (Salazar-Roa & Malumbres, 2016). Cell growth and cell division can be separable processes (Jorgensen & Tyers, 2002). An example of this is that cells can grow without division (e.g., a postmitotic neuron) and divide without growing (e.g., a fertilized egg) (Lloyd, 2013; Su & O’Farrell, 1998). However, typically cells grow in each division cycle to maintain the size of daughter cells close to that of the mother cell (Guertin & Sabatini, 2006). Each cell is thus thought to attain a minimal size in order to progress through the cell cycle (Su & O’Farrell, 1998), termed the size threshold. As above, the size threshold is dictated by cell type and differentiation state.
Cells appear to have an optimal size that maintains a specific volume to area ratio. For example, if cells become too large intracellular transport becomes inefficient, so large organisms are composed of more cells not bigger cells (Guertin, 2006). Cell size is also highly correlated with ploidy, such that increased ploidy leads to proportionately bigger cells (Jorgensen & Tyers 2002; Guertin, 2006). For example, during the development of a megakaryoblast (about 20–30 mm in diameter) into a granular megakaryocytes (±100 mm in diameter), cells do not divide but instead undergo multiple rounds of DNA replication (Guertin, 2006). Another example in an organism-specific context is the salamander, in which tetraploid animals are the same size as diploid animals but are composed of half as many cells of twice the size (Conlon & Raff, 1999; Fankhauser, 1952).
Nutritional status also regulates cell size. When under unfavorable nutrition conditions cells tend to be smaller from unicellular to multi-cellular organisms (Davie & Petersen, 2012; Fantes & Nurse, 1977; Kim et al., 2002). For example, yeast cells grown in a rich carbon source such as
10
glucose are larger than cells grown in a poor carbon source such as ethanol or glycerol. Interestingly, this nutritional dependency may operate at the organism level including for humans as observed in the reduced growth of children born during wartime (Hermanussen, Bogin, & Scheffler, 2018).
The deregulation of cell size is often linked to disease, and many examples can be cited. Tuberous sclerosis (TSC) and angioleiomyomatosis (LAM), which cause the development of benign tumors in the brain, kidney, lungs, and skin are due to mutations in TSC1 or TSC2, leading to hyper-growth signaling (Guertin, 2006). Peutz–Jeghers syndrome is another disease related to mutations in the growth-regulator gene, LKB1, leading to benign tumors in the stomach, intestine, and skin (Guertin, 2006). Fetal macrosomia describes the oversize of a newborn, which occurs in 15-45% of diabetic mothers. These newborns tend to develop hypertrophic cardiomyopathy, obesity, diabetes, and this condition is believed to be result of the maternal hyperglycemia leading to fetal hyperglycemia (Araujo et al., 2017; Kamana et al., 2015; Mormile, 2016).
In the cancer context, the loss of control over size, growth and division is virtually universal and represents on the hallmarks of cancer (Hanahan & Weinberg, 2011). The ability to maintain chronic proliferation, either by activating mutations, disrupting negative feedbacks or by the excess of proliferative signaling thus leads to the ablation of size, growth and tissue architecture homeostasis (Hanahan & Weinberg, 2011).
1.3 Size homeostasis results from the balance between cell growth and cell
division
Cell growth and cell division are fundamental to organismal growth (Conlon & Raff, 2003), and the cell cycle is a primary process that effects coordination of growth and proliferation. In proliferating cells this coordination can occur through both the dependency of division on growth and growth on division (Jorgensen & Tyers, 2002). The cell cycle is an all-or-nothing process that progresses in an unidirectional manner and depends on a host of mitogenic factors in multicellular organisms, including humans. Unlike microorganisms, metazoans require growth
11
factor signaling and may arrest or undergo autophagy despite abundant extracellular nutrients (Lloyd, 2013; Lum et al., 2005; Conlon & Raff, 1999). Although the signaling processes that trigger division have been described in great detail, precisely how cells coordinate cell growth and cell cycle progression to maintain an equilibrium or homeostatic size is not known.
Cells must achieve a minimum size in order to commit to cell division. Many observations demonstrate that a cell size threshold in late G1 phase gates entry into the division cycle. In 1926, Hartman (Hartmann, 1926)published the first results indicating that cells need to achieve a specific size to divide. In Amoeba proteus¸ he periodically amputated part of the amoeba’s cytoplasm for more than 150 days. This experiment blocked cell division during the entire period of the experiment, during which time control cells divided 65 times. Some years later, the same experiment was reproduced and similar results were found (Prescott, 1956). In E.coli, cells displayed a uniformly consistent size at the initiation of DNA synthesis (Donachie, 1968), suggesting that bacteria also need to achieve a minimum size before division.
1.4 Cell size threshold in yeast
In the early 1970s experiments in the fission yeast Schizosaccharomyces pombe (S. pombe) and the budding yeast Sacharromyces cerevisiae provided the first genetic evidence for cell size control (Hartwell, Culotti, & Reid, 1970; Hartwell et al., 1973; Nurse, 1975). Through identification of mutations that led to the arrest of the cell cycle in different phases, many cell division control genes (abbreviated cdc in S. pombe and CDC in S. cerevisiae) opened the field to the study of the relationship between cell growth and cell division. It was immediately obvious that mutant cells with a defective cell cycle kept growing, reaching volumes of two to three-fold of the control volume. Whereas, cells in low nutrient conditions or with mutations in nutrient signalling processes displayed cell cycle arrest in G1 (Hartwell et al., 1970; Hartwell et al., 1973; Johnston, Pringle, & Hartwell, 1977). This was the first time that the term critical cell size was used, meaning that cells need to achieve a minimum volume to proceed in the cell cycle, i.e., the first indication of a cell size threshold. In this context, the concept of “Start” arose defining the moment when yeast commits to the cell division, after acquiring the critical size at the end of G1 (Johnston et al., 1977). This study led to the view that growth and division are separate but
12
coupled processes since cells can grow without dividing. More recent studies showed that the cell cycle exerts reciprocal control on cell growth. For example, Goranov et al. (2009) found that growth rates change during different phases of the cell cycle, being the highest during anaphase and G1.
In yeast, the interplay between environmental conditions and size were first demonstrated to influence size homeostasis. The investigation of cell size and proliferation of S. pombe under different experimental conditions showed that both temperature and nutritional deprivation affected the size. Poor nitrogen, carbon or phosphate availability resulted in decreased growth rates, size, and proliferation (Fantes & Nurse, 1977). Based on the results obtained in their investigation on cell size upon environmental conditions, Fantes & Nurse (1977), stated that “The cell size necessary for the nuclear division is set, or modulated, by the prevailing growth conditions”.
In the same year, Fantes & Nurse (1977) used temperature sensitive mutants to evaluate the relationship between cell size and cell cycle time in S. pombe. A cdc mutant strain that grew normally at 25°C but arrested in nuclear division at 35°C was used to generate abnormally large cells that exceeded the size threshold and entered division rapidly upon return to 25°C (Fantes & Nurse, 1977). Taken together, these results and many other experiments consolidated the concept that a commitment point at the end of G1 phase gates irreversible entrance into the cell cycle and that passage through this point depends on growth to a minimal cell size.
1.5 Cell size threshold in animals
The discussion about a cell size threshold in mammalian cells started in the mid-'60s. In classic studies published in 1965, Killander & Zetterberg (1965a; 1965b) provided the first clear evidence that “cells which had just started their DNA synthesis showed less mass variation than cells in initial phases of interphase, indicating the relationship between cell mass and the initiation of DNA synthesis” (Killander & Zetterberg, 1965b).
13
In the first such study in mouse fibroblasts, it was shown that DNA synthesis is initiated only upon attaining a critical size or mass and that small new daughter cells require more time to achieve this critical mass whereas bigger cells requires less time (Killander & Zetterberg, 1965a). In further study on mouse fibroblasts populations, smaller cells correspondingly spent a longer period in G1 than bigger cells, corroborating the idea that initiation of DNA synthesis depends on a minimal cell mass (Killander & Zetterberg, 1965b).
After this pioneering research many groups started to investigate the cell size threshold in mammalian cells in different conditions and different models. G1 phase displayed a longer duration in small daughter when in comparison with bigger mother cells, resulting in an unequal division in Chinese hamster cells, rat oligodendrocytes precursor cells, and mouse embryonic fibroblasts (Gao & Raff, 1997; Kimball et al., 1971; Shields et al., 1978). These studies helped to buttress the idea that like single-celled eukaryotes the mammalian system also has a size threshold (Figure 1.2). Serum starvation and amino acid deprivation also caused cells to fail to proliferate and became quiescent. This quiescent state was reversed upon the restoration of optimal nutritional conditions (Pardee, 1974). This study led to the idea that mammalian cells have a “restriction point”, analogous to start in yeast, in which commitment to division depends on growth to a minimal size (Figure 1.2).
Conlon and Raff (2003), argued in rat Schwann cells a cell size threshold may not be needed to maintain the size distribution. Schwann cells appear to grow at the same rate independent of their initial size suggesting that cells may converge to a uniform size by the simple fact that smaller cells grow proportionately faster than large cells (Conlon & Raff, 2003). However, this effect may be cell type specific as considerable more recent data strongly argues that a size threshold does operate in mammalian cells, as discussed extensively in Ginzberg et al. (2018). As in yeast, the mammalian cell cycle also appears to exert control over cell growth in certain contexts (Neurohr et al., 2019).
14
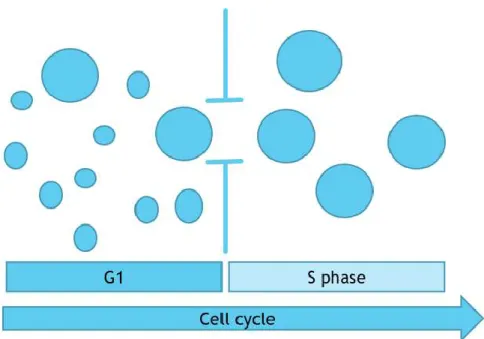
Figure 2: Critical cell size threshold
Scheme representing cells in different distributions of size in G1 growing until achieving the minimal sufficient size to pass the cell size threshold (vertical bars), entry in S phase and commit definitely to the cell cycle. Adapted from Ginzberg, Kafri, & Kirschner (2015).
1.6 Cell size screens in yeast
Whole-genome systematic screens in S. cerevisiae allowed the identification of essential genes and genes that resulted in growth defects (Winzeler et al., 1999) and started a new era of systems genetics. Application of these genome-scale reagent collections to the problem of cell size identified hundreds of new genes that directly or indirectly regulate cell size and the cellular processes involved in this regulation (Jorgensen et al., 2002; Jorgensen et al., 2004). In 2002, Tyers Lab published the first global gene deletion of around 6000 strains, analysing the effect of gene loss on cell size using cultures in exponential growth, identifying that 10% of gene deletions result in a size phenotype (Jorgensen et al., 2002). This study tested the effect of diploid mutations in essential genes, finding an increase in size in up to ∼40% (large or lge) of the strains, and an opposite effect in ∼15% (small or whi), when compared with the median cell
15
size. As a conclusion, it was discussed that larger haploinsufficient cells are often defective in components of the 26S proteasome, γ-tubulin complex and ribosome biogenesis; while whi mutants often are involved in ribosome biogenesis, nucleolar function and ribosomal subunits. Further on, ∼500 strains with haploid deletions and sizes distinct from wild-type cells, required more tests in order to define genes that directs cell size at Start. Finally a synthetic genetic array was performed (i.e. synthetic lethal interactions with known regulators of Start), and between several whi mutants WHI5, CDH1, and SFP1 were negative regulators of Start (Jorgensen et al., 2002). In 2002, Zhang et al. (2002) performed a similar analysis on stationary phase cells and recovered many of the same genes.
Among the many genes identified in these studies, a number appeared to be central regulators of growth and division including Sfp1, Sch9, Cdh1, Prs3, and Whi5. Sfp1 and Sch9 are both involved in ribosomal biogenesis and serve to activate the ribosomal protein (RP) and ribosome biogenesis (Ribi) regulons downstream pathway of the TOR (Target of Rapamycin) signaling network. TOR is highly conserved from yeast to mammals, and in yeast it controls the interplay between nutritional and translational status and ribosomal production via Sfp1 and Sch9 (Gonzalez & Rallis, 2017; Lempiäinen et al., 2009; Loewith et al., 2002; Singh & Tyers, 2009; Urban et al., 2007).
1.7 The mechanistic target of rapamycin
Studies in yeast, flies, mice and human cells revealed the conserved target of rapamycin (TOR) pathway to be a crucial regulator of cell growth and cell size. In metazoan cells, this pathway is now referred to as the mechanistic target of rapamycin or mTOR pathway.
The PI3K/AKT/mTORC1 pathway is evolutionarily conserved and shown to be a crucial regulator of cell growth and size (Lloyd, 2013). In mammals there is one TOR gene that encodes for the catalytic subunit of two complexes: mTORC1 and mTORC2 (Jefferies et al., 1997; Wullschleger, Loewith, & Hall, 2006b; Saxton & Sabatini, 2017). mTOR is a serine/threonine protein kinase, which forms two distinct mTOR complexes differs from its molecular
16
components, sensitivity to its inhibitor rapamycin, downstream targets, and cellular responses (Figure 3) (Morita et al., 2015; Saxton & Sabatini, 2017).
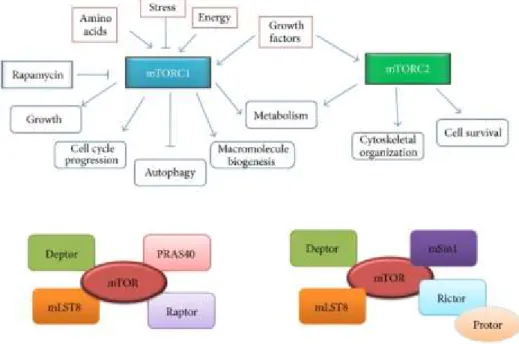
Figure 3: mTORC1 and mTORC2 complexes: Composition, extracellular interactors, and cellular responses.
The central mTOR kinase forms two distinct complexes: mTORC1 and mTORC2. mTORC1 senses cellular levels of amino acids, stress, energy levels, growth factors, and is sensitive to rapamycin. In response to this stimulus it orchestrates growth, cell cycle, autophagy, macromolecule biogenesis and metabolism. Differently, mTORC2 respond to growth factors, regulating the cytoskeletal organization and cell survival. Despite having the same central mTOR kinase, the complexes are composed of different proteins. Taken from Showkat, Beigh, & Andrabi (2014a).
The mTOR complex 1 promotes anabolic metabolism: ribosome biogenesis, lipid synthesis, mRNA translation. Because of its role in the metabolism mTORC1 is a central player of cellular systems being a sensor of nutrients, growth factors, stress, oxygen and energy levels of the cell (Wullschleger et al., 2006b; Sengupta, Peterson, & Sabatini, 2010; Loewith et al., 2002). These topics will be discussed in the next section.
TOR was first discovered due to the identification of a compound with antimicrobial, immunosuppressive, and antitumor properties, later named rapamycin due to its isolation in the South Pacific island of Rapa Nui in 1964 (Saxton & Sabatini, 2017). Budding yeast cells treated
17
with rapamycin displayed a similar phenotype as cells depleted for the TOR1/2 genes, i.e., an arrest in G1 (Barbet et al., 1996). Absence of TOR function caused translation inhibition and characteristics of cells entering in GO caused by starvation. This study suggested TOR is a crucial sensor of nutritional status and is required for growth and consequent cell cycle commitment (Barbet et al., 1996). Subsequent work investigating TOR in different models revealed a plethora of functions. From yeast to humans TOR has conserved in the regulation of growth, and it was probably one of the biggest milestones in the understanding of eukaryotic regulation of size, proliferation and cell cycle progression (De Virgilio & Loewith, 2006; Loewith et al., 2002; Wullschleger et al., 2006b).
The core components of mTORC1 are mTOR, Raptor, and mLST8. Raptor acts to recruit substrate to the complex and confers correct subcellular localization whereas mLST8 interacts with the mTORC1 catalytic domain and promotes kinase activation (Guertin et al., 2006; Saxton & Sabatini, 2017). mTORC1 is sensitive to acute rapamycin treatment, whereby a complex of rapamycin-FKBP12 (FK506-binding protein of 12 kDa) binds and inhibits mTORC1 (Chiu, Katz, & Berlint, 1994; Saxton & Sabatini, 2017; Roux & Topisirovic, 2012).
Downstream targets of mTOR mediate the cellular responses initiated by both TORC complexes. mTORC1 plays a central role in anabolic processes by regulating the rates of protein synthesis and turnover, as well as lipid, nucleotide and glucose metabolism (Morita et al., 2015; Saxton & Sabatini, 2017). Protein synthesis is mainly mediated by mTORC1 through the phosphorylation of S6K1 and 4EBPs. The direct phosphorylation of S6K1 by mTORC1 promotes mRNA translation initiation by the activation of several substrates. 4EBP is another branch of mTORC1 protein synthesis, in which 4EBP is phosphorylated by mTORC1 causing its dissociation from eIF4E, thus enabling mRNA translation (Saxton & Sabatini, 2017).
The metabolism of lipids, nucleotides, and glucose is especially important for membrane formation and maintenance. This metabolism is mediated by transcription factors. In this study SREBP (sterol responsive element binding protein) was found to be controlling the expression of genes that regulate both fatty acids and cholesterol biosynthesis (Brown & Goldstein, 1997; Saxton & Sabatini, 2017). Since mTORC1 acts as a sensor of sterol levels, and upon its low
18
levels initiates a cascade of SREBP activation through S6K1, this might be the interface between SREBP and mTORC1 (Porstmann et al., 2008; Saxton & Sabatini, 2017).
The synthesis of nucleotides necessary for DNA and ribosome biogenesis is crucial for cell proliferation. In this context mTORC1 is related to those events by two branches: the expression of MTHFD2, that is involved in de novo purine synthesis by the regulation of the mitochondrial tetrahydrofolate cycle and, by S6K1 phosphorylation of CAD (carbamoyl-phosphate synthetase), regulating pyrimidine synthesis (Ben-Sahra et al., 2016; Saxton & Sabatini, 2017; Trajkovska, 2013).
The regulation of proliferation is also facilitated by mTORC1 through the control of oxidative phosphorylation versus glycolysis promoting the transformation of nutrients in biomass. HIF1α controls the expression of glycolytic enzymes, which in turn has its expression regulated by mTORC1. Also, the activation of SREBP (sterol regulatory element-binding protein) promotes proliferation mediated by S6K1, promoting an increase in the flux through the oxidative pentose phosphate pathway (PPP) leading to a change in the energetic metabolism to generate NADPH (Düvel et al., 2010; Saxton & Sabatini, 2017).
Besides the enhancement of cell anabolic processes, mTORC1 stimulates cell growth through the suppression of catabolism in particular autophagy. Under favorable nutritional status mTORC1 prevents the activation of ULK1, an important autophagosome driver (Saxton and Sabatini 2017). Another means by which mTORC1 regulates protein turnover is by the regulation of protein ubiquitylation and proteasome-dependent degradation (Saxton & Sabatini, 2017).
1.8 Downstream effectors of mTORC1
Protein translation is a complex process composed of many steps and different molecules. In this context mTORC1 controls many cellular functions. One in particular being ribosome recruitment to mRNA by activating two major players in the translational machinery: eukaryotic translation initiation factor 4E (4E-BPs) and the ribosomal S6 kinase proteins (S6Ks) (Nissim Hay & Sonenberg, 2004; (Jefferies et al., 1997; Wullschleger, Loewith, & Hall et al., 2006a).
19
One of the crucial points of eukaryotic translation regulation is ribosome recruitment to the 5’ mRNA end in the start codon (Gingras, Raught, & Sonenberg, 1999). These structures possess a cap recognition region (m7GpppN, “m” representing a methyl group and “N”, any nucleotide) that has many functions, including pre-mRNA processing, mRNA stability and its export and translation (Showkat, Beigh, & Andrabi, 2014b). Translation initiation factors facilitate ribosome binding to the mRNA 5’ end, where eIF4E binds specifically promoting cap-dependent translation initiation mediated by eIF4E binding proteins (4E-BPs) phosphorylation (Wullschleger et al., 2006a).
The translation is then followed by the unwinding of the molecule that is mediated by eIF4E (Hay & Sonenberg, 2004). Several proteins involved in the process of ribosomal recruitment machinery are directly or indirectly targeted by mTOR either by phosphorylated or sequestration by 4E-BPs (Hay & Sonenberg, 2004; Showkat et al., 2014b). 4E-BP1 is phosphorylated by mTORC1 in several residues, promoting the inhibition of eIF4E dependent translation initiation and consequently of protein translation inhibition (Showkat et al., 2014b).
S6K1 is the most well-characterized mTORC1 target. The S6K family is composed of two genes, S2K1 and S6K2 that share 70% homology. It is a serine/threonine kinase composed of five domains, and when phosphorylated in its serine/threonine region opens the kinase domain releasing its autoinhibition (Tavares et al., 2015; Showkat et al., 2014b). This family has a pronounced role in the control of cell growth and cell size. In mice knockout of those proteins have opposite outcomes: while S6K2 knockout leads to increased size, S6K1 generates animals smaller than controls (Shima et al., 1998) and the double S6K knockouts lead to perinatal mortality (Pende et al., 2004; Shima et al., 1998).
The S6K family interacts with a plethora of proteins, regulating many different cellular outcomes: metabolism, apoptosis, cell proliferation, signal transduction, cytoskeleton organization, inflammation, protein synthesis, mRNA, transcription, splicing, transcription and cell survival (Showkat, et al., 2014b; Tavares et al., 2015).
20 1.9 mTORC1 and cancer
Due to its broad impact in the maintenance of cell homeostasis, aberrant activation of mTOR pathway is involved in many diseases including cancer. Both activation of oncogenes or loss of tumor suppression upstream and downstream mTOR are found in many cancers and directly impact cell growth, metabolism and proliferation (Showkat et al., 2014b; Wullschleger et al., 2006b).
Upstream mTOR alterations are common. Growth factor receptor overexpression such as IGFR (insulin-like growth factor receptor) and HER2 (human epidermal growth factor receptor 2), can lead to activation of mTOR pathway (Showkat et al., 2014b). Several PI3K pathway components are mutated in human cancers including amplification of genes encoding the catalytic subunits of PI3K and AKT, activation of the Ras small GTPase and mutation of the PTEN lipid phosphatase (Laplante & Sabatini, 2012; Hay & Sonenberg, 2004; Simpson & Parsons, 2001). Oncogenic activation of the networks upstream of mTOR triggers cell growth, proliferation and survival (Laplante & Sabatini, 2012). Related alterations in more direct interactors of mTOR like mutations in TSC1 and TSC2 causing hamartomas and a frequent amplification in Rheb locus involved in development and poor prognosis of many epithelial and squamous cancers further underscore the key role of the mTOR pathway in cancer (Armijo et al., 2016; Hay & Sonenberg, 2004).
Growing evidence suggests that the machinery downstream mTOR leads to unbalanced proteins synthesis and plays a central role in the cancer genesis. 4EBP1/eIF4E is involved in tumor formation as upon its loss 4EBP1/2 causes activation of cap-dependent translation promoting cell-cycle progression and proliferation (Dowling et al., 2010). Both 4EBP1 and eIF4E are critical players in the PI3K-Akt-mTOR oncogenic activity. Hsieh et al. (2010) showed the hyperactivation of 4EBP-eIF4E axis increasing tumor growth, and the phosphorylation of 4EBP1 being required for the increase of protein synthesis and cell size control downstream of AKT signaling. Lynch et al. (2004) discussed that eIF4E is a cell cycle and cell size rate-limiting component, that controls G1 by translation initiation factors orchestration. Also in the mTORT and cancer context, S6K1 is an important arm downstream in the pathway, and its role in
21
oncogenesis is still debated. S6K1 was found overexpressed in ovary cancer and its gene expression is upregulated in brain tumors (Bärlund et al., 2000; Ismail, 2012). However, its contribution to the oncogenic action of ERK and/or Akt is debated (Hsieh et al., 2010; She et al., 2010).
1.10 Systematic mammalian cell size screens and CRISPR/Cas9 genome-editing technology
Previous studies in budding yeast revealed hundreds of genes that regulate size. Those results were possible due to large-scale technologies which made possible the generation of a genome-wide deletion collection, and the use of this collection in numerous genetic screens (Dungrawala et al., 2012; Jorgensen et al., 2002; Zhang et al., 2002). Many gene functions revealed by these screens are conserved such as the mTOR network (Virgilio & Loewith, 2006; Jorgensen & Tyers, 2002). These findings motivated the application of large-scale approaches to screen the genes that regulate cell growth and cell division in mammalian cells. In the early 2000s studies using small interfering RNA (siRNA) or short hairpin RNA (shRNA) libraries yielded new insights into cancer and other processes but high rates of off-target effects compromised the interpretation of screen hits (Echeverri et al., 2006). The advent of technology based on the clustered regularly interspaced short palindromic repeats (CRISPR) targeted endonuclease system of bacteria has enabled high fidelity genome-scale screens that have revolutionized functional genomics in mammalian cells.
CRISPR/Cas9 technology is based on the immune system of bacteria and archaea against the invading virus. The resistance is founded on the incorporation of short DNA sequences of the invader in genomic CRISPR loci that functions as a genetic memory, such that upon the recognition of the foreign sequence the host can destroy the sequence using cas9 CRISPR-associated genes (Brouns et al., 2008).
Between the different CRISPR forms, most well characterized is from Streptococcus pyogenes. CRISPR/Cas9 functions as a molecular scissor that identifies its target DNA sequence using an RNA-guided double-stranded DNA nuclease (Garneau et al., 2010; Jiang & Doudna, 2017). The
22
enzyme Cas9 (S. pyogenes) direct its double strand cut using a short 20 nucleotide sequence of DNA associated with a guide RNA (Figure 4) (Jiang & Doudna, 2017).
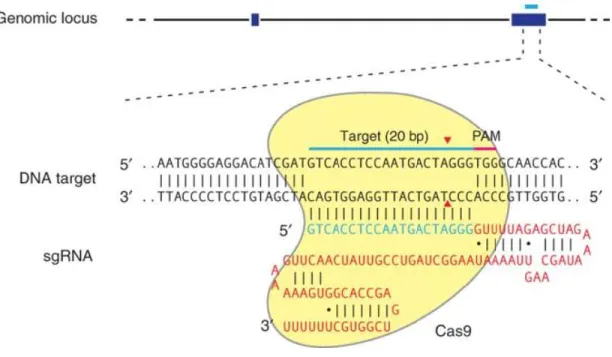
Figure 4: The CRISPR/Cas9 function
The CRISPR/Cas9 system is based on the targeting of specific DNA sequences, directed by a 20 nucleotide sgRNA (blue) generating a double strand break created by the Cas9 enzyme 3 base pairs upstream of the PAM motif. Taken from Ran et al. (2013).
Initially, the system was designed to contain a tracrRNA (trans-activating CRISPR RNA), host factor ribonuclease (RNase) III, and Cas9 nuclease (Brouns et al., 2008). Improvements in the technology were made generating a single sgRNA fusion containing all the previous components, and the addition of the Protospacer Adjacent Motif (PAM) flanking its 3’ end of the DNA target sequence (Figure 4). The Cas9 scans the DNA, allowing the sgRNA to pair with complementary sequence and Cas9 to cut the sequence in average 3 or 4 nucleotides upstream the PAM sequence (Brouns et al., 2008).
The DNA breaks generated by the Cas9 activate repair mechanisms. Based on the kind of break that the Cas9 induces in the DNA the most common repair mechanism activated is the NHEJ (non-homologous end joining). This mechanism is error-prone, it causes deletions and insertions
23
(indels) at the break site. This often causes changes in the frameshift read, and consequent protein inactivation (Cong et al., 2013; Ran et al., 2013).
The CRISPR/Cas9 system quickly became an easy, cost-effective precise and versatile tool for gene editing that was rapidly adapted into interrogate gene function on a genome-wide scale in mammalian cells. A GeCKO (Genome-scale CRISPR/Cas9 KO) library of pooled sgRNAs targeting around 18,000 RefSeq genes was generated with a coverage of 3 sgRNAs per gene (Shalem et al., 2014). In the same year, a smaller library was generated, targeting approximately 7000 genes with a coverage of 10 sgRNAs per gene and the addition of 100 non-targeting sgRNAs as controls (Wang et al., 2014). Those studies helped to build the large-scale design of pooled libraries using CRISPR/Cas9 technology in mammalian cells. In a previous study, Tyers group created a genome-wide extended knockout (EKO) library (Bertomeu et al., 2017). The EKO library contains 278,754 sgRNAs that targets 19,084 RefSeq annotated genes, and an extended fraction of the library including 20,852 sgRNAs targeting alternative exons and 3,872 hypothetical genes. In order to interrogate the molecular pathways that regulate cell size in humans, I used this library and performed a large-scale knockout screen in a chemical epistasis approach using rapamycin as a specific inhibitor of the major size and growth regulator, mTOR.
24
Chapter 2
2. RESULTS
2.1. Culture density effects on cell size and cell cycle distribution
Finding the optimal conditions for cell culture is critical for reproducibility and accuracy. In this study the aim was to evaluate cell size therefore, validating that this variable was not affected by culture conditions was crucial to ensure the quality of the analysis. As discussed before growth and division are coupled phenomena, and for this reason the impact of cell density and division over size was evaluated. Initially, NALM-6 growth rates and size were characterized. Cells were seeded at different concentrations and followed for 4 days without further dilutions. Those samples were red on the Z2 Coulter to asses size and concentration and were evaluated in the coulter daily. NALM-6 is a pre-B acute lymphoblastic leukemia cell. This cell grows in suspension and has a doubling time of 25 hours, those characteristics allows a reproduction at the cell counting time and suspension cells are ideal to perform the elutriation. Also, NALM-6 is widely used in studies evaluating mTOR, and has expression of all key components of PI3K/Akt/mTOR pathway (Simioni et al., 2014).
25
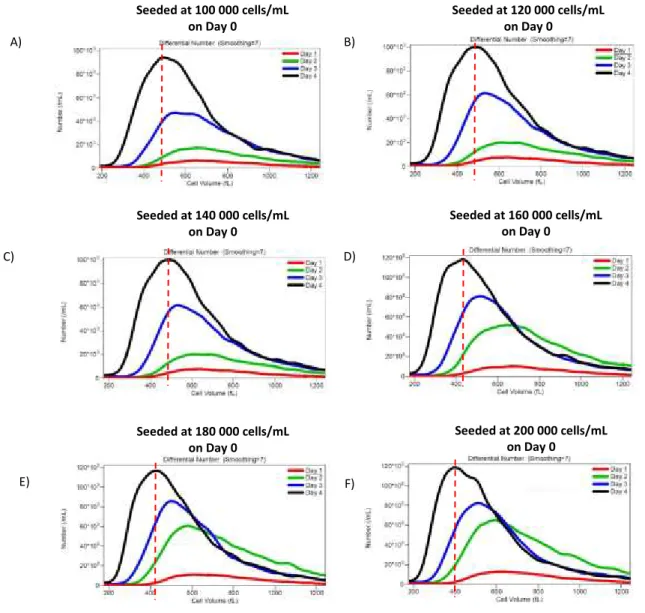
Figure 5: Cell size depends on culture density.
Asynchronous cells were seeded in different concentrations followed by the measurement of size and density during a 4 day period. Initial cell density was A) 1000 000 cells per mL. B) 120 000 cells per mL. C) 140 000 cells per mL. D) 160 000 cells per mL. E) 180 000 cells per mL. F) 200 000 cells per mL. The dashed lines represent the cell size in the major concentration of cells in the fourth day, showing a smaller cell size phenotype in all concentrations starting from 160 000 cells per mL (D).
Regarding cell size it was observed that cell density leads to smaller cells when comparing different days in the same experiment (figure 5 A-F). This observation was even more dramatic when comparing experiments from lower initial density (figure 5 A) with those with higher cell density (figure 5 F) Seeded at 100 000 cells/mL on Day 0 Seeded at 120 000 cells/mL on Day 0 A) C) E) Seeded at 140 000 cells/mL on Day 0 Seeded at 160 000 cells/mL on Day 0 Seeded at 180 000 cells/mL on Day 0 Seeded at 200 000 cells/mL on Day 0 B) D) F)
26
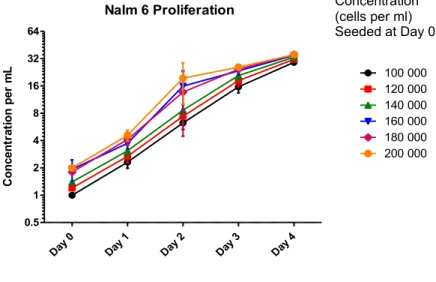
When analysing the proliferation rates of the above-mentioned experiment it was observed that the lower concentrations (100 000, 120 000 and 140 000 cells per mL) start to reach the proliferation plateau at day 3, while the most concentrated samples reach the same levels at day 2. This effect occurred in both groups of samples in around 1 600 000 cells per ml (Figure 6).
Figure 6: Cell proliferation achieves saturation in similar coulter density.
Nalm-6 cells seeded in different concentrations were quantified daily. Cells from different initial concentrations achieved saturation in similar culture density in all evaluated concentrations.
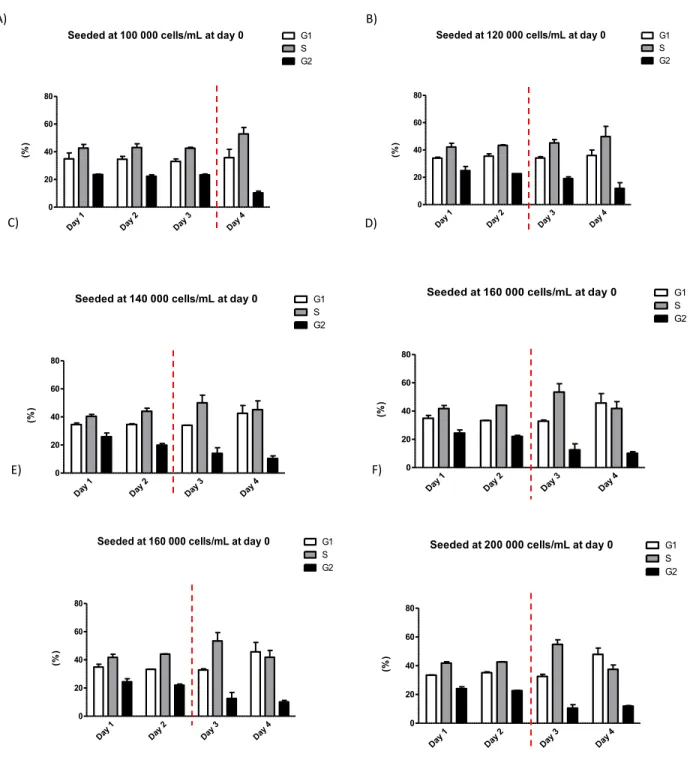
The same experiment was also analysed for changes in the cell cycle. Cells were ethanol-fixed, and cell cycle distribution was assessed by FACS based analysis of DNA content (Figure 7). The dashed lines indicate at what day the cell cycle pattern started to change. At a 100 000 cells per mL the cell cycle started to change at day 4 (Figure 7 A), the other experiments started showing a different cell cycle distribution at day 3 (Figure 7 B-F).
Nalm 6 Proliferation Day 0 Day 1 Day 2 Day 3 Day 4 0.5 1 2 4 8 16 32 64 100 000 120 000 140 000 160 000 180 000 200 000 Co n ce n tr at io n p er m L Concentration (cells per ml) Seeded at Day 0
27
Figure 7: Cell cycle distribution changes according to coulter density.
Cell cycle distribution for all the seeded concentrations was evaluated using FACS/PI. The dashed lines represent changes in the cell cycle distribution compared to previous days. Cell cycle distribution for the less concentrated dilution (A) started to change at day 4, further on all dilutions displayed different cell cycle distribution from day 3 (B-F). In the most concentrated dilations (D-F) it’s possible to see an increase in G1 distribution on day 4, being the G1
Seeded at 120 000 cells/mL at day 0
Day 1 Day 2 Day 3 Day 4 0 20 40 60 80 G2 G1 S (% )
Seeded at 100 000 cells/mL at day 0
Day 1 Day 2 Day 3 Day 4 0 20 40 60 80 G2 G1 S ( % )
Seeded at 140 000 cells/mL at day 0
Day 1 Day 2 Day 3 Day 4 0 20 40 60 80 G2 G1 S ( % )
Seeded at 160 000 cells/mL at day 0
Day 1 Day 2 Day 3 Day 4 0 20 40 60 80 G2 G1 S ( % )
Seeded at 160 000 cells/mL at day 0
Day 1 Day 2 Day 3 Day 4 0 20 40 60 80 G2 G1 S ( % )
Seeded at 200 000 cells/mL at day 0
Day 1 Day 2 Day 3 Day 4 0 20 40 60 80 G2 G1 S ( % ) A) C) E) B) D) F)
28
distribution from the most concentrated seeding which was the highest from all evaluated experiments (F).
The variation in cell cycle distribution appears to be related to cell density. In all cases, the first modification in the cell cycle was a maintenance S phase, increase in S, and decrease in G2 phase (Figure 7 B-F). The increase in cell density showed a change in this pattern: in the samples seeded at 120 000 cells per mL (Figure 7 B), day 4 displayed a similar distribution as observed in day 3 tending to increase in S phase and decrease in G2. In all the experiments with higher initial concentrations starting from 140 000 cells per mL (Figure 7 C) presented an increase in G1 arrest and at day 4 when compared with day 3 (Figure 7 C-E).
Initially, it was observed that up to 100 000 cells per mL the cell size distribution does not change in any of the observed days (Figure 5 A, B, and C). Cells started to display a reduction in cell size in the later initial cell density (Figure 5 D, E, and F) in all the observed days with a dramatic reduction in size in the last observed day from the initial concentration of 200 000, i.e., the most concentrated culture density used (Figure 5 F). Those results can be correlated to the ones in the cell cycle distribution where the changes in cell cycle distribution appear to happen before the change in size (Figure 7 A, B, C, D, E, and F). With attention to day 4 of the 200 000 experiment the only observed experiment with a strong G1 arrest (Figure 7 F), was also the one that reached the smallest cell size.
Finally, as observed in Figure 6, the exponential phase of the cells in all the seeded initial concentrations started in 400 000 per ml and all the concentrations achieved a proliferation plateau at an overall of 1600 000 cell per mL. This result helped to set the optimal work concentration for further analysis. Since this study aimed to analyze the genetic regulators of size, cells needed to be kept in the exponential proliferation phase to avoid cell synchronization and unwanted bias.
The analysis does not differentiate between cells in early G1 and late G1, and heterogeneity of the G1 distribution might be masking the effect of loss in size inside of the analysed cell cycle phases. Nevertheless, on day 4 at the densest concentrations the effect of higher G1 distributions
29
(Figure 7 D, E and F), can be seen in the analysis of size (Figure 5 D, E and F), with special attention to the Figures 5 and 7 D, the one with the most intense loss in size and G1 arrest. Taking in consideration all the results obtained in these experiments an optimal cell density 400 000 cells per mL was used in all further experiments.
2.2 A chemical epistasis size screen with rapamycin
The possibility to interrogate gene function in a large-scale manner also brings different possibilities to be added to the interrogation about epistasis. In particular, chemical perturbations can mimic genetic mutations such that the addition of specific drugs can be used as a powerful means to investigate gene interactions and functions, regulation and dynamics of essential genes and drug mechanism of action. Epistasis or genetic interaction was first discussed by Bateson (1909), as the ‘masking of one mutation by another'. Nevertheless, the meaning of the word developed into many interpretations. Currently ‘epistasis’ is understood as different events that regulate molecular mechanisms controlling biological outcomes and phenotypes. Also, the term can be used as ‘intramolecular’ and ‘intermolecular epistasis’, interactions that can occur between gene variants and between different genes; ‘antagonistic’ or ‘synergistic epistasis’, alleviating or amplifying interactions that can be between a drug and one or more gene function (Lehner, 2011). Therefore, the use of drugs to investigate genetic interactions can be defined as chemical epistasis.
Accordingly, the aim was to interrogate the genetic network of cell size control in human cells by using a chemical epistasis approach in conjunction with whole-genome CRISPR/Cas9 loss-of-function screen based on counterflow centrifugal elutriation to generate cell fractions of different sizes.
30
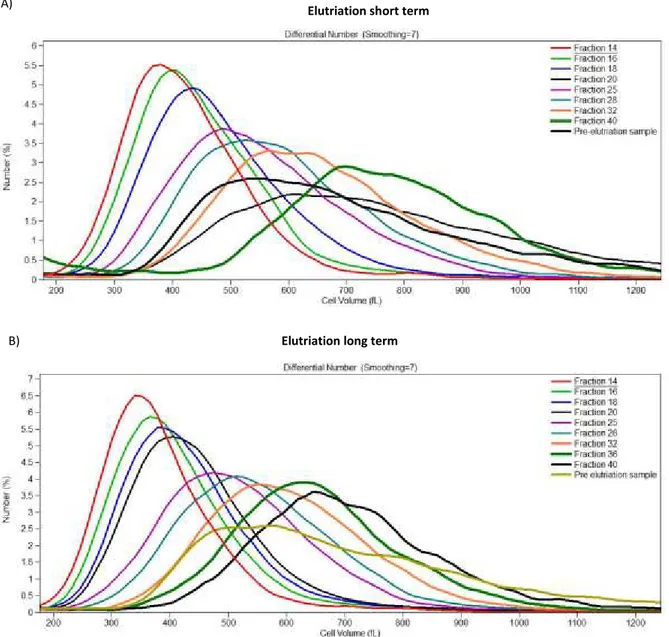
Figure 8: EKO library cell fractions by cell volume.
The extended knockout library was treated with rapamycin and fractionated based on cell volume by counterflow centrifugal elutriation. Cell fraction distributions show the appropriate achievement of defined fractions with different sizes.
A CRISPR-based whole-genome knockout library (EKO library) pool was treated with the specific mTOR inhibitor rapamycin at 10 nM for 24 hours and further allowed to grow for 7 (Figure 8 A) and 14 days (Figure 8 B). Different library growth times referred to as short term and long term were generated to compare the impact of in two different times the impact of protein depletion. Considering that some proteins may have a longer half-life therefore, residual levels might be influencing genetic interactions. After rapamycin treatment the libraries were
Elutriation long term
B)
Elutriation short term
31
fractionated using counterflow elutriation. This method separates cells from different sizes using the opposition of centrifugal force - produced by the separation chamber coupled in a spinning rotor - with the fluidic force imposed by the constant of a fluid. The fluid force created by the fluid pump is increased gradually, allowing the displacement of different cell fractions (Figure 9) (Grosse et al., 2010; Morijiri et al., 2010).
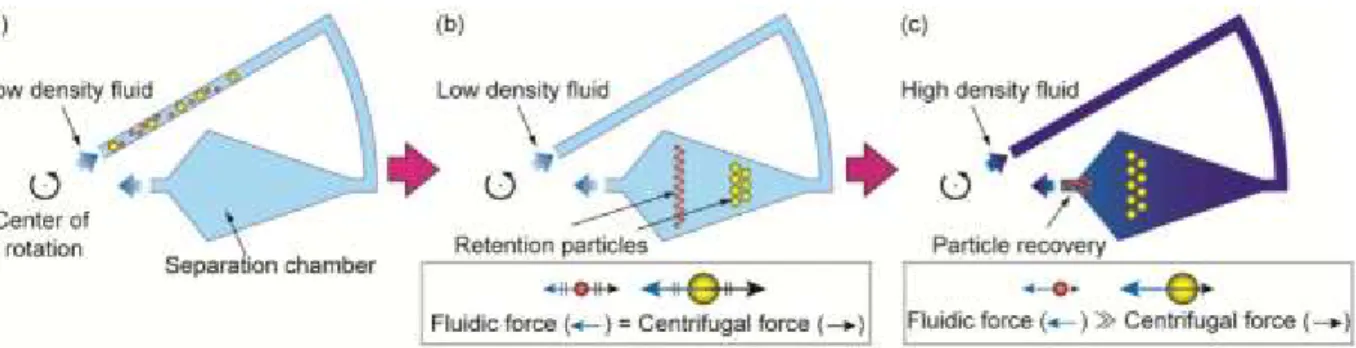
Figure 9: Cell size fractionation based on size using counterflow elutriation
Schematic representation of counterflow elutriation functioning. (a) Separation chamber coupled to the rotor in a centrifuge. Media (low density fluid) containing the cells are pumped to the separation chamber. (b) After the cells are loaded in the chamber bigger cells stay at the bottom of the chamber whereas smaller cells stays at the top, based on the opposition between fluidic force and centrifugal force. (c) In our experiment the density of the liquid was not changed. Instead, the fluidic force was gradually increased using a peristaltic pump chamber. Therefore, fluidic force pushed cells out of the chamber allowing the obtaining of different cell size fractions. Taken from Morijiri et al. (2010).
Fractions from different sizes were successfully generated (Figure 8 A and B). A slight difference can be observed between the two libraries when comparing the percentage of cells in the smaller fractions. This suggests that the rapamycin treatment drives the population to a smaller size as expected.
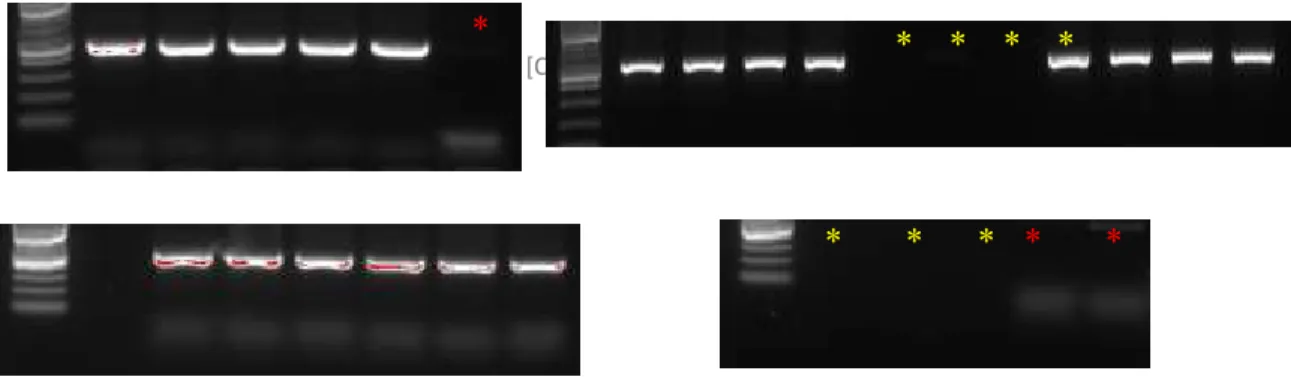
After obtaining cell fractions separated by size, the genomic DNA isolated from each one of the different fractions were used to recover the integrated sgRNA sequences (Figure 10). All the samples obtained yielded good amplification quality, and the respective negative controls were clean (red stars represent negative controls, starts in yellow represents not used lines).
32
Figure 10: Elutriation samples labeling PCR 1.
Expression of specific band obtained from the recovery of sgRNAs by PCR amplification. Each band corresponds to a different cell size fraction. Red stars correspond to negative controls and yellow starts are not used lines.
After the recovery of the sgRNAs it was necessary to reduce the genomic DNA ratio, reamplifying the sgRNAs, insert the barcodes responsible for identifying the sequences to each fraction and add P5/P7 sequences, sequences complementary to the primers immobilized in the NGS sequencing.
Figure 11: Elutriation samples labeling PCR 2.
Gels showing the amplification of specific bands for the reamplification of sgRNAs from different cell size fractions. Each band corresponds to a different cell size fraction, red stars corresponding to negative controls and yellow starts are not used lines.
After preparation samples were sent to sequencing and analyzed using the RANKS algorithm (Bertomeu et al., 2017). This statistical analysis allows the calculation of the level of depletion of
*
[Cite your source here.] * * * *
* * * * *
*
33
each sgRNA in pooled CRISPR/Cas9 library screen. The algorithm establishes a rank of genes that most likely are able to affect cell size upon its knockout. The barcode primers used to label the various cell sizes enables the quantification of gene enrichment in specific cell size fractions.
2.3. Analysis of the rapamycin size screen dataset
Elutriation screens in the presence of rapamycin were compared with a previous EKO library elutriation screen in the absence of rapamycin, which was performed by others in the Tyers laboratory. A noticeable difference was evident in the range of hit values between the untreated versus the short-term (Figure 12) and long-term (Figure 13) rapamycin treatments, and the combined screens (Figure 14). In the short-term versus non-rapamycin the scale ranges from -4 to 4 (i.e., depletion and enrichment respectively), while comparison with the long-term and the combined rapamycin score the hits range from scores of to -6 to 6.
Figure 12: Comparison between short-term rapamycin-treated versus untreated EKO library size screens.
RANKS analysis comparing the level of gene depletion in both short-term treatment versus not treated. The dot plot shows genes that upon its knockout, presents a different cell size phenotype.
34
This initial result indicates that the genetic drift is driven by a longer time after the rapamycin treatment might be leading to the depletion of any residual levels of essential gene products, therefore enriching the populations that carry knockouts that impact cell size, and potentially increasing screen sensitivity. Only the strongest hits from the screens will be discussed, i.e., those genes that upon knockout generated a pronounced difference in the phenotype in comparison with the non-rapamycin CRISPR screen.
Figure 13: Comparison between long-term rapamycin-treated versus untreated EKO library size screens.
Analysis comparing the level of gene depletion in both long-term treatment versus not treated. The dot plot shows genes that, upon its knockout, presents a different cell size phenotype.
35
Figure 14: Comparison between combined short-term and long-term rapamycin-treated versus untreated EKO library size screens.
Analysis comparing the level of gene depletion in both long-term and short-term treatment versus not treated. The dot plot shows genes that upon its knockout, presents a different cell size phenotype.
A complex network of hits that activate or suppress mTORC1 signaling is revealed by the screens. With respect to activators, the TSC complex, Rag GTPases, Rheb, and other factors involved in the activation of mTORC1 will be discussed.
In the results, the TSC1, TSC2, RRAGA and MAT2A knockouts, all generated a smaller phenotype in the rapamycin treatment in comparison with no treatment. The TSC proteins form a tumor suppressor complex that mediates the regulation of mTOR by growth factors and energy levels (Sancak et al., 2010; Lee et al., 2009; Kim & Kim, 2016). The TSC1 and TSC2 genes serve as validation of the screen strategy since these genes were expected to influence cell size in a mTOR-dependent manner. TSC1/2 function upstream mTOR, forming a heterodimer that negatively regulates mTOR activity (Lam, Siroky, & Henske, 2018; Wullschleger et al., 2006a), as orchestrated by energy and growth factors levels (Laplante & Sabatini, 2012). The knockout of both TSC1 and TSC2 produced a phenotype of smaller cells in the rapamycin treatment in comparison with the no rapamycin treatment. As an upstream inhibitor of mTOR, the loss of
36
those genes function would lead to uncontrolled activation of mTOR, leading to a bigger phenotype as found in the screen without rapamycin where TSC2 as the 2nd top and TSC1 was the 15th top hit to generate a large size phenotype (data not shown). The opposite phenotype obtained upon the loss of TSC1 and TSC2 in the presence of rapamycin, i.e., a much smaller size than in the untreated control screen illustrates chemical epistasis. That is, the drug masks the effect of gene loss by mimicking a genetic interaction where different molecules antagonize the TSC complex action as discussed by Bateson (1909), Lehner (2011) and many others.
RRAGA is the gene encoding the Ras-related GTP-binding protein A. RRAGA forms a complex that mediates the activation of mTOR by Rheb in the presence of amino acids depending on its activation by GATOR1, a GAP protein (GTPase activating protein) for RagA/B (Gu et al., 2017). Rag GTPases are the specific regulators of amino acid levels in the mTOR pathway (Kim et al., 2008). The Rag proteins RagA, RagB, RagC, and RagD form heterodimers that in the presence of GTP-bound RagB, interacts with TORC1 and activates it (Sancak et al., 2010). As previously shown, Rag proteins reside in the surface of lysosomes, where the ragulator complex (MAPKSP1, ROBLD3, and c11orf59), interacts with the Rag GTPases. This interaction is essential to mTOR lysosomal localization, and pathway activation showing that the Ragulator-Rag complex is essential to mTOR activation (Sancak et al., 2010). Therefore, the knockout of one of those proteins would disrupt mTOR’s activation system and expectedly give rise to a small phenotype.
Interestingly, RRAGA was the only RAG protein that had a strong differential effect on size since in the absence of rapamycin none of the RAG genes scored as a strong hit. Kim et al. (2008), found that in Drosophila melanogaster that within the dimers RagA and RagB is dominant in TORC1 regulation, which may help explain why RRAGA scored stronger than the other Rags. These authors proposed a model whereby Rag acts in a parallel in a pathway parallel to the TSC–Rheb axis in TORC1 activation. Therefore, in the absence of rapamycin cells might be generating a resistance mechanism by the inhibition of the TSC complex, and in the presence of rapamycin this bypass does not work because rapamycin works downstream the TSC complex. This may perhaps explain why in the presence of rapamycin RRAGA scored as a strong hit making the cells smaller.
37
In the context of upstream mTOR activation by amino acids, the RAG complexes are activated by the GATOR1 complex. In contrast to arginine and leucine, the amino acid methionine is sensed indirectly by a complex involving SAM and SAMTOR. In previous findings, loss of MAT2A (a methionine adenosyltransferase), prevents mTOR sensing of methionine by the blockage of its conversion to SAM, therefore inhibiting mTOR activation (Gu et al., 2017). The knockout of MAT2A scored as one of the top 15 genes that generated a small phenotype in my screens in the presence of rapamycin. In the screen without rapamycin MAT2A was not an important regulator of size as its loss caused only a slight decrease in size. Therefore, in the presence of rapamycin the methionine-dependent signal may be required to maintain a minimal level of mTOR activation and thereby affect cell size.
FKBP1A, also known as FKBP12, is a direct co-factor for rapamycin dependent inhibition of mTOR and as such is expected give rise to a strong size phenotype only in the presence of rapamycin. This prediction was fulfilled since the FKBP1A knockout causes a large cell size phenotype in the presence of rapamycin. FKBP12 is best characterized for its role as an interactor of rapamycin, and another inhibitor called FK506 (an important immunosuppressant used to reduce organ rejection) that inactivates calcineurin signaling (Hausch et al., 2013) (Choi et al., 1996). Consistent with this specificity, knockout of calcineurin did not modify cell size in either the rapamycin treated or untreated size screens. In summary, genes known to be required for either activation or inhibition of mTOR resulted in differential size phenotypes in the presence of rapamycin.
Many other KOs downstream mTOR scored within the top 15 genes that led to a large size phenotype and the top 15 that led to a small size phenotype. mTOR regulates a plethora of cell responses to environmental cues in part through its known effector substrates, S6Ks and 4EBPs (Wang & Proud, 2011). Even though those direct mTOR effectors were not recovered in the screens, some components of the EIF3 family scored as size regulators. Some of the EIF3 family components were found to function scaffolding the association between pre-initiation complexes, including mTOR and S6K1 (Peterson & Sabatini, 2005).