THÈSE
En vue de l’obtention du
DOCTORAT DE L’UNIVERSITÉ DE TOULOUSE
Délivré par l'Université Toulouse 3 - Paul Sabatier
Présentée et soutenue par
Isabel PEINKE
Le 28 juin 2019
Étude à micro-échelle du test de pénétration du cône dans la
neige
Ecole doctorale : SDU2E - Sciences de l'Univers, de l'Environnement et de
l'Espace
Spécialité : Océan, Atmosphère, Climat Unité de recherche :
CNRM - Centre National de Recherches Météorologiques
Thèse dirigée par
Pascal HAGENMULLER et Guillaume CHAMBON
Jury
M. Henning LöWE, Rapporteur M. Christophe MARTIN, Rapporteur
Mme Maurine MONTAGNAT RENTIER, Examinatrice M. Jean-Pierre CHABOUREAU, Examinateur M. Pascal HAGENMULLER, Directeur de thèse M. Guillaume CHAMBON, Co-directeur de thèse
Acknowledgements
The manuscript is written, the thesis is defended But one thing is needed for the work to be ended:Think of all the people and thank them to have given me the chance To do and finish my thesis here in France.
Le premier grand merci va a mes deux directeurs Pascal Hagenmuller et Guillaume Chambon : sans vous cette thèse n’aurait pas pu être possible, et cela ne pas uniquement d’un point administrative. Je vous remercie pour votre soutien, présence et patience pendant la thèse. Aussi merci à Samuel Morin d’avoir rendu cette thèse possible et de l’avoir mise sur de bons rails.
Je remercie également les membre du Jury de ma thèse, d’avoir accepté d’évaluer mon travail : Merci à Henning Löwe et Christophe Martin de l’avoir attentivement lu et rapporté ; merci à Maurine Montagnat Rentier et Jean-Pierre Chaboureau d’avoir accepté de l’examiner. Enfin, je souhaite remercier Frédéric Flin, Christian Geindreau et Laurent Arnaud, qui ont fait partie des comités de suivis, ils m’ont guidé et aidé à avancer ce travail. Une thèse comme la mienne avec une partie expérimentale nécessite une équipe pour assurer les expériences. Pour cela je voudrais remercier l’équipe Microstructure qui m’a soutenu pendant les expériences de tomographie. Merci à Jacques pour tout ton aide pour les expériences : sans toi je n’aurais pas pu faire autant d’expériences, mais au moins je n’aurais pas eu froid ;) Je remercie également le laboratoire 3SR de Grenoble pour les expériences tomographie. J’ai une attention particulière pour Edward pour ses conseils sur les expériences, le traitement des images et la collaboration lors de l’utilisation de la méthode de suivi de grains.
L’équipe informatique a également été d’un grand soutien, un grand merci au Groupe ITAO d’avoir assuré un support de qualité. Delphine et Jean-Louis, j’ai également apprécié votre aide pour m’aider dans le jungle de l’administration française ;) Dominique, je te remercie d’avoir filmé ma soutenance. Je souhaite ensuite remercier tous mes collègues, ces trois ans et demi je me suis toujours sentie bien accueilli. J’ai passé des bons moments, pendant un café le matin, le repas à midi ou au yoga. Gaëlle et Rafife, d’après nos collègues, nous étions inséparables, ils étaient toujours surpris si ils on vu qu’une de nous sans les autres. Nous avons en effet passé trois superbes années ensemble et vous allez me manquer. Ni le français, ni l’anglais sont mes langues natales, je remercie alors tous ceux qui on fait partie de ma magnifique team de relecture (Ajith, Anne, Emanuel, Florence, Lionel, Neige, Solène).
On n’y croit pas toujours mais à côté de la thèse on a aussi (parfois) une vie ;) Merci à tous mes amis de me soutenir et supporter dans cet aventure. Merci à tous mes amis de m’avoir soutenu et aidé dans cette aventure. Je souhaite autant remercier les amis géographiquement proches que ceux plus éloignés pour tous ce que nous avons vécu ensemble : des repas, des sorties en montagne ou ailleurs les week-ends, des vacances, des soirées de toutes sortes, aussi la vie en colocation ou des soirée pour se faire emporter très loin avec la salsa et les rythmes latins. Merci beaucoup à toi, Ajith, d’être venu au bon moment, pour ton soutiens, ta compréhension et justement pour tout.
Und nicht zu vergessen, meine Familie: Vielen Dank an Euch, dass Ihr immer für mich da ward, an mich geglaubt habt und mich unterstützt habt. Ich bin froh Euch zu haben und zu wissen, dass Ihr da seid, was auch immer ansteht.
ii
Abstract
Precise knowledge of the snowpack stratigraphy is crucial for different applications such as avalanche forecasting, predicting the water runoff, or estimating the Earth energy budget. The cone penetration test, which consists of recording the force required to make a cone penetrate the material of interest, is widely used to measure in situ snow profiles. The ramsonde developed in the 1930’s was continuously improved into highly-resolved digital snow penetrometers. In particular, the SnowMicroPenetrometer measures the snow penetration resistance at constant speed with a vertical resolution of four microns. The force fluctuations measured at such a resolution contain information about the snow microstructure, which is essential to complete the knowledge of the mean hardness of each snow layer. Nevertheless, the link between the measured hardness profile and the snow microstructure is not yet fully understood. Indeed, existing inversion models neglect obvious interactions between the cone tip and the snow, such as the formation of a compaction zone, and have only been evaluated through empirical relations to macroscopic properties. The goal of this thesis is to investigate the interaction between the cone and the snow at a microscopic scale using X-ray tomography in order to better invert the hardness profiles into microstructural properties. In this work, we analyze cone penetration tests of a few centimeters and thus the measured profiles contain a non negligible transient part due to the progressive formation of a compaction zone. In order to explicitly account for this process in the inversion model, we successfully developed a non-homogeneous Poisson shot noise model which considers a depth dependency of the rupture occurrence rate. We used this model to characterize snow sintering with cone penetration tests under controlled cold-lab conditions. According to the model, the vertical heterogeneity of hardness profiles was due to variations of the rupture occurrence rate, while the time evolution of the macroscopic force was controlled by bond strengthening. This partition is consistent with the expected sintering processes and provides an indirect validation of the proposed model. The second part of the thesis consists of cold-lab experiments combining cone penetration tests and X-ray tomography. High resolution three dimensional images of the snow sample before and after the cone test were measured. On these images, a novel tracking algorithm was applied to determine granular displacements induced by the test. We precisely quantified the size of the compaction zone and its relation to the snow characteristics. Furthermore, we showed that the observed vertical displacements challenge the use of standard cavity expansion models as inversion models. Finally, we linked the microstructural properties obtained from tomography, such as the bond size or the number of failed bonds, to properties derived from hardness profiles. We showed that the properties estimated from cone penetration tests are proxies of the snow microstructure, but remain too conceptual to expect a straightforward relation. In the future, these studies should make it possible to derive in an objective way the stratigraphy of the snowpack from a simple and fast field measurement.
Keywords: snow, microstructure, mechanical properties, cone penetration tests,
Résumé
La prévision du risque d’avalanche, les prévisions hydrologiques et l’estimation du bilan énergétique de la Terre dépendent d’une connaissance précise de la stratigraphie du manteau neigeux. Le test de pénétration du cône, qui consiste à enregistrer la force nécessaire pour faire pénétrer un cône dans le matériau d’intérêt, est largement utilisé pour mesurer des profils de neige. La sonde de battage, développée et utilisée depuis 1930, a été continuellement améliorée. Aujourd’hui, des pénétromètres numériques, tel que le SnowMicroPenetrometer, permettent de mesurer la résistance à la pénétration à vitesse constante avec une résolution verticale de quelques microns. Les fluctuations de force mesurées à cette résolution contiennent des informations sur la microstructure essentielles pour compléter la connaissance de la dureté moyenne de chaque couche de neige. Néanmoins, le lien entre le profil de dureté et la microstructure de la neige n’est pas encore entièrement compris. En effet, les modèles d’inversion existants négligent certaines des interactions entre la pointe du cône et la neige, comme la formation d’une zone de compaction, et ils n’ont été évalués que par des relations empiriques avec des propriétés macroscopiques. L’objectif de cette thèse est d’étudier l’interaction entre le cône et la neige à une échelle microscopique, à l’aide de la tomographie à rayons X, afin d’extraire, de manière plus précise, les propriétés microstructurelles de la neige à partir des mesures de résistance à la pénétration. Dans ce travail, nous analysons des tests de pénétration du cône de quelques centimètres de profondeur, qui contiennent une partie transitoire non négligeable due à la formation progressive d’une zone de compaction. Afin de prendre en compte explicitement ce processus, nous avons développé un modèle statistitique non-homogène de Poisson, qui prend en compte une dépendance à la profondeur du taux d’occurrence de rupture entre grains de neige. Nous avons utilisé ce modèle pour caractériser le frittage de la neige par des tests de pénétration du cône sous conditions contrôlées dans une chambre froide. D’après le modèle, l’hétérogénéité verticale des profils de dureté était due aux variations du taux d’occurrence de rupture, tandis que l’évolution temporelle de la force macroscopique était contrôlée par un renforcement des ponts. Cette partition est cohérente avec les processus de frittage connus et fournit une validation indirecte du modèle proposé. Une deuxième partie de la thèse a porté sur des expériences en chambre froide combinant des tests de pénétration du cône et de l’imagerie par tomographie X. Des images tri-dimensionnelles à haute résolution d’un échantillon de neige ont été prises avant et après le test du cône. Sur ces images, un nouvel algorithme de suivi de grains a été appliqué pour déterminer les déplacements granulaires induits par le test. Nous avons quantifié avec précision la taille de la zone de compaction et sa relation avec les caractéristiques de la neige. Nous avons montré que les déplacements verticaux observés compliquent l’utilisation de modèles d’expansion de cavité comme modèles d’inversion. Enfin, nous avons lié les propriétés microstructurelles obtenues par tomographie, telles que la taille ou le nombre de ruptures de ponts, à des propriétés dérivées des profils de dureté. Nous avons montré que les propriétés estimées à partir des tests de pénétration du cône sont des approximations de la microstructure de la neige, mais restent trop conceptuelles pour espérer une relation directe. A l’avenir, ces études devraient permettre de dériver, de manière objective, la stratigraphie du manteau neigeux à partir d’une mesure de terrain simple et rapide.
Mots clés: neige, microstructure, propriétés mécaniques, test de pénétration du
Introduction en français 1
1 Introduction 9
1.1 General introduction: From a snowflake to an avalanche . . . 10
1.1.1 Different types of snow . . . 11
1.1.2 The snowpack and its stability . . . 13
1.1.3 Characterization methods for snowpacks . . . 16
1.2 State of the art: Snow measurements and their applications . . . 18
1.2.1 Penetration tests in snow . . . 19
1.2.2 Link between cone penetration tests and snow microstructure 23 1.2.3 Imaging of snow microstructure . . . 26
1.3 Scope and structure of the thesis . . . 27
1.3.1 Goals of the thesis . . . 27
1.3.2 Structure of the thesis . . . 29
2 Sensitivity Analysis 33 2.1 Introduction . . . 34
2.2 Experimental procedure and penetration signal analysis . . . 34
2.2.1 Sample preparation . . . 34
2.2.2 Cone penetration test . . . 36
2.2.3 Force profile analysis . . . 38
2.3 Sensitivity to sample preparation . . . 39
2.3.1 Spatial variability in one sample . . . 39
2.3.2 Sintering after sieving . . . 41
2.4 Sensitivity to cone tip characteristics . . . 42
2.4.1 Tip geometry . . . 42
2.4.2 Sensitivity to tip diameter . . . 44
2.5 Sensitivity to spacing between measurements and sample holder size 46 2.5.1 Boundary and spacing effects . . . 46
2.5.2 Sample diameter . . . 48
2.6 Discussion and Conclusions . . . 50
vi Contents
3 Investigation of snow sintering at microstructural scale from
micro-penetration tests 53
3.1 Introduction . . . 54
3.2 Material and Methods . . . 57
3.2.1 Snow samples . . . 57
3.2.2 Micro-penetration tests in sintering snow . . . 58
3.2.3 Micromechanical analysis methods . . . 60
3.3 Results . . . 63
3.3.1 Evaluation of the µCPT analysis method . . . 63
3.3.2 Evolution of the macroscopic force with time . . . 66
3.3.3 Evolution of the micromechanical properties with time . . . 68
3.4 Discussion . . . 69
3.5 Conclusions . . . 73
3.A Appendix . . . 74
3.A.1 Evaluation of modified SMP . . . 74
3.A.2 Mathematical developments . . . 75
3.A.3 Time evolution of the macroscopic and microscopic property profiles . . . 76
4 Microstructural analyses of penetration tests for different appli-cations 79 4.1 Field measurements . . . 80
4.1.1 Experiments and analysis . . . 80
4.1.2 Stratigraphy of the snowpack . . . 82
4.1.3 Horizontal SMP measurements of selected snow layers . . . . 86
4.1.4 Comparison of vertical and horizontal profiles . . . 87
4.1.5 Conclusion . . . 90
4.2 Snow metamorphism . . . 91
4.2.1 Experiments and analysis . . . 91
4.2.2 Time evolution of density and SSA . . . 93
4.2.3 Evolution of the penetration force . . . 93
4.2.4 Microstructural analysis (NHPP) . . . 94
4.2.5 Discussion and conclusion . . . 96
4.3 Application to sensitivity analysis . . . 98
4.3.1 Experiments . . . 98
4.3.2 Results and discussion . . . 98
4.3.3 Conclusions . . . 100
4.A Appendix . . . 101
5 Experimental study of cone penetration in snow using X-ray to-mography 103 5.1 Introduction . . . 104 5.2 Methods . . . 107 5.2.1 Experiments . . . 107 5.2.2 Displacement Analysis . . . 109
5.2.3 Theoretical Displacement Field Analysis . . . 112
5.3 Results . . . 116
5.3.1 Tracking of snow grains . . . 117
5.3.2 Analysis of the deformation around the cone . . . 120
5.3.3 Comparison between measurements and models . . . 122
5.4 Discussion . . . 125
5.4.1 High-resolution three-dimensional measurements of snow de-formation . . . 125
5.4.2 Analysis of CPT deformation in snow . . . 127
5.4.3 Applicability of CPT interpretation models . . . 128
5.5 Conclusion . . . 129
5.A Appendix . . . 130
6 Evaluation of snow structural proxies derived from cone penetra-tion tests with X-ray tomography 133 6.1 Introduction . . . 134
6.2 Experiments . . . 135
6.3 Methods . . . 136
6.3.1 Micromechanical analysis of the penetration force . . . 137
6.3.2 Grain tracking . . . 138
6.3.3 Minimum cut density . . . 139
6.3.4 Correlation analysis . . . 142
6.4 Results . . . 142
6.4.1 Evaluation of micromechanical properties obtained from the force profiles . . . 142
6.4.2 Correlations between microstructural estimates and macro-scopic properties . . . 143
6.5 Discussion and conclusion . . . 148
7 Conclusion and perspectives 151 7.1 Conclusion . . . 152
7.2 Perspectives . . . 156
Conclusion et Perspectives en Français 159
Environ 25% de la surface de la Terre est recouverte de neige, certaines régions ont un enneigement saisonnier et d’autres sont recouvertes toute l’année. L’enneigement a un impact sur la vie des habitants de ces régions. Par exemple, les Eskimos ont adapté leur vie et leur langue à la neige et ils ont pléthore de noms pour nommer les différents états de la neige [e.g. Boas, 1911, Martin, 1986]. En recherche, il existe également une classification de la neige [Fierz et al., 2009].
La neige se forme dans les nuages, là où se passe la nucléation. Ce processus peut être divisé en une nucléation homogène de gouttes d’eau surfondues [e.g. Pruppacher, 1995] et une hétérogène impliquant des particules de nucléation, comme des particules de poussière [e.g. Libbrecht, 2005]. Le cristal initial qui en résulte croîtra rapidement, en accumulant la vapeur d’eau de l’air ambiant au dépend des goutelettes d’eau surfondue avoisinantes (effet Bergeron-Findeisen, Bergeron [1935]), des cristaux plus petits et éventuellement par impact et gel à sa surface des goutelettes surfondues. Cette formation est influencée par les conditions atmosphériques. Chaque cristal lui-même est unique, et sa forme géométrique est due à la forme moléculaire de la glace dans les conditions atmosphériques terrestres (forme hexagonale).
Une fois que le cristal de glace est suffisamment grand, la gravité agit sur lui et il tombe. Pendant sa chute en dehors du nuage, il peut passer dans plusieurs masses d’air différentes. Ces masses d’air doivent être suffisamment froides pour que les cristaux ne fondent pas avant leur arrivée au sol.
Pendant le dépôt, la structure des cristaux sera également influencé par les conditions atmosphériques. En absence de vent et par des températures basses, les cristaux de neige fraîche garderont leur intégrité et leur forme géométrique régulière. En présence de vent, ces formes fragiles peuvent se briser. Dans des conditions plus chaudes, lorsque la température est légèrement positive, les cristaux peuvent être partiellement fondus et contenir de l’eau liquide. Le dépôt des cristaux de neige sur le sol va progressivement créer une couche de neige. Cette couche de neige va ensuite évoluer avec le temps et peut être recouverte par d’autres chutes de neige. Différentes métamorphoses agissent sur la neige : thermodynamique (transfert de vapeur d’eau et d’eau liquide) et mécanique.
2 Contents
La neige est un matériau poreux car elle contient de l’air et cette porosité élevée permet à la vapeur d’eau de diffuser dans sa matrice. Ce processus est très actif, car la température de la neige est proche du point de fusion. Sublimation de la glace, transport et dépôt de vapeur d’eau ont lieu. Ils dépendent essentiellement des différences de température dans le manteau neigeux (ce qu’on appelle le gradient de température) mais également des différences de géométrie (rayon de courbure). Selon l’intensité du gradient de température, le type de métamorphose est différent [e.g. Yosida et al., 1955, Colbeck, 1982]. En présence d’un faible gradient de température, les effets de courbures priment : les grains ont tendance à s’arrondir, grossir et les liaisons entre eux se renforcent avec le temps ; ce processus s’appelle le frittage et s’accompagne d’un gain de cohésion de la couche de neige ; les grains formés sont appelés grains fins. Un fort gradient de température favorise les flux de vapeur d’eau de la partie de la couche ayant les températures les plus élevées vers les plus basses. Il en résulte également une modification de la microstructure (grossissement des grains, apparition d’angles sur les zones de condensation) et une diminution de la cohésion ; les grains formés sont des faces planes ou des gobelets pour les très fortes valeurs de gradients [e.g. Schneebeli and Sokratov, 2004, Calonne et al., 2014].
La présence d’eau liquide arrondit les grains en augmentant leur taille ; on parle alors de grains ronds. La cohésion dépend alors de la teneur en eau liquide de la couche de neige. Une présence modérée d’eau crée des forces capillaires dans le manteau neigeux. Lorsque la teneur en eau est élevée, la cohésion de la neige diminue car l’eau liquide joue alors un rôle de lubrifiant. Si l’eau liquide regèle, ces grains ont alors une forte cohésion dite cohésion de regel.
La neige est très sensible aux contraintes mécaniques externes, comme les charges mécaniques, pour deux raisons principales : 1) le fluage de la neige peut se produire à cause des températures homologues élevées et de la nature cristalline de la glace et 2) la fragilité du matériau neige en raison de sa porosité élevée. Le vent peut agir comme une contrainte mécanique sur la neige et forme une couche cohésive. Le tassement des couches est dû à un réarrangement des grains et de la charge de la neige des couches supérieures [e.g. Chandel et al., 2007].
Un enneigement saisonnier typique consiste en différentes couches de neige ayant des propriétés différentes. Par exemple, elles diffèrent par leur densité, leur surface spécifique (SSA), la forme et la taille de leurs grains. Ces différentes propriétés géométriques et microstructurales définiront les propriétés mécaniques à l’échelle des ponts entre les grains mais aussi à l’échelle du manteau neigeux. Un exemple de ce comportement mécanique est la cohésion entre les grains. En effet, une couche qui montre une faible cohésion, une couche fragile, est l’un des principaux facteurs lors
d’avalanches provoquées par les skieurs. Si ces couches fragiles sont recouvertes d’une couche compactée, avec une cohésion de frittage, un manteau à l’empilement instable se met alors en place. Lorsqu’un skieur ou un randonneur passe, la contrainte due à son poids peut atteindre la couche fragile, celle-ci s’effondre ; si l’effondrement se propage, la plaque se met alors en tension et peut finir par se rompre ; elle glisse alors vers le bas. C’est ce que l’on appelle une avalanche de plaques. D’autres avalanches peuvent se produire, comme les avalanches ponctuelles de neige fraîche ou les avalanches de neige humide. Dans les Alpes françaises, chaque année, environ 30 décès sont dus aux avalanches (source ANENA) dont la majorité sont des avalanches de plaques. Une bonne connaissance de la structure interne du manteau neigeux est primordiale, et la liaison entre les grains et leur forme à l’échelle microscopique conditionnent leur comportement macroscopique. Ainsi, dans la prochaine section, nous décrirons les mesures existantes pour décrire la stratigraphie du manteau neigeux ainsi que les modèles qui leur sont associés.
Une méthode facile et objective pour avoir une information sur la stratigraphie du manteau neigeux sont les tests de pénétration du cône (Cone Penetration Test, CPT en anglais). Une première application à la neige en a été faite dans les années 1930 avec la sonde de battage [Bader et al., 1939]. Depuis, les CPT ont été constamment améliorés, notamment par le développement de pénétromètres numériques. Bradley [1966] a développé le résistographe, qui mesure la résistance en profondeur et l’enregistre sur un papier. Plus tard, Dowd and Brown [1986] ont obtenu les premiers profils numériques à notre connaissance, en enregistrant la force de pénétration avec une résolution de 5 mm. Schneebeli and Johnson [1998] ont développé le SnowMicroPenetrometer (SMP), qui est largement utilisé aujourd’hui par la communauté de recherche sur la neige, et qui est au coeur de cette thèse. Le SMP mesure la force de pénétration à une résolution horizontale de 4 µm. En raison de sa haute résolution, on suppose que le signal est capable d’estimer les propriétés micromécaniques de la neige [Johnson and Schneebeli, 1999, p. ex.]. D’autres pénétromètres numériques existent comme le pénétromètre SABRE Mackenzie and Payten [2002] ou SP1 et SP2 [Avatech, 2014]. Il s’agit de pénétromètres qui sont poussés manuellement dans la neige. Ce type de pénétromètre a une résolution moins fine mais est néanmoins prometteur, car il comble le fossé entre les pénétromètres dédiés à la recherche comme le SMP et les instruments très simples et robuste pour une utilisation en réseau, comme la sonde de battage.
[Schweizer and Wiesinger, 2001] mentionnent que le profil de la sonde de battage classique est utile pour différencier les manteaux neigeux potentiellement stables ou instables. Cependant, Pielmeier and Schneebeli [2003] ont montré que les couches
4 Contents
minces et fragiles ne sont pas capturées par la sonde de battage en raison de sa dureté grossière et sa faible résolution verticale. Schneebeli et al. [1999] ont souligné la haute précision avec laquelle ils ont mesuré les interfaces entre les couches de neige faible et dure. Ces résultats ont été confirmés par Kronholm et al. [2004], qui ont analysé la variabilité spatiale de la résistance du SMP par rapport à un puits à neige (sonde de battage, test rutschblock et mesures manuelles). Ils en ont conclu qu’il est possible d’identifier des couches distinctes en fonction des variations de la résistance à la pénétration.
D’autres études ont tenté de détecter et de classer les différents types de neige à partir des profils de force du SMP. Différentes études ont tenté de détecter les couches fragiles en analysant statistiquement le signal de force Pielmeier and Schweizer [2007], Lutz et al. [2007] and Herwijnen et al. [2009] ou d’indiquer la stabilité du manteau neigeux. Satyawali et al. [2009] ont développé une approche préliminaire d’une classification de neige, indépendante des observateurs, en 5 principales classes de neige. De plus, Satyawali and Schneebeli [2010] ont utilisé un semivariogramme pour l’interprétation des profils SMP et ont montré qu’il est possible d’estimer les échelles spatiales des différentes classes de neige. Des analyses similaires ont également été effectuées avec le pénétromètre SABRE ; par exemple Floyer and Jamieson [2008] et Floyer and Jamieson [2009] ont présenté une méthode pour suivre les couches fragiles dans les signaux du pénétromètre. Récemment d’ailleurs, McCallum [2014] a présenté des expériences sur l’application du CPT qui est utilisé dans les sols classiques aux sols enneigés de l’Arctique. McCallum and Wiegand [2018] ont développé un modèle simple pour estimer la résistance de la neige à partir des données de frottement du manchon de friction du CPT. Pour valider ce modèle, des données supplémentaires sont nécessaires.
Il existe plusieurs modèles statistiques pour estimer les propriétés micromé-caniques à partir des profils du SMP [e.g. Johnson and Schneebeli, 1999, Marshall and Johnson, 2009, Löwe and Herwijnen, 2012]. Ils supposent tous que le profil de force macroscopique mesuré F (z) est une superposition de ruptures individuelles des liaisons reliant les grains de neige. Tous ces modèles interprètent un profil SMP F (z), c’est-à-dire la force de pénétration macroscopique F en fonction de la profondeur z, comme la superposition d’événements de rupture spatialement non corrélés mais identiques. Chaque événement est supposé correspondre à la rupture d’une liaison ayant un comportement de rupture élastique-fragile. Ces modèles d’inversion estiment les propriétés suivantes : flexion à la rupture δ, force de rupture de liaison f et dimension de l’élément microstructurel L. Löwe and Herwijnen [2012] à proposé un modèle statistique qui suppose ces ruptures sont aléatoirement
distribué dans l’espace. Cette distribution peut être décrit pas un processus de Poisson homogène (HPP, homogeneous Poisson process en anglais). Les résultats des estimations micromécaniques de l’HPP sont utilisés dans d’autres études pour trouver les propriétés macroscopiques de la neige. Proksch et al. [2015] ont utilisé la force de pénétration médiane ( ˜F) et la dimension de l’élément microstructurel
(L = (Ac/λ)1/3, avec la surface de la pointe du penetromètre Ac), pour estimer des
valeurs de masse volumique et de SSA. Ces formules et la formulation du module d’ Young macroscopique de [Johnson and Schneebeli, 1999] sont souvent utilisées pour analyser les profils du SMP ; par exemple, les études de l’instabilité des pentes et de la propagation des fissures sont réalisées avec ces estimations [e.g. Reuter et al., 2015, Schweizer et al., 2016, Reuter et al., 2019].
Des études expérimentales ont montré qu’une zone de déformation non néglige-able se forme autour de la pointe du cône en pénétrant dans la neige [LeBaron et al., 2014, Herwijnen and Miller, 2013]. Ces deux études ont modélisé la déformation autour de la pointe SMP en utilisant la vélocimétrie par image de particules (Particle Image Velocimetry, PIV en anglais). [Herwijnen, 2013] a également utilisé des images tomographiques des échantillons après le test SMP afin d’analyser la dépendance radiale de CZ à la densité de la neige. Bishop et al. [1945] a inntroduit le le « cavity expansion model » (CEM), qui retire les propriétés matérielles de l’argile et du sable à partir du CPT. Le modèle suppose que le matérielle d’intéret est un matériau continu et que les forces sont uniquement radiales. Le CEM est un modèle qui prend en compte la déformation autour du cône, alors que le HPP n’en tient pas compte. Néanmoins, l’hypothèse d’un matériau continuum est forte, car le rapport cône/grain de neige typique pour le SMP est proche de sa limite.
Une façon facile d’observer les grains de neige est d’utiliser une loupe. Certaines sont suffisamment légères et peu emcombrantes pour pouvoir être transportées sur le terrain afin d’identifier la taille et la forme des grains et les classer après Fierz et al. [2009]. Ces mesures dépendent toutefois de l’observateur. Deux observateurs donneront probablement une granulométrie différente, et même un type différent (par exemple, s’il s’agit d’une couche avec des grains fins se métamorphosant en grains à faces planes, un observateur identifiera les grains fins comme grains de neige majeurs et l’autre les cristaux facettés). À cause de cette subjectivité, malgré la valeur informative de ces informations, il est nécessaire de développer d’autres métriques de la microstructure.
Une première application de la tomographie microscopique par rayons X (µCT) sur des échantillons de neige a été faite par Brzoska et al. [1999]. Cette méthode permet d’obtenir la microstructure tridimensionnelle d’un échantillon de neige à une
6 Contents
résolution de quelques micromètres. Habituellement, un échantillon de neige d’une telle résolution a une taille de quelques cm3. Cette méthode est non destructive
et peut donc suivre le métamorphisme de la neige in-situ [e.g. Schneebeli and Sokratov, 2004, Calonne et al., 2015]. Wang and Baker [2013] ont utilisé la µCT et des images de microscopie électronique à balayage pour observer les changements microstructurels de la neige sous compression uniaxiale. Une autre application de la µCT est la documentation de neiges naturelles recueillies sur le terrain. Comme le transport peut être critique et même détruire la structure fragile de la neige, il existe des méthodes d’imprégnation [e.g. Coleou et al., 2001, Heggli et al., 2009]. Ces méthodes sont néanmoins destructrices, car il est difficile d’éliminer complètement le matériau d’imprégnation.
Pour résumer, les tests de pénétration du cône dans la neige, dont le SMP, sont largement étudiés et des approches statistiques existent pour estimer les propriétés micromécaniques de la neige. Néanmoins, ces modèles d’inversion négligent les processus physiques autour de la pointe lors de la pénétration, comme la formation d’une zone de compaction. Pour une interprétation correcte du signal, il est crucial de savoir ce qui se déroule autour de la pointe. La µCT est un outil prometteur pour obtenir des informations sur la microstructure de la neige [e.g. Hagenmuller, 2014]. En outre, des études du champ de déformation pour des tests de pénétration du cône existent déjà pour les sols, combinant la tomographie par rayons X et la corrélation des images numériques [e.g. Paniagua et al., 2013, Silva et al., 2015].
Le but de cette thèse est de mieux comprendre les processus qui se produisent directement autour de la pointe pendant le test de pénétration à une échelle microscopique et de les inclure dans les modèles existants. C’est ainsi que nous avons centré le travail sur les questions suivantes :
Peut-on améliorer les modèles d’inversion existants afin de prendre en compte une zone de compaction ? Des études expérimentales de test de pénétration du
cône dans la neige ont montré qu’une zone de compaction se forme devant et à côté de la pointe du cône pendant le processus de pénétration. Cette déformation n’est pas prise en compte dans les modèles d’inversion actuels. Ces modèles estiment les propriétés micromécaniques suivantes : force de rupture, déflexion à la rupture et taux d’occurrence de ruptures. Afin de mieux interpréter ces propriétés, il conviendrait de prendre en compte la zone de compaction.
Le SMP est-il capable de suivre l’évolution de la microstructure de la neige avec le temps ? Depuis l’élaboration du SMP, il a été largement étudié. Certaines études
sujettes aux avalanches) ou même sur la classification du signal dans les principaux types de neige. Ce type d’études était basé sur l’analyse des signaux. De plus, des analyses statistiques ont été effectuées pour estimer les propriétés micromécaniques des grains de neige et de leurs liaisons. Par conséquent, le signal était censé être une superposition de ruptures élastiques-fragiles des grains de neige. A notre connais-sance, il n’y a qu’une seule étude qui a essayé de suivre le métamorphisme de la neige avec le SMP. Là, le frittage a été étudié par l’évolution de la force macroscopique. Il serait donc intéressant de savoir si les estimations micromécaniques permettent de suivre l’évolution de la microstructure de la neige pour le processus de frittage, mais aussi pour le métamorphisme de gradient de la neige en conditions contrôlées.
Que se passe-t-il exactement autour de la pointe pendant le processus de pénétra-tion ? Pour une interprétation correcte du signal, il est crucial de savoir exactement
ce qui se passe autour de la pointe du cône pendant la pénétration. Jusqu’à présent, les études ont porté sur la description de la zone de compaction (PIV ou changement de densité), notamment concernant sa taille et sa forme ainsi que le déplacement des grains qui se produisent autour de la pointe. Néanmoins, il manque une information exacte sur ce qui se passe à l’échelle microscopique. Il serait intéressant de voir, par exemple, quelles sont les liaisons qui se brisent.
Comment la déformation de la neige à côté de la pointe conique est-elle liée au profil de force mesuré ? Cette question est liée à la question précédente. Si nous
savons ce qui se passe exactement autour de la pointe, il sera possible d’établir un lien avec le profil de force. L’analyse micromécanique du signal de force passe par la connaissance exacte des contraintes autour de la pointe. Le signal est lié à une intensité de rupture ou à une force de rupture? Et est-ce vraiment ce que nous mesurons ?
1
Introduction
Contents
1.1 General introduction: From a snowflake to an avalanche 10
1.1.1 Different types of snow . . . 11
1.1.2 The snowpack and its stability . . . 13
1.1.3 Characterization methods for snowpacks . . . 16
1.2 State of the art: Snow measurements and their appli-cations . . . . 18
1.2.1 Penetration tests in snow . . . 19
1.2.2 Link between cone penetration tests and snow microstruc-ture . . . 23
1.2.3 Imaging of snow microstructure . . . 26
1.3 Scope and structure of the thesis . . . . 27
1.3.1 Goals of the thesis . . . 27
1.3.2 Structure of the thesis . . . 29
10 1.1. General introduction: From a snowflake to an avalanche
1.1
General introduction: From a snowflake to
an avalanche
About 25% of the Earth’s surface is covered by snow, some regions have a seasonal snowpack and some are covered the whole year. The snow cover impact the life of the people in these regions. Parts of Alaska are covered with snow the whole year and the people living there, the Inuits, have adapted their life to it. They use snow to build their houses, as a water source, and also for locomotion. For example, they use sledges to move and not wheels. Even their language adapted to this situation as linguistic studies showed [e.g. Boas, 1911, Martin, 1986]. The Inuits have three different basic word roots for snow: one for falling snow, another one for fallen snow and and the third one for snow on the ground [e.g. Boas, 1911, pp.25-26]. Based on these word roots they will further distinguish different snow types. Different words for snow on the ground Inuit are for example fresh snow, soft snow, melting snow or even a word for lower layer of sugar snow used for drinking water [Kaplan, 2003]. Life surrounded by snow also involves danger, like avalanches. Also here Inuits have a word to describe snow which is prone to avalanches. These examples show that living in snow makes the Inuits true snow observers, or even specialists of snow. Their distinction between different snow types can be set in comparison with the scientific classification of different snow grains. Fierz et al. [2009] proposed an international classification of snow, with 9 main morphological grain shape classes, which are themselves divided into sub-classes (37 in total). In general, a good knowledge of a snowpack is important for avalanche forecast, the prediction of the water runoff and estimating the Earth energy budget. More than one sixth of the world’s population depends on waters resources from glaciers or seasonal snowpacks [Barnett et al., 2005]. The seasonal snowpack is a water storage, and with the knowledge of its mean density and height the snow water equivalent can be estimated. The snow, with its high albedo plays an important role on the Earth’s energy budget. A high albedo means, that the main part of the incoming sun radiation is reflected, which leads to a global cooling of the atmosphere. The overall snow coverage is important for energy estimation, which can for example be measured by satellites. The next sections sum up scientifically how a snowpack is formed, beginning with the formation of the snowflakes in the cloud, going on with their deposit on the ground and ending with the formation of a snowpack, which might be avalanche prone or not.
1.1.1
Different types of snow
The origin of the snow is in the cloud, where ice nucleation takes place. This process can be divided into a homogeneous nucleation of super-cooled water drops [e.g. Pruppacher, 1995] and a heterogeneous one involving nucleation particles, like dust particles [e.g. Libbrecht, 2005]. The resulting frozen droplet will grow quickly, by accumulating further water vapour from the ambient air (Bergeron Findeisen effect, valid for a temperature range of [-5,-13°C], Bergeron [1935]) until a snow crystal is formed. This formation is influenced by the atmospheric conditions, in particular, temperature and humidity and it results in different forms, like dendrites, plates or columns (Fig. 1.1). The temperature mainly influences the growth of the snow crystals as to whether they will grow into plates or columns, while the more complex structures occur for higher supersaturations [e.g. Libbrecht, 2005]. Each crystal itself is unique, but will have a hexagonal shape, which is due to the molecular shape of a water molecule. This was already pointed out by Johannes Kepler in 1611, with the apparently first scientific description of the snow crystal symmetry [Kepler, 1966, English translation].
Figure 1.1: Snow crystal morphology diagram from Libbrecht [2005] showing different
types of snow crystals as function of the atmospheric conditions, namely the temperature and the water vapour supersaturation.
Once the snow flake grows enough the gravity acts on it and the crystal falls down and deposits. While the snow flake is falling outside the cloud, it may pass through several different air-masses. These air-masses have to be cold enough that the snowflakes will not melt before their arrival at the ground. During the deposit,
12 1.1. General introduction: From a snowflake to an avalanche
the snowflake structure will be governed by the atmospheric conditions: On nearly windless and cold conditions the snowflakes will keep their regular geometrical shape. In the presence of wind, these fragile shapes can break and the snow which is deposited is already fragmented. With warmer temperatures slightly above 0°C the snow flakes will already have a nonzero liquid water content.
The accumulation of the snowflakes on the ground will progressively create a snow layer. This snow layer will now evolve with time and may get covered further as a result of future snow events. For example, the snow grains which touch create bonds and these bonds will grow with time. This process of bond formation and growth is called sintering. In addition to this, different snow metamorphism may occur, which can be explained by these three major processes: 1) water vapour transport, 2) melting, 3) mechanical loading.
Water vapour transport: A snow layer contains mainly ice and air, where the
proportion of air can be up to 90%. Thus, snow is a porous material and this high porosity is important for further evolution of the snow layer, as it enables water vapour to diffuse into it. This process is very active, as snow exists at high homologous temperatures, i.e. the temperature is close to the melting point. This allows for processes like ice sublimation, water vapour transport and deposition to take place. They are dependent on the temperature differences within the snowpack, the so called temperature gradient (∇T ). Following its strength the type of metamorphism is divided into an equilibrium and a kinetic form [e.g. Yosida et al., 1955, Colbeck, 1982]. If a small temperature gradient is present, i.e. ∇T ≤ 5 K m−1
it is the equilibrium type and the grains tend to get rounded and the bond between them are thickening with time. During this process water vapour is transported from the convex to the concave forms [e.g. Flin et al., 2004, Kaempfer and Schneebeli, 2007]. The resulting grain form is called rounded grain. The kinetic metamorphism involves higher temperature gradients (∇T > 5 K m−1), which occur normally
close to surface. This high gradient favors water vapour fluxes from the higher temperatures to the lower ones. This leads to a change in the microstructure and the formed grains are plane facets and sharp edges [e.g. Schneebeli and Sokratov, 2004, Calonne et al., 2014]. For snow under very strong gradients (∇T > 20 K m−1)
for longer times (one to several weeks) depth hoar will be formed. The equilibrium metamorphism tends to stabilize the snowpack, while the kinetic one decreases the cohesion between the grains and thus decreases the stability of the snowpack.
Melting: A warm atmospheric temperature can lead to the melting of the
snowpack. At this moment the snowpack contains ice and liquid water, and has a temperature of 0◦C. The melting and refreezing cycles tend to round the grains
and their size increases and melt forms appear. Their cohesion is dependent on the liquid water content in the snowpack. The melt forms have strong cohesion if now liquid water is present. A moderate presence of water creates capillary forces in the snowpack. However, when the water content is very high, the snow cohesion will decrease as the liquid water plays the role of a lubricant.
Mechanical loading: Snow is very sensitive to external mechanical stress, like
mechanical loading for two main reasons: 1) creep deformation may occur due to high homologous temperatures and the viscoplasticity behaviour of snow, and 2) snow is fragile material due to its high porosity. Wind can act as mechanical stress on the snow. As explained earlier it can break the falling snowflakes into smaller grains, but wind can loosen and transport the snow grains (snow-drift), which could result in a change in their shape. This type of grains sinters fast and thus forms a cohesive layer. Otherwise, packing of the layers is due to a rearrangement of the grains and the weight of the overburden snow [e.g. Chandel et al., 2007].
To sum up, snow is a complex material which is formed in the clouds and once deposited on the ground changes continuously. These changes are influenced by processes like, the water vapour transport, melting processes and mechanical loading. This leads to the formation of different types of snow grains, which are classified into main snow types. Different snow events form different snow layers with different snow types and thus different mechanical properties. These properties determine the stability of the snowpack.
1.1.2
The snowpack and its stability
A typical seasonal snowpack consists of different snow layers having different properties (Fig. 1.2). For example, they differ in their density, specific surface area (SSA), grain shape and size. These different geometric and microstructural properties define the mechanical properties at the bond scale but also at the scale of the whole snowpack. One example of this mechanical behaviour is the cohesion between the grains. A layer which exhibits weak cohesion, a so-called weak layer, is one of the main trigger for avalanches. Persistent weak layers are typically made of depth hoar or faceted crystals, that means they are formed at the surface when a strong temperature gradient acts on the layer for one week of more. If these weak layers are now covered by a packed layer, also called slab-layer, with relatively strong cohesion an avalanche prone layering is formed. Such a slab-layer, is for example a layer of wind packed snow, as described in the previous section. When a skier or hiker passes over such a layer, their weight can reach the weak layer and a crack appears in the weak layer, propagates, and the slab-layer will slide downwards.
14 1.1. General introduction: From a snowflake to an avalanche
This is a so-called slab avalanche. Fig. 1.3 shows a scheme of such a snow layering with an avalanche and also a photo of such a weak layer. The danger associated with this type of avalanches is that the weak layer cannot be seen from the surface.
Figure 1.2: Photo of a snow pit. The image was taken the 25th February 2016, Col de
Lautaret, French Alps.
Figure 1.3: a) Scheme of a slab avalanche from Schweizer et al. [2003] and b) images of
Other avalanches that can occur are powder snow avalanches or melt snow avalanches. If a considerable mass of fresh snow falls, it can be too heavy and if the load exceeds the capacity of the snowpack to hold the snow, a spontaneous avalanche release may happen. These are fluid-like avalanches. The melting avalanches occur most probably in spring. Due to a strong increase of the water content the snow resistance decreases and this may lead to an avalanche. This process can even be intensified if rain adds an additional load to the snowpack. The two latter avalanche types generally release spontaneously without any triggering agent. In the French Alps, each year about 30 people lose their lives due to avalanches (source ANENA). A significant number of them are due to slab avalanches.
The avalanche risk management is divided into two categories: one is the forecast of the avalanches for short-term forecast and the other one is the determination of the risk of avalanches in long term. For the second one, hazard mapping exists. These are maps, which indicate the risk of avalanches in general. This data can be of interest for industries, real estate developments, etc.
During the winter, the French weather service, Météo-France, publishes an avalanche bulletin on a daily basis. To write this bulletin, an avalanche forecaster combines information of snowpack measurements, weather conditions, results of forecasting models and certain insights that only come from experience. The snowpack forecasting model used at the French weather forecasting service is the SAFRAN-CROCUS-MEPRA model [Durand et al., 1999], which computes a stability index as a function of the past and the modeled weather conditions. The published bulletin gives information related to the avalanche danger within a scale from 1 (low) to 5 (very high) for different altitudes as well as for the different orientations of the slope. In addition to the scale, a summary is provided with the estimation of the avalanche activity, containing the frequency of the release and the size of the avalanche. It contains a more detailed description of the stability of the snowpack than the scale.
To sum up, an in-depth knowledge related to the snow structure is important for avalanche forecasting, for example. To this end, a detailed knowledge of the snow stratigraphy and the related mechanical properties is important. The following section delves into the existing measurements and models to characterize a snowpack.
16 1.1. General introduction: From a snowflake to an avalanche
1.1.3
Characterization methods for snowpacks
Detailed knowledge of snow stratigraphy is important for avalanche forecast, the prediction the water runoff and estimating the Earth energy budget.
The measurements for the snowpack are done by snow observers. The aim is to identify the different layers of the snowpack and their properties. To perform such measurements, a pit is dug and a preliminary rough identification of different layers can be done by looking at the snow pit wall. Figure 1.2 shows an example for a layered snowpack, where the layers can be clearly observed. However, normally, a more detailed analysis of the different properties is required to distinguish the different layers. One method is by touching the snow, and feeling the different layers. Once the different layers are identified, the observer will look at the grains under magnifying lenses to determine the size. An international classification [Fierz et al., 2009] exists to classify the different shapes, and the main snow types are represented by symbols. For each layer, a first symbol indicates the major type and a second one the minor grain type. Besides, the grain size is estimated as well. Figure 1.4b shows these results in the first two columns. The third column depicts the hand hardness (HH). It is a test conducted by the observer with hand to estimate the hardness of the snowpack. It is a scale from 1 to 5, one being the softest and five the hardest [de Quervain, 1950]. The last column shown in Fig. 1.4b is the humidity measurement of the layer. Humidity measurements are conducted, if the temperature of the snow layer is 0◦, then liquid water may be
present in the snowpack. Additional measurements which are performed on the snowpack (not shown here) are temperature and density. These measurements presented here are often observer dependent, it is for example not obvious to find the mean size of the grains and to classify them after their shape.
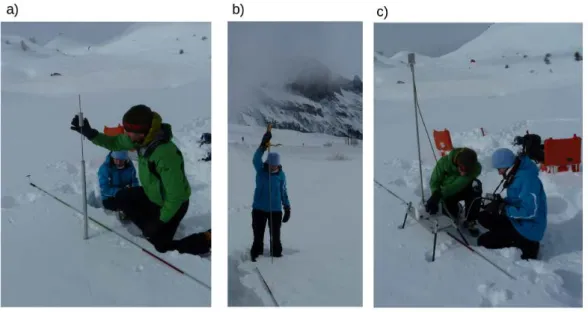
Another method of obtaining information related to the snowpack are by performing cone penetration tests. A cone penetration test consists of measuring the force required to penetrate the cone into the soil. In snow the swiss ramsonde penetrometer was developed in the 1930’s [Bader et al., 1939]. This is an additional measurement done during a typical snowpack measurement. It consists of a hammer with a weight on top. For the measurement the observer let drop this hammer on the rod and observes the indentation height from a scale, which is engraved on the rod (Fig. 1.5a). Also higher resolution and electrical penetrometers exists. For example the SP2 (Avatech, Fig. 1.5b) is a penetrometer, which provides a digital measurement the penetration force, but is inserted by hand. And then there are digital penetrometers with constant penetration speed like the
Figure 1.4: a) Image of the snow layer overlaying the smoothed force profile, b) information of the Col de Porte, Chartreuse, French Alps, 11/03/2016 Hagenmuller et al. [2018b]. The hardness profile is obtained by the SnowMicroPenetrometer (SMP) and HH is the hand hardness.
SnowMicroPenetrometer [Schneebeli and Johnson, 1998]. It is an instrument with high resolution which is nowadays used by researchers (Fig. 1.4c).
In research several other studies exist to measure the snow properties. One method is the micro-computed tomography (µCT), which results in high resolution three-dimensional images of the snow. To this end, two-dimensional radiographs covering a 360◦ rotation are taken, which are then reconstructed into
three-dimensional grayscale images representing the attenuation coefficients of the different materials composing the samples. The resolution of such images are a couple of micro-metres, while the samples have a size of a couple of cubic centimetres. The resulting images help to obtain a detailed view of the snow microstructure and possibly the numerical computation of physical and mechanical properties of the snow sample (based on homogenization techniques). One example is the determination of the elasticity (the Young modulus) of the snow [e.g. Gerling et al., 2017]. Another example is to follow the metamorphism of snow over a couple of
18 1.2. State of the art: Snow measurements and their applications
Figure 1.5: Photos of different penetration tests: a) the Ramsonde, b) the SP2 and c)
the SnowMicroPenetrometer (SMP).
days to a couple of months [e.g. Schneebeli and Sokratov, 2004, Calonne et al., 2014]. The µCT cannot be conducted routinely in the field at low cost.
The SnowMicroPenetrometer (SMP) can bridge the gap between measurements of the snow microstructure and the ones conducted in the field. In general, the first ones can be only used in a cold room, wile the latter ones have less resolution and are often observer-dependent. Indeed, the SMP force measurements of such a high resolution contain data related to the snow microstructure. Another advantage of the SMP is, that it takes a couple of minutes to obtain a profile, while a complete measurement of the snowpack may take several hours. However, today, we still need to better understand the recorded force from the SMP and its link to the microstructure. In the following section a more detailed scientific approach of cone penetration tests in snow as well as existing measurements of the snow microstructure is presented.
1.2
State of the art: Snow measurements and
their applications
Snow measurements are performed in the field and in the cold labs. They are helpful in measuring geometrical and mechanical properties, here we concentrate on two
types of measurements used in this thesis, the cone penetration tests and the micro-computed tomography. Firstly, we present the penetration tests in general and their application to snow. Followed by a section of the measurements to visualize the snow microstructure. Finally, the link between the two methods is done by presenting the studies, that estimate the microstructure from penetration force profiles.
1.2.1
Penetration tests in snow
”Hardness is the resistance to penetration of an object into snow”[Fierz et al., 2009]. Measurements of snow hardness exist from a long time to characterize the snow. There exist different experiments to measure the hardness, like the previously explained hand-hardness measurements used by the snow observers for the avalanche prediction service. Another way to measure the hardness are the so-called push-pull gauges [Takeuchi et al., 1998], which can be explained as the digital version of the hand-hardness test. These measurements require an opened snowpack. Contrary to this, the cone penetration measurements have the advantage of measuring the profile of the snowpack without digging. Fukue [1977] showed a good correlation between the measured resistance of a penetrating blade and the unconfined compressive strength of snow.
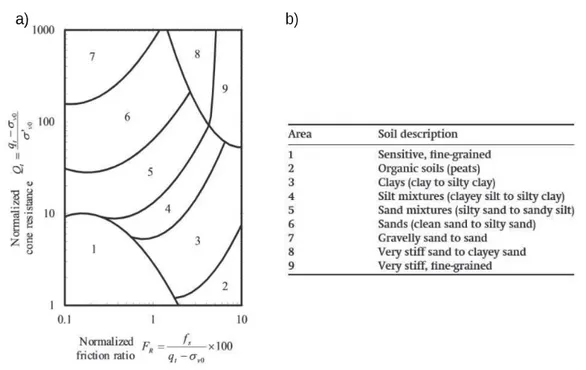
Cone penetration tests (CPT) measure the force required to make a cone penetrate into the material of interest. In addition to the recorded forces a classical CPT in soils includes sleeve friction and pore pressure measurements [e.g. Schmertmann, 1978, Mayne, 2007]. To interpret CPT results, for example Robertson [1990] developed soil classification charts using the cone resistance and friction ratio based on empirical relations (Fig. 1.6). Other experimental studies, like Mulqueen et al. [1977] observed an increase in the limit force with increasing cohesion, which also depends on the soil and its moisture content. In addition to this experimental studies, theoretical approaches give new insights to the understanding of the recorded force. As an example, the cavity expansion model is widely applied for the interpretation of the penetration resistance. Bishop et al. [1945] developed this model to derive the material properties of clay and sand from CPT profiles. Nowadays, this model is implemented in many CPT inversion models used in studies related to soil mechanics. Two of its advantages are its easy implementation and the capability of describing elastic and plastic material deformation during CPT [e.g. Yu and Mitchell, 1998, Ruiz et al., 2016].
As mentioned earlier, the first known application of cone penetration tests to snow was done in the 1930’s with the development of the Swiss ramsonde penetrometer [Bader et al., 1939]. Since then, the CPT has continuously evolved leading up to
20 1.2. State of the art: Snow measurements and their applications
Figure 1.6: Soil classification chart for cone penetration measurements (a) and the
corresponding soil classification table (b) from Wang et al. [2013] adapted from Robertson [1990].
digital CPT of today. Bradley [1966] developed the resistograph, which measured the penetration resistance with respect to the depth and records it on a paper. In later studies, [Bradley, 1968] showed a good agreement between the snow strength measured by the snow resistograph and compressive strength measured by loading to failure method. Later on, Dowd and Brown [1986], developed to the best of our knowledge, the first digital radiograph, which recorded the penetration force with a resolution of 5 mm. Brown and Birkeland [1990] further improved this radiograph, so that it was able to digitally store a large number of profiles recorded on the field, which could be quickly off-loaded onto a computer. Other penetrometers were developed, which do not measure the penetration force, like the portable capacitance snow sounding instrument [Louge et al., 1998]. This instrument records profiles of dielectric permittivity through a relatively dry snowpack. Schneebeli and Johnson [1998] developed the SnowMicroPenetrometer (SMP), which is largely used even today, and also used during this thesis. The conical tip, which measures the force, has a diameter of 5 mm and a half cone angle of 30◦. It is mounted
on a rod of 18 mm in diameter. The SMP measures the penetration force with a frequency of 5 kHz, and a velocity of 20 mm s−1 (i.e. a vertical resolution of
micromechanical properties of the snow [Johnson and Schneebeli, 1999, e.g.]. Other digital penetrometer exists like the SABRE penetrometer [Mackenzie and Payten, 2002]. It is a manually operated penetrometer, which records the force with a frequency of 500 Hz. In contrast to the other penetrometer, it has a spherical tip of 12 mm diameter. It was developed for Himachal Helicopter Skiing to obtain a fast and accurate information of the snowpack for the ski runs.
Recently, the company MountainHub (before Avatech) developed manual-driven penetrometers. A first version was the SP1 and SP2 [Avatech, 2014] (Fig. 1.5b). The SP2 consists of a measuring conical tip of 5.44 mm in diameter, with a half cone angle of 30◦. The penetrometer is pushed manually into the snow up to
a depth of 142 cm leading to about one force measurement each millimeter. A combination of different infrared sensors, the tip force sensor and an accelerometer is used to compute the depth and hardness. Hagenmuller et al. [2018a] compared SP2 measurements to SMP profiles. They report that the SP2 displayed similar stratigraphic features to that of the SMP profiles, but were less repeatable. The SP2 showed large vertical variability, with a standard error of 7.5 cm. The Scope penetrometer is a further developed version of the SP2, which is imbedded into a ski pole (http://about.mountainhub.com/scope/). It can be directly connected to a smartphone via Bluetooth and the snow stratigraphy can be visualized directly. No scientific studies of the Scope have been reported yet in literature. Nevertheless, these type of penetrometers are promising as they bridge the gap between expensive penetrometers for research, such as the SMP, and a very simple instrument like the ramsonde.
For avalanche forecast it is crucial to estimate the snowpack stability [Schweizer et al., 2003, Gaume et al., 2014]. Cone penetration tests provide a rapid measurement of the snowpack, independent of the observers. Now, some studies shall be presented as to how CPT tests in snow were interpreted in terms of snow stability and snow type. Schweizer and Wiesinger [2001] mentioned that the ramsonde profile is useful to classify a snowpack into either being potentially stable or potentially unstable. However, Pielmeier and Schneebeli [2003] showed that thin weak layers are not recorded by the ramsonde, because of its low vertical resolution and its coarse hardness measurements. They summarize that the SMP captures stratigraphic features most effectively as compared to hand-hardness measurements and ramsonde profiles. Also Schneebeli et al. [1999] pointed out the high precision with which they measured the forces at interfaces between weak and hard snow layers. These results were confirmed by Kronholm et al. [2004], who analysed the spatial variability of the SMP resistance with respect to snow pit measurements, containing ramsonde,
22 1.2. State of the art: Snow measurements and their applications
rutschblock test, and hand measurements. They concluded that it is possible to identify distinct layers based on the changes in penetration resistance. Birkeland et al. [2004] investigated buried surface-hoar layer with the SMP from observation of 2 measurement days which were 6 days apart. No statistically change in mean, minimum, median of the SMP force signal were noticed in these layers, but its maximum hardness, variance and coefficient of variation increased.
Further studies have tried to detect and classify the different snow layers and classes from the SMP force profiles. For example, Pielmeier and Schweizer [2007] derived a classification tree to detect a failure layer using texture index, mean structural dimension length and a computed grain dimension. They achieved a classification accuracy of 65%. Lutz et al. [2007] analysed the SMP force profiles with regard to depth hoar, by computing the coefficient of variation with a moving window statistical operations. They detected higher coefficient of variation values for depth hoar. Bellaire et al. [2009] developed a stability algorithm for SMP measurements to get an automatic detection of the layers, which is most prone to avalanches. They divided the SMP signal into stability classes (poor and fair-good) and then the microstructural parameters are analysed in a step-wise sequential manner. They obtained an accuracy of 60%. An effective and reliable, automatic identification of failure layers in a SMP profile was developed by Herwijnen et al. [2009]. Nevertheless, this methods necessity a manual picking of a reference layer from the SMP signal. Satyawali et al. [2009] developed a preliminary approach, an observer independent snow classification of the 5 major snow classes by calculating the mean penetration force over 1 mm and its coefficient of variation, which are then analysed by a flow chart. Further, Satyawali and Schneebeli [2010] used the semivariogram for the interpretation of the SMP profiles, and showed that it is possible to estimate spatial scales of different snow classes. Similar analysis were also performed with the SABRE penetrometer: e.g. Floyer and Jamieson [2008] and Floyer and Jamieson [2009] presented a method to identify weak layers in penetrometer signals. Recently, McCallum [2014] presented experiments of the application of the CPT for soils to snow in the Arctic. McCallum and Wiegand [2018] developed a simple model to estimate snow strength from CPT sleeve friction data. For a complete validation of this model, more data is required.
These results provide an overview of the existing research on the SMP, but is in by no means exhaustive. There is another method of interpreting these signals and these are by means of inversion models, which try to derive micromechanical properties from the snow. These will be presented in Sec. 1.2.3.
1.2.2
Link between cone penetration tests and snow
mi-crostructure
The previous two subsections (1.2.1 and 1.2.2) presented two different experimental methods used in this manuscript. The first one being, the cone penetration tests, which gives information of the microstructure of the snow, as it records the force with high resolution. The second one is the micro-tomography, which gives information of the microstructure of snow samples. The existing inversion models to link the CPT force profile to the snow microstructure are presented in this section.
Several statistical models exist to estimate micromechanical properties from the SMP profiles. They all assume the measured macroscopic force profile F (z) to be a superposition of individual ruptures of the bonds between the snow grains. All these models interpret a SMP profile F (z), i.e. the macroscopic penetration force F as a function of depth z, as the superposition of spatially uncorrelated but identical rupture events. Each event is assumed to correspond to the failure of one bond having an elastic-brittle behaviour. Indeed, Fukue [1977] showed by experiments of thin blade penetration that the brittle regime is obtained for penetration speeds above 0.6 mm s−1.
Johnson and Schneebeli [1999] assumed for their model, that the recorded force is composed of friction between the penetrometer and ice, and of the elastic deflection and rupture of microstructural elements (Fig. 1.7a). These elements are supposed to have the same mean value, but can be randomly distributed in space. Further, they assume the material compaction to be negligible. Their inversion model estimates the following properties: deflection at rupture δ, bond rupture force f and microstructural element dimension L. The microstructural bond force is expressed as fz(z) = f/δ × θ(z) × θ(δ − z) with θ the Heaviside function. From
these properties, they derived the macroscopic compaction strength (σmacro) and
elastic modulus (Emacro) as followed:
σmacro= f L2 δ L , Emacro= f δL δ L
Marshall and Johnson [2009] extended this theory by using Monte-Carlo simu-lations to take into account simultaneous rupture events and inverted the signal (Fig. 1.7b,c). Löwe and Herwijnen [2012] adapted the model into the formalism of a homogeneous Poisson point process (HPP), such that individual ruptures can overlap and are randomly distributed in space and can be described by a Poisson distribution
24 1.2. State of the art: Snow measurements and their applications
Figure 1.7: a) Schematic explication of the failure during the cone penetration [Johnson
and Schneebeli, 1999], b) the individual elements of ruptures and (c) the resulting force [Marshall and Johnson, 2009].
with an intensity λz. The convolution of the single event function fz and a random
sampling of the number of events results in a simulated profile F (z) (Fig. 1.7c). Further, Löwe and Herwijnen [2012] assumed the intensity λz to be constant
over depth and equal to λ. Based on this, they derived analytical expressions directly linking the cumulants and correlation function of the SMP profile F to the micromechanical properties δ, f and λ. They obtained the following relations:
κn(z) = fnδλ n+ 1 and C(z, z + r, |r| < δ) = f 2δλ 1 3 − 1 2 |r| δ + 1 6 |r|3 δ3 ! (1.1) where κn is the cumulant of order n (e.g. κ1 is the mean, κ2 is the variance) and
C is the two-point correlation function. The assumption of a constant intensity
also implies stationarity of F (z). Thus the stochastic cumulants and correlation function can be computed as ”depth” cumulants and correlation function (ergodicity). Even for homogeneous snow layers, measured penetration force profiles are rarely stationary with depth [Herwijnen and Miller, 2013]. Hence, it is difficult to split a penetration profile into stationary sub-sections. Simulated HPP showed better results with larger analyzing windows [Löwe and Herwijnen, 2012]. Therefore, it is difficult to strike a balance between large windows that are stochastically representative, and small windows within which the profile can be considered stationary. In literature, typical window sizes of 1 to 5 mm are reported [e.g. Löwe and Herwijnen, 2012, Proksch et al., 2015, Ruiz et al., 2017].
The results of the micromechanical estimates from the HPP are used in further studies to find macroscopic properties of the snow. Proksch et al. [2015] used
the median penetration force ( ˜F) and the microstructural element dimension,
which is derived from the rupture intensity (L = (Ac/λ)1/3, with Ac the cone
surface of the penetrometer).
ρSM P = a1 + a2ln( ˜F) + a3 ln( ˜F)L + a4L SSASM P = 4(1 − Φi) li with Φi = ρSM P/ρice and li = c1+ c2L+ c3ln( ˜F)
where a1,2,3,4 and c1,2,3 are coefficients obtained from regressions of their data.
These equations and the one for the macroscopic elastic modulus [Johnson and Schneebeli, 1999] are often used for analyzing SMP profiles. Studies of slope instability and crack propagation are done with these estimations [e.g. Reuter et al., 2015, Schweizer et al., 2016, Reuter et al., 2019]. Recently, Kaur and Satyawali [2017] presented a new method for the estimation of the density from SMP profiles, by peak counting. Ruiz et al. [2017] compared the macroscopic elastic modulus and compaction strength obtained from the HPP to the ones obtained by a cavity expansion model (CEM). This model was introduced by Bishop et al. [1945] in order to retrieve the material properties of clay and sand from a CPT. The main assumptions of this model are: that the material of interest is a continuum material, in other words, that the ratio of cone size to grain size is sufficiently large, and further that the forces acting on the cone penetrometer are solely radial. Ruiz et al. [2017] report from their experiments, that they obtain different values for the different models. The elastic modulus derived from the micromechanical estimates of the HPP seems to be underestimate for larger densities.
Experimental studies showed, that a non-negligible deformation zone is formed around the cone tip while penetrating [LeBaron et al., 2014, Herwijnen and Miller, 2013]. These two studies examined the deformation around the SMP tip by PIV. Herwijnen [2013] also used micro-computed tomography images of the samples after the SMP test in order to analyse the compaction zone (CZ) from the computed radial ”density” field. The CEM is a model which takes into account the deformation around the cone, while this zone is limited to a layer of width delta for the HPP, thus only a very layer that is probably underestimated. Nevertheless, the assumption of a continuum material is limited, as the typical cone to snow grain ratio for the SMP ranges between 5 and 50 [Herwijnen and Miller, 2013]. As per Bolton et al.