is an open access repository that collects the work of Arts et Métiers Institute of
Technology researchers and makes it freely available over the web where possible.
This is an author-deposited version published in: https://sam.ensam.eu Handle ID: .http://hdl.handle.net/10985/8095
To cite this version :
Bruno FRANCA DE PAULA, Gabriel REJDYCH, Thierry CHANCELIER, Guillaume VERMOT DES ROCHES, Etienne BALMES - On the influence of geometry updating on modal correlation of brake components. - In: XVIII symposium Vibrations, Shocks & Noise (VISHNO), Clamart : France (2012), France, 2102-07 - XVIII symposium Vibrations, Chocs et Bruits - 2012
Any correspondence concerning this service should be sent to the repository Administrator : archiveouverte@ensam.eu
Vibrations, Shocks and Noise
On the influence of geometry updating
on modal correlation of brake components.
B. França de Paula
a, G. Rejdych
a, T. Chancelier
a, G. Vermot des Roches
b*, E. Balmes
b,caRobert Bosch France SAS, 126 Boulevard Stalingrad, 93705, Drancy, France bSDTools, 44 rue Vergniaud, 75013, Paris, France
cArts et Metiers ParisTech, 151 boulevard de l’Hôpital, 75013, Paris France
Abstract
In most industries dealing with vibration, test/analysis correlation of modal properties is considered a key aspect of the design process. The success of test/analysis methods however often show mixed results. The aim of this paper is to assess and answer some classical correlation problems in structural dynamics. First an investigation of correlation problems from tests is proposed. Tools based on the modal assurance criterion are presented to provide a deeper analysis of correlation and results improvement. In a second part, the need of FEM topology correlation and update is demonstrated, using an efficient morphing technique. Tolerances in the manufacturing process that are well accepted in design and production stages are shown to lead to significant degradation of the test/analysis correlation. An application to an industrial brake part is eventually presented, in an approach of correlation procedure automatization for recurrent use.
Keywords: Correlation ; finite-elements models ; model updating ; morphing ; modal assurance criterion ; reduction ; test-analysis correlation
1.Introduction
NVH (Noise Vibration Harshness) is a common source of problems that need to be addressed in the design of vehicles. To improve the design cycle in quality and resources needed, finite element models (FEM) are used to make predictions, discriminate between designs and analyze quantities that are not accessible to test. At various steps, test/analysis correlation is then used to validate the predictions made of components and assemblies.
While the quality of FEM models is very well established, test analysis correlation very often shows mixed results. Understanding the origin of problems in correlation is thus a critical aspect of a proper use of such procedures.
The first objective of this paper is an analysis of correlation problems coming from tests. When using rich scanning laser vibrometer measurements, analyzing measurement quality is a problem. Intermediate levels of correlation are thus shown in section 2.1 to be possibly due to measurement errors. It is first shown how the MACCo [1] is appropriate for outlier removal thus leading to improved correlations. The second common problem is associated with closely spaced modes. It is then shown how a subspace based Modal Assurance Criterion (MAC)
[2] is a more relevant indication when correlating very close modes.
The second part of the paper addresses errors coming from FEM. Classical updating procedures consider that model properties are not well known. These are material properties for components and junction properties for assemblies. The assumption generally made is that since objects and FEM come from the same CAD geometry errors there are minimal. Using morphing tools to adjust geometries for sensitivity and geometry updating studies, section 3 illustrates the fact that this assumption is far from being true.
Section 4 eventually presents the integration of these correlation tools into a full updating process applied to a real component.
2.Experimental sources of poor correlation
When performing test/simulation correlation it is a common procedure to consider test data as exact. This is of course not the case, and a good correlation methodology should consider that error sources can come from test data and from simulation data. This section focuses on the exploitation of the MAC and illustrates how poor results can arise although an objectively good correlation exists.
2.1.Efficient use of the MAC for test correlation with rich data
All experimental results contain errors – this is usually improved by a pass of so-called outliers’ removal. The detection of outliers however becomes difficult when the number of measurement points increases. Laser vibrometry performed on meshes of over 1,000 points in the three directions lead to large amounts of data. Some points are noisy, due to poor local reflection of the laser beam (orientation, surface roughness, partially masked edge …) and should be removed. Performing Operational Modal Analysis (OMA) adds a level of difficulty and error source, so that it is tempting to base the correlation on Operational Deflection Shapes (ODS) at peaks of the measured response.
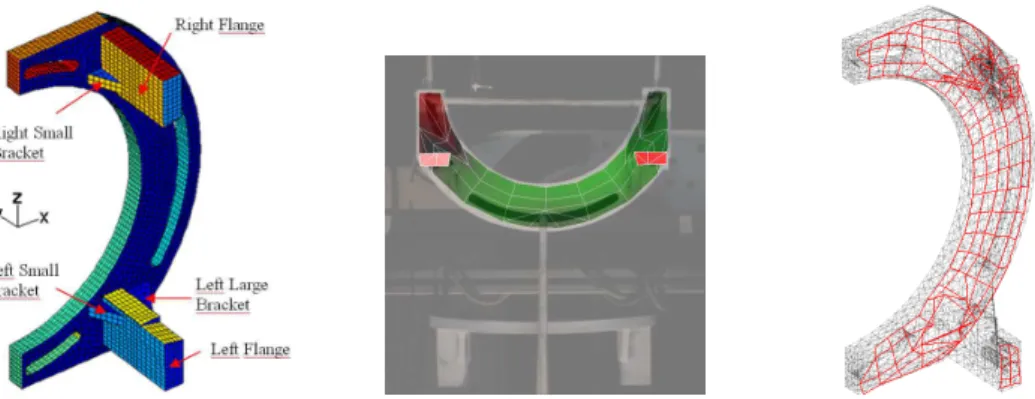
The MACCo is a pure what if algorithm, looping on the sensors set and targeting the one that if removed would most improve MAC results. The sensor removal is then chained sequentially up to a desired number of sensors. This process is an efficient procedure for outlier detection assuming that the correlation is not too poor. Figure 2 illustrates this pattern by showing the MAC results between the experimental and the FEM modes (without additional updating) of a test bench component presented in figure 1.
Fig. 1. Presentation of test test bench component studied. (a) FEM and denomination of areas of interest. (b) Illustration of a vibrometry measurement. (c) FEM and test-mesh wireframe positioning.
Figure 2(a) thus shows at first glance a poor correlation with only two to three modes properly identified.
Fig. 2. MAC between FEM and experimental results for the test bench component (504 sensors) (a) Raw MAC result; (b) MAC result with 1% of removed sensors with MACCO, (c) MAC result with 40% of removed sensors (d) MAC result with 80% of removed sensors.
Figure 2(b) shows that with 1% of sensors removed the results can already be improved. Pushing the algorithm further highlights the fact that an optimum exists where only relevant information can be kept, without significant degradation of the result. This optimum was here found around 40% of sensor removal (200 over a total of 504 sensors), as illustrated in figure 2(c), where 12 modes can be identified. Removing more sensors is then becomes difficult as the measure autoMAC degrades. Figure 3 eventually shows the modes identified by MAC after the MACCo loop.
Fig. 3. Modes identified after the MACCo pass
Figure 4 illustrates the same pattern quantitatively. A MAC quality criterion has been developed to quantify the results on identified modes, by pondering the diagonal MAC value with the sum of the extra-diagonal term values.
( )
( )
∑
∑
= =+
⋅
×
=
NEXP FEM k N l MACl
i
MAC
i
k
MAC
i
i
MAC
i
i
MAC
i
Qual
1 1)
,
(
)
,
(
,
2
,
)
(
(1)Fig. 4. Evolution of the MAC quality criterion as function of the number of removed sensors. (a) Modes up to 2.8kHz. (b) Modes between 2.8 and 5.7kHz. (c) Modes between 5.7 and 10kHz.
It can thus be seen that a clear and global MAC improvement is obtained during the removal of the first percents, for all frequency bands. Improvements over this threshold depend on the frequency band. Indeed, the optimum for the low frequency band (figure 4(c)) occurs for a removal of 30%, 50% for middle band and over 60% for higher frequencies.
Since lower frequency modes are more global in terms of deformation, the presence of very poor sensors disturbing the results are quickly found by MACCo. This is less true for higher frequency modes, where local aspects become important. Modes with low observability can thus be sensitive to specific poor sensors with a local effect. Such type of sensor is not efficiently detected by the MACCo, hence the difficult optimization of higher frequency modes with a raw MACCo. Improvement of this work would consider a MACCo for mode subsets with equivalent observabilities, thus focusing on the removal of a minimal set of sensors with efficient effect on global and local scales.
2.2.Subspace correlation for closely spaced modes
When measuring components with closely spaced modes, the order between experimental result and numerical modes can change. A fact that tends to be ignored and will be illustrated here is that the shapes themselves can then be different, although the subspaces generated by the shapes of both models are the same.
The realization of subspace correlation based on the shapes compared can be realized by considering a cross projection. Given two sets of shapes,
φ
from the numerical model andψ
from the experiment, expressed on the sensor sets, one projects the experimental shapes on the subspace generated byφ
such thatψ
φ
ψ
=
ˆ
(2)where
ψ
ˆ
is the projection ofψ
onφ
.A singular value decomposition on
ψ
ˆ
can then be performed to obtain a second displacement basis of the subspace spanned byψ
ˆ
, in the space spanned byφ
T
v
u
Σ
=
ψ
ˆ
(3) Tuv
is thus a normed and reordered basis of the subspace spanned byψ
ˆ
in the space spanned byφ
. If both subspaces are well correlated, the restitution of this reordered basis in the space spanned byψ
andψ
itself are identical, else, a poor result will be obtained.The proposed application is a symmetry breaking effect on a test bench component. Several configurations are tested, with different heights of the large left bracket height, shown in figure 5. Two modes are identified involving flexions of the component flenches, highly impacted by the brackets.
Fig. 5. Identification of the test bench component brackets linking the base and the flench parts
When both brackets have the same height, both flexions are at the same frequencies, yielding an in-phase, and out-of-phase mode. When different heights are applied, the frequencies are separated and two modes featuring a single side flexion are found.
When studying the MAC between the modes computed with the reference, taken with identical bracket heights, and the modes with asymmetrical brackets, a cross pattern occurs as the shapes frequencies come closer, illustrated in figures 6 and 7(a).
The shapes evolve as function of the braket height. It can be seen in particular that the MAC between modes 14 and 15 decreases while modes 17 and 18 cross. Using the subspace correlation method, used to produce the MAC results of figure 7(b), it is understood that in fact the space spanned by these 5 five shapes is strictly identical in all cases.
Fig. 7. Mode crossing patterns as function of the component bracket height. (a) Upper figures: Raw MAC. (b) Lower figures: subspace correlation.
3.Effect of geometry variation on modal properties of a simple component
The common practice is to update material properties of component parts. This methodology however assumes that the FEM geometry is identical to the real component. For parts with local geometrical refinement, and whose production method shows significant variability (in the mm range for die cast brake parts), this assumption is often false (see [3] for example). This section aims at showing that errors on geometry can yield errors on modes which may be larger than those due to errors on material properties thus implying the need to update geometries.
3.1.An efficient morphing technique for geometry updating
Geometry updating is set on the same basis than usual shape optimization methods. Here modifications are deemed to be slight from a given FEM, so that only morphing is considered. Morphing defines a methodology of topology deformation by moving certain nodes, edges and/or surfaces of the component. The additional constraint placed here is that the component FEM already exists and remeshing is excluded thus allowing easy comparisons of models with a constant number of nodes and degrees of freedom.
Classical morphing techniques often fail as the surface mesh deformation used to adapt the component shape is not properly transmitted to the volume mesh, thus leading to mesh geometries that are not suitable for FEM computations. To succeed, morphing must continuously and smoothly transmit the component surface deformation to the underlying volume mesh. This effect is obtained here by successively morphing edges, surfaces and volumes. Applying such morphing methodology thus allows much higher amplitude of topology deformation without having to remesh the component.
Figure 8 shows the application of this morphing methodology on the component left bracket. Looking at figure 5, the three top points of the bracket are commanded in height. For a nominal height of 50mm, a range of 17mm is
available (-7 to +10mm) without need of remeshing. Figure 8 shows in particular that a large portion of the flench surface is impacted by this height modification, although the topology outside the bracket is unchanged.
Fig. 8.(a) Morphing applied to a height reduction of 7mm of the 50mm height bracket (b)Morphing applied to a height increase of 10mm of the 50mm height bracket.
A first application of morphing is the study of component sensitivity to geometric modification. Areas of interest can for example be found by looking at the localization of high strain energy density areas. Figure 9(a) indeed shows that modes 14 and 15, sensitive to the bracket height have high strain energies in this area, and show high frequency variation as function of this parameter in figure 9(b).
Fig. 9.(a)Localization of strain energy density for modes 14 and 15 (b)Frequency variation of modes 14 and 15 as function of the bracket heights (symmetrical modification).
3.2.Improving correlation using measured geometries
To update the component model, a measure must be provided, based on an accurate topology measurement, using for example a COMET bench measure. Figure 10 shows the real component measurement on the COMET bench and the component FEM along with their orientation basis.
Fig. 10.(a) Measurement component mesh output by the COMET test bench. (b)Component FEM. Blue lines are orientation bases of both models for initial positionning
The comparison between both meshes is not straightforward. The measure output is a very fine surface mesh, corners are not straight, and some faces are missing. The FEM is much coarser, and has straight edges. Once both meshes are overlayed, the geometry update aims at sticking the FEM surface onto the measured one. Figure 11 shows the initial mesh superposition, with clear differences.
Fig. 11. Initial superposition of the COMET bench measure and the FEM, over two 2D views. The FEM is represented by its control points forming the component surface edges (in red).
A manual pass has to be done to correct outstanding errors. Control points on the FEM model are thus defined, here on the surface edges of the FEM, as illustrated in figure 11 and 12. This allows a manual input of macroscopic surface displacements, as illustrated in figure 12
The effect of the topology update on mode frequencies is provided in Figure 13. It can be seen that errors up to 9% was introduced by the geometry imprecision.
Figure 13. Frequency error between the initial FEM and the updated FEM, along with most impacted modes (color code, element strain energy density)
The most impacted modes also shown in figure 13 are the modes with high strain energy in the outstanding areas. Such errors are very high regarding usual errors on Young modulii and density for isotropic steels.
The impact on MAC is also of interest. Here the MAC between initial and updated FEM is computed for identical geometrical points. The aim is not to measure mesh points having moved during the geometry update. Figure 14 shows that some modeshapes significantly evolves as function of the topology update.
4.Full updating process applied to real brake parts
The results presented in section 2 and 3 are here integrated to a full updating process of a real brake component. The focus is also set on the procedures automatization for recurrent use in production.
4.1.Geometry updating of a brake anchor and correlation
Tolerances between a nominal model and an industrially produced part can show some variations. A brake anchor is tested here, presented in figure 15(a). A first pass of manual correction on macroscopic errors is first performed to correct outstanding errors, like illustrated in figure 15(b).
Figure 15. (a) Industrial brake part studied. (b) Manual correction of macroscopic errors
A pass of automatic correction can then be performed to optimize shape corrections over multiple faces for fine tuning. It is indeed unpractical to manually control surface movement under 0.5mm. The methodology applied to the automatic correction computes for each FEM element of the surface the distance to paired elements of the measured surface, along the FEM normal. A correction field can then be computed by applying these differences along their normals.
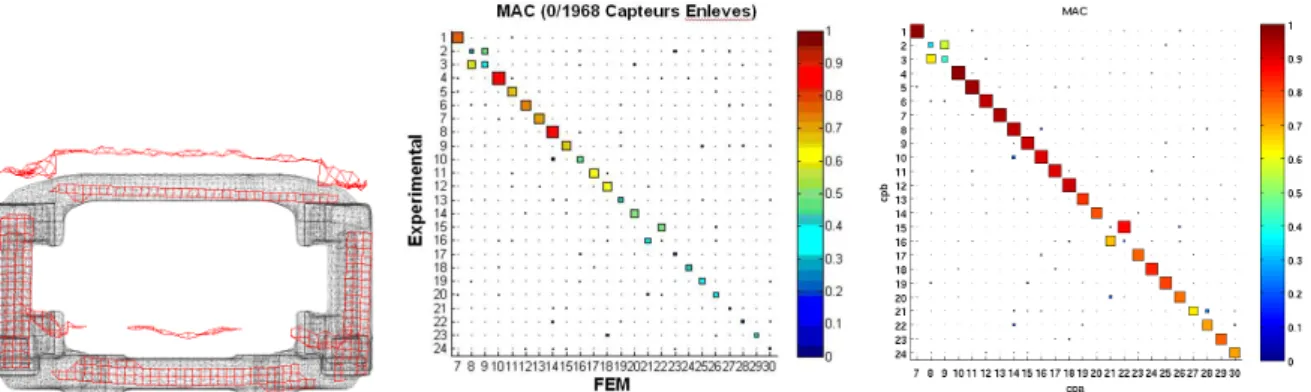
Figure 16 shows two passes of automatic correction and the visualization of the faces. It can be seen a reduction of topology errors, from an initial mean error of distances of 0.5mm to a maximum of 0.03mm. The impact on the model frequencies is presented in the conclusive figure 19.
Experimental data are obtained performing ODS on the component, using a laser vibrometer with 656 positions in the three directions, yielding 1968 sensors. The view positioning on the FEM model for MAC computation must be handled with care. Indeed, the laser measure has to be matched on the solid surface, although the mesh position output by the laser is not always very precise. Figure 17(a) shows the FEM and an initial test frame positioning, output by laser. The first MAC obtained in figure 17(b) is not fully satisfying. Performing a proper surface match with projection on the FME surface yields the MAC of figure 17(c), which is clearly improved.
Figure 17. (a) Positioning tolerances between the FEM and the wire frame imported. (b) first MAC using a direct match between both meshes. (b) Improved MAC by performing a proper test wire frame projection.
The MAC results of figure 17(c) can be further improved by performing the MACCo pass presented in section 2. Figure 18 shows the results of the MAC improvement by sensor removal, using the MACCo and the MAC quality criterium (1). An optimum arises around a removal of 40% of the total set of sensors. A significant improvement of the MAC results is obtained for the higher frequency modes.
Figure 18. (a) MAC quality criterion evolution as function of the sensor removal. (b) Final MAC after 40% sensor removal
4.2. Property updating
Once modeshapes and geometry have been correlated in section 4.1, material properties can be updated correlating frequencies. Indeed, one is now ascertained that material updating will not be biased by geometry imprecision. An automatic updating procedure has been developed to update simple material formulations in mass and Young modulus.
The total mass of the component can be computed by projection of the mass matrix on the system geometrical rigid body modes normalized to one. Indeed, the mechanical energy of the component following a rigid body trajectory is rbm T rbm m
M
E
φ
φ
2
1
=
(4)If the rigid body trajectory is normalized to one, the mass is directly integrated over the structure, thus yielding a very quick mass estimation. A proportionality coefficient can then be applied to conform to the measured mass of the real component.
Updating the Young modulus of an isotropic material is also straightforward. Brutal force is chosen here, computing the system frequencies over a large range of interest, with a refined Young modulus discretization. That is to say 2,000 computation points between 213 and 225 GPa.
Model reduction is here employed (see [4] for example) to optimize computation time. Current modeshapes are used as Rayleigh-Ritz vectors since shapes are well correlated. The Young modulus is a factor of the reduced stiffness matrix, so that its parameterization is trivial. The total system size thus decreases from over 200,000 DOF to 30 DOF. Several optimum detection strategies can be explored, trying either to minimize mean frequency errors, or standard deviation, or maximum error. Since the parameter is very macroscopic to the system, it was chosen to minimize the average frequency error, i.e. finding the Young modulus
E
opt verifying
∆
=
∆
∑
∑
es i i i E es i i opt if
E
f
f
E
f
mod mod)
(
min
)
(
(5)The final update results of the component can thus be summarized in figure 19. It can be seen that an average error of 0.96% is obtained on frequencies. A reminder of the effect on frequencies of previous updating steps is also presented.
Figure 19. (a) Evolution of the FEM frequencies during the updating sequence. (a) after topology update, (b) after density update, and (c) after Young modulus update.
5.Conclusion
The aim of this paper was to show how an eventually good FEM/test correlation was improved. Test data improvement was performed using MAC based tools outlier removal and subspace correlation. The key aspect of FEM topology updating regarding the real tested component has also been illustrated, through the use of an efficient morphing technique. This appears to be as sensitive and influent as the classical material parameters used in updating procedures. This kind of error, if not handled, usually ends-up as a bias into the materials property update. Although some applications can bear it, some where material identification is sought, or where topology has a great influence (shells) should avoid this bias.
The idea that the measure and the FEM have inherent and unavoidable defaults must be assessed, to only exploit the better of both. This becomes a clear stake in an industrial environment where this work is classically performed by two separate teams, one mastering experiments, and the other mastering FEM computations.
A natural step further in this work is to master assemblies. Control of mechanical assemblies’ modal properties is sought at the design stage, which implies a fine test/correlation analysis validation at each level. The role of geometry in the way contacting solid interfaces behave indeed requires a robust model at the component level.
References
1. E. Balmes, J.P. Bianchi, G. Vermot des Roches, Structural Dynamics Toolbox User’s Guide, SDTools, 2011.
2. R.J. Allemang, The modal assurance criterion (MAC): twenty years of use and abuse. Proceedings of IMAC20, the International Modal Analysis Conference, Los Angeles, CA, USA, pp. 397-485, 2002.
3. E. BLAIN, Etudes experimentales et numériques de la dispersion vibratoire d’assemblages soudés par points, Ph.D thesis, Ecole Centrale Paris, 2000.
4. E. Balmes, Parametric families of reduced finite element models. Theory and applications, Mechanical Systems and Signal Processing, v10, n4, July, pp. 381-394, 1996.