HAL Id: hal-02078673
https://hal.insa-toulouse.fr/hal-02078673
Submitted on 25 Mar 2019HAL is a multi-disciplinary open access
archive for the deposit and dissemination of sci-entific research documents, whether they are pub-lished or not. The documents may come from teaching and research institutions in France or abroad, or from public or private research centers.
L’archive ouverte pluridisciplinaire HAL, est destinée au dépôt et à la diffusion de documents scientifiques de niveau recherche, publiés ou non, émanant des établissements d’enseignement et de recherche français ou étrangers, des laboratoires publics ou privés.
STRUCTURES BY EMBEDDED SENSORS
Hang Li, Marianne Perrin, Florent Eyma, Xavier Jacob, Vincent Gibiat
To cite this version:
Hang Li, Marianne Perrin, Florent Eyma, Xavier Jacob, Vincent Gibiat. MOISTURE CONTENT MONITORING IN GLULAM STRUCTURES BY EMBEDDED SENSORS. 4th international con-ference on Structural Health Assessment of Timber Structures, Sep 2017, Istambul, Turkey. �hal-02078673�
MOISTURE CONTENT MONITORING IN GLULAM STRUCTURES BY
EMBEDDED SENSORS
Hang Li1, Marianne Perrin1, Florent Eyma1, Xavier Jacob2 and Vincent Gibiat2
1
Institut Clément Ader (ICA), CNRS UMR 5312, University of Toulouse, UPS, 1 rue Lautréamont, 65000 Tarbes, France
2
PHASE Laboratory, EA 3028, University of Toulouse, UPS, 118 route de Narbonne, 31400 Toulouse, France
Keywords: Moisture content monitoring, Glulam structures, Electrical measurements, Ultrasonic
measurements, Embedded sensors
Abstract. Introduction:
Today, more and more timber structures (especially glulam structures) are used in civil engineer-ing in respect of sustainable development and thanks to their competitive costs. However, the du-rability problem limits their development. Degradations related to excessive moisture content (MC) or to the wetting/drying cycles were observed and can lead to severe structural damages. In order to promote the use of wood in construction, infrastructure supervisors have expressed their need on continuous monitoring techniques of wood MC. However, no information exists in litera-ture regarding the MC monitoring inside the lamellas of glulam.
Developments:
In the light of this observation, we propose to transform glulam into “smart material” by embed-ding the MC monitoring system between the lamellas, on taking into account the major con-straints of fabrication of this material (the small glue line thickness, the important bonding pressure, etc.). To achieve this, we have selected two families of methods: the electrical methods and the ultrasonic method. The former are based on resistive/capacitive measurements and the latter consists in the analysis of ultrasonic wave propagation in the material. 4 measurement con-figurations were identified for the electrical measurements using pin-type or surface-type sensors. Regarding the ultrasonic measurements, 2 configurations were proposed and tests were realized with two families of piezoelectric film sensors (PVDF (Polyvinylidene fluoride) and MFC (Macro Fiber Composite)).
Remarks and Conclusion:
Our results showed that it is possible to conduct electrical/ultrasonic measurements in wood with the proposed measurement configurations. The influence of bonding pressure and sensor distance was also investigated. Future study should be continued to investigate the feasibility of applying these identified measurement configurations for the local MC monitoring in the lamellas of
glu-1 INTRODUCTION
Today, more and more glulam structures are used in building and civil engineering due to new challenges imposed by sustainable development. However, the problem of durability is a limiting factor for the development of these structures [1]. Pathologies such as cracks, delaminations or slots, as well as fungal or insect attacks have been observed. The majority of them can be attributed either to excessive moisture content (MC) (> 22%) or to the wet-ting/drying cycles in the material [2]. In order to promote the use of wood in construction, in-frastructure supervisors have expressed their need on continuous monitoring techniques of wood MC.
A multitude number of techniques are reported to be able to measure the MC in wood [3,4]. However, a great number of them cannot respond to the constraints of continuous monitoring in engineering structures. According to our bibliographic research, two families of methods have the potential to be employed in long-term MC monitoring of glulam structures: the elec-trical methods (resistive/capacitive) [5,6] and the ultrasonic method [7].
Concerning the electrical methods, several studies have shown the possibilities of using different types of sensors for the continuous MC monitoring in wood [8]. With regard to the resistive method, it concerns the use of “pin-type electrodes” inserted in wood [5]. Regarding the capacitive method, it concerns the use of “surface electrodes” with two parallel metallic plates on the outer surfaces of wood [4].
Regarding the ultrasonic method, no studies exist in literature regarding sensors which can allow the continuous MC monitoring in wood. This might be explained by the fact that the conventional ultrasonic transducers are not compact enough to be permanently integrated in structures for long-term monitoring due to their size and cost [9]. Even though, referable in-formation exists concerning structural health monitoring (SHM) using piezoelectric sensors. There exist two families of piezoelectric film sensors which are capable to be integrated in structures with relative moderate costs: the PVDF (Polyvinylidene fluoride) which is a pie-zoelectric polymer film; the MFC (Macro-fiber composite) which is composite with piezoe-lectric fibers integrated in an epoxy matrix [10].
According to studies cited above, no existing solutions allow the internal and local MC monitoring in the lamellas of glulam, which is essential to improve the structure durability. Given the industrial fabrication process of glulam [11], the major constraints for sensor inte-gration are the small glue line thickness (0.3 mm) and the bonding pressure (10 bars).
In the light of these observations, we propose to transform the glulam into “smart material” by embedding MC monitoring systems in order to perform internal and local MC measure-ment in the lamellas. To achieve this, we have identified 4 measuremeasure-ment configurations for the electrical methods and 2 measurement configurations for the ultrasonic method. The ob-jectives of this study are: 1) to verify the feasibility of conducting electrical/ultrasonic meas-urements in wood using the proposed measurement configurations; 2) to verify the influence of bonding pressure on sensor performance; 3) to investigate the influence of sensor distance on measured physical quantities.
2 MATERIAL AND METHODS 2.1. Electrical measurements
2.1.1. Measurement configurations
Four measurement configurations using different electrode set-ups were identified in this study (Figure 1). The specimens were prepared with Douglas fir because it is extensively used
in construction. The Configuration 1 is a simple measurement configuration with stainless screws driven directly into the wood. However, loss of electrical contact between the elec-trodes and wood may arise due to the shrinkage and swelling of wood [5]. As a result, the Configuration 2 with conductive glue between the screws and wood was proposed to guaran-tee better electrical connection confronted with wood dimensional changes. It can also offer good repeatability for the measurements thanks to the mechanized drilling process and the precise dosage of glue. Furthermore, a similar configuration (Configuration 3) using directly the copper cables (stripped at the end) to conduct electrical measurement was also identified. At last, the Configuration 4 using copper patches (Ø50 mm, total thickness: 0.065 mm) was achieved because it is simple to realize in the glulam fabrication line and no additional ma-chining is required. Moreover, it allows conducting both the resistive and capacitive meas-urements [3].
Figure 1: Measurement configurations: a) Configuration 1; b) Configuration 2; c) Configuration 3; d) Configu-ration 4A; e) ConfiguConfigu-ration 4B
2.1.2. Measurement devices
The electrical resistances were measured with a Giga-Ohmmeter developed at laboratory for specimens of all configurations. On the other hand, the capacitive measurements were on-ly conducted on specimens of Configuration 4, with a LCR meter (GW INSTEK LCR-816). The frequency range of the LCR meter is from 100 Hz to 2 kHz. The frequency is fixed at 2 kHz in this study because according to James [12] who has realized the capacitive measure-ments at 4 different frequencies (0.2 kHz, 1kHz, 10 kHz, 100 kHz), the sensibility for MC monitoring increases with increasing frequency.
2.1.3. Investigation of the influence of bonding pressure and sensor distance
After the set-up of the sensors, solid wood specimens were prepared as described as fol-lows. For the Configurations 2 and 3, the rest void in the top holes was filled with polyure-thane glue used for glulam bonding. For the Configuration 4, a thin layer of polyurepolyure-thane glue
was applied on the patches to create electrical isolation and to prevent the patches from peel-ing off when moistenpeel-ing.
In order to investigate the influence of bonding pressure on sensor performance, glulam specimens were also prepared for each configuration. They were fabricated using a hydraulic press on setting the bonding pressure at 10 bars during 24 h. One more lamella (33 mm in thickness) was glued for the Configurations 1, 2 and 3 on the screwing/drilling side; two more lamellas (16.5 mm in thickness) were glued for the Configuration 4 on the two sides where patches were struck. In the end, it is important to point out that 5 identical specimens (for both solid wood and glulam specimens) were prepared for each configuration.
Furthermore, in order to verify the influence of sensor distance on MC measurements, specimens were prepared with two different electrode spacings (Figure 1).
2.2. Ultrasonic measurements
2.2.1. Tested piezoelectric film sensors and acquisition system
It was decided to test two families of piezoelectric film sensors: the PVDF and the MFC. As for the PVDF family, 3 models with different connection technologies and active areas were chosen: FLDT1, DT1-052K and DT2-052K (TE Connectivity Corporation). The former one has flexible leads while the latter two are connected to the cables by the penetrative eye-lets. The total thickness of the 3 models is 0.21 mm and the thickness of the active area is 52 µm. The active area of the FLDT1 and DT1-052K is 41×12 mm² and that of the DT2-052K is 73×12 mm². Regarding the MFC family, two models working on two different vibra-tion modes [13] were chosen: M4010 and M2814 (Smart Material Corporavibra-tion). The thick-ness of both models is 0.3 mm. The M4010 works on d33 effect and it has an active area of 40×10 mm² while the M2814 works on d31 effect and it has an active area of 28×14 mm². The d33 and d31 are respectively the longitudinal and transverse piezoelectric coefficients, which means that the direction of deformation are respectively parallel (d33 effect) or perpen-dicular (d31 effect) to the direction of electric field [13].
The acquisition system is presented in Figure 2. The ultrasonic signal is generated with the help of a waveform generator (Agilent 33120A). It is connected to an amplifier (Amplifier Research Model 75A250A) and then the emitting sensor. The received ultrasonic signal is firstly amplified by a preamplifier at 40 dB (Sofranel 5660B) and it then arrives at an oscillo-scope (Agilent DSO-X 2002A).
2.2.2. Sensibility characterization of piezoelectric film sensors
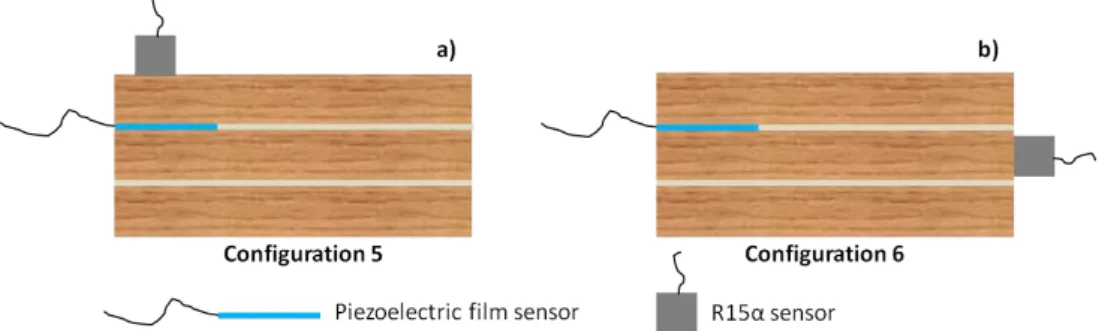
As a first step, all the sensors were tested in 2 measurement configurations as presented in Figure 3. In the Configuration 5 (Transmission in the lamella), the propagation of waves through the thickness of one lamella is studied; in the Configuration 6 (Transmission at inter-face) the propagation of waves in the fiber direction of wood is analyzed. 3 Douglas fir planks of 500×90×33 mm3 (Longitudinal (L)*Tangential (T)*Radial(R)) were used in this study. A 10-bar pressure was assured by a clamping equipment based on screw-assembly principle (Figure 4). A conventional piezoelectric sensor (R15α, MISTRAS Group) was also used in this study. It was selected because it presents good sensitivity in the range from 50 kHz to 400 kHz with a resonant frequency at 150 kHz. Firstly, tests of sweep frequency were carried out using R15α as emitter and a piezoelectric film sensor as receiver in the frequency range from 50 kHz to 400 kHz. Secondly, tests were conducted in the same condition but with the piezoelectric film as emitter and with the R15α as receiver. For these tests, modulated har-monic signals were used in order to make sure that the sensors generate and respond to acous-tic waves with frequencies corresponding to the excitation electrical signals. The RMS (root mean square) amplitude was used to compare the performance of each sensor.
Figure 3: Measurement configurations of ultrasonic method: a) Configuration 5: Transmission in the lamella; b) Configuration 6: Transmission at interface
Figure 4: Clamping equipment for the ultrasonic measurements 2.2.3. Investigation of the optimal frequency
Following the first step, the piezoelectric film sensor presenting the best performance was tested in the 2 measurement configurations (Figure 5) in order to investigate the optimal fre-quency when two piezoelectric film sensors were used. Tests of sweep frefre-quency were con-ducted with modulated harmonic signals in the frequency range from 50 kHz to 400 kHz. The RMS amplitude was used as an indicator of sensor performance. Once the optimal frequency was determined, test was then realized with impulse signal in order to calculate the ultrasonic propagation velocity using the equation below:
where V is the ultrasonic velocity (m/s), D is the propagation distance (m) and t is the TOF (time of flight) (s).
The impulse signal was used in order to have a clear separation of emitting and receiving signals.
Figure 5: Test with 2 piezoelectric film sensors: a) Transmission in the lamella; b) Transmission at interface 2.2.4. Investigation of the influence of bonding pressure and sensor distance
In order to investigate the influence of bonding pressure on sensor performance, test was realized with experimental set-ups determined in previous step but without exerting extra pressure.
Furthermore, tests were conducted in order to investigate the influence of sensor distance. Regarding the in-situ monitoring of glulam structures, since the lamella thickness is standard-ized, it is only possible to position sensors with different distances in the length direction. As a result, there is no need to conduct this test for the Configuration 5. Regarding the Configura-tion 6, tests were realized by approaching two piezoelectric film sensors 50 mm each time un-til the distance left between sensors is comparable to the sensor dimension (50 mm in length).
3 RESULTS AND DISCUSSION
3.1. Electrical measurements
3.1.1. Feasibility of electrical measurements in wood
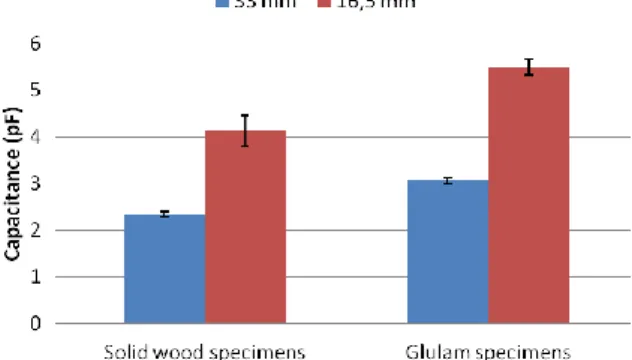
The implementation of different measurement configurations was firstly achieved on solid wood specimens. The measurements at initial state (10% in MC) on these specimens have shown the possibility to realize the electrical measurements in wood. As for the resistive measurements, it was found that electrical resistance is in the order of 109 Ω for the Configu-rations 1, 2 and 3 and 1010 Ω for the Configuration 4 (Figure 6). These values are in the same order of magnitude with information available in literature [14,15]. The different values ob-tained can be attributed to the different shapes of the electrodes (Configurations 1, 2 and 3: pin-type electrodes; Configuration 4: surface electrodes) and also to the fact that measure-ments were conducted in different wood orthotropic directions (Configurations 1, 2 and 3: Longitudinal direction; Configuration 4: Tangential direction) [3]. Regarding the capacitive measurements, the values of capacitance measured (Figure 7) were also in the same order of magnitude with information available in literature using similar frequency [16]. In our study, the capacitance measured on the 33 mm thick specimen is 3.1 pF on average while it is 5.0 pF by extrapolating the results of James at 1 kHz [16]. The difference can be explained by the different frequencies used since our results were measured at 2 kHz.
Figure 6: Comparison between results of electrical re-sistance measured on solid wood specimens and glulam specimens (Configurations 1, 2 and 3: sensor distance = 20 mm; Configuration 4: sensor distance = 16.5 mm)
Figure 7: Comparison between results of capacitance measured on solid wood specimens and glulam
speci-mens for Configuration 4
3.1.2. Influence of bonding pressure
Regarding the Configurations 1, 2 and 3, no difference on electrical resistance was ob-served between solid wood and glulam specimens (Figure 6). It can be explained by the fact that the bonding pressure was not directly applied on the sensors so that the condition of elec-trical connection between the electrodes and wood was not changed by the pressure. As for the Configuration 4, the resistance was observed to be reduced by 5.2 times (calculated with resistance in Ω) on average (Figure 6) and the capacitance was observed to have increased by 1.3 times on average (Figure 7). These observations can be attributed to the fact that the effec-tive contact area between wood and sensors has increased due to the application of the bond-ing pressure, leadbond-ing to a lower resistance [17] and higher capacitance measured [18].
3.1.3. Influence of distance between sensors
Regarding the resistive measurements, no difference was observed on resistance meas-ured using sensors of different spacings. For the Configurations 1, 2 and 3 (Figure 8), this observation was also made by other authors and can be explained by the fact that the contact resistance associated with wood/electrode interface contributes to the majority of the total resistance measured so that the distance between electrodes does not influence the resistance measured in the case of pin-type electrodes [3].
Figure 8: Comparison between results of electrical re-sistance measured with different sensor distances
(Glu-lam specimens)
Concerning the Configuration 4 (Figure 9), this observation can be related to the surface roughness which can cause smaller effective contact area, leading to higher resistance meas-ured compared to the theory, i.e. the contact resistance [17]. As a result, in view of the small thickness of our specimens, we could not observe the influence of sensor distance.
On the other hand, it was observed that the capacitance measured on the 16.5 mm thick specimens is on average 1.8 times of that of the 33 mm thick specimens (Figure 10). This
ob-servation can be explained by the theoretical equation which shows that the material capaci-tance is doubled if the material thickness is halved [3]:
(2)
where C is the capacitance (F), ε0 is absolute permittivity of vacuum (≈ 8,854*10-12 F•m-1), εr is the dielectric constant which determines some kind of ability to store electrical charge, A is the area of the plates (m²) and d is the distance (m) between them.
Our results do not show an exact two-fold relationship. It can be related to the heterogenei-ty of wood material and can also be explained by the existence of contact capacitance associ-ated with wood/electrode interface [18].
Figure 9: Comparison between results of electrical re-sistance measured with different sensor distances
(Con-figuration 4)
Figure 10: Comparison between results of capacitance measured with different sensor distances (Configuration
4)
3.2. Ultrasonic measurements
3.2.1. Sensibility characterization of piezoelectric film sensors
The results of the sensibility characterization for the MFC M4010 and the PVDF FLDT1 are presented in Figure 11 and Figure 12. The results of the MFC M2814, PVDF DT1-052K and DT2-052K are not included in the figure because their responses are not sufficient enough to conduct ultrasonic measurement in wood. For the MFC M2814, the weaker response com-pared to the M4010 can be related to their different working modes: the d31 effect used by the M2814 is weaker than the d33 effect used by the M4010 [13]. The difference in responses among the PVDF sensors might be attributed to their different connection technologies. The metallic connection of DT1-052K and DT2-052K have penetrated the protective coating. As a result, the sensor response might have been influenced by the parasitic electromagnetic sig-nals in the environment captured by the exposed metallic connection. On the other hand, the connection of FLDT1 is non-penetrative (flexible circuit), thus the response is less affected by the parasitic electromagnetic signals.
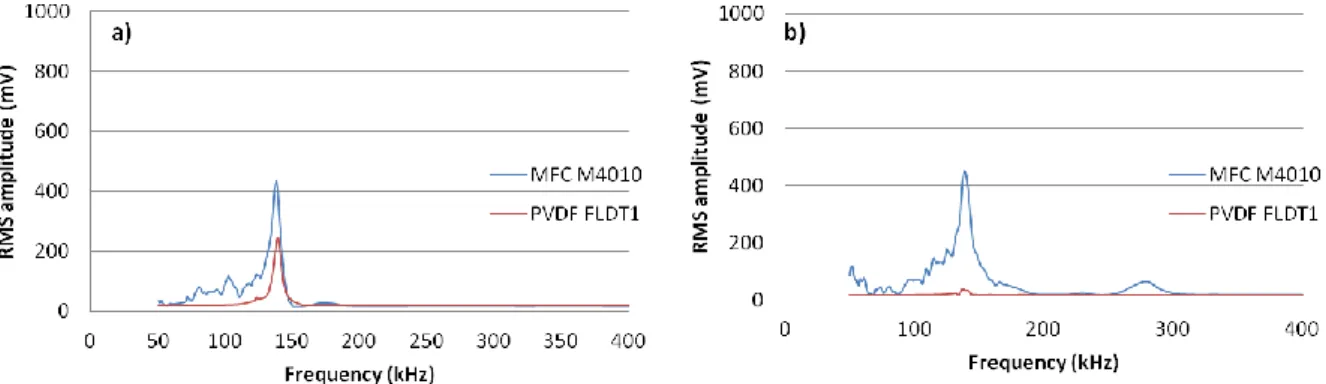
Figure 11: Sensitivity curves when piezoelectric film sensors are used as receiver: a) in Configura-tion 5(Transmission in the lamella); b) in ConfiguraConfigura-tion 6(Transmission at interface)
The Figure 11 shows the sensitivity curves when piezoelectric film sensors are used as re-ceiver (R15α is the emitter). It can be seen that MFC M4010 exhibits almost the same receiv-ing performance in the two measurement configurations while the PVDF FLDT1 functions only in transmission in the lamella (Configuration 5). The curves present maximum peaks at 150 kHz because it is the resonant frequency of the R15α sensor.
Figure 12: Sensitivity curves of when piezoelectric film sensors are used as emitter: a) in Configura-tion 5(Transmission in the lamella); b) in ConfiguraConfigura-tion 6(Transmission at interface)
The Figure 12 presents the sensitivity curves when piezoelectric film sensors are used as emitter (R15α is the receiver). It can be observed that the emitting performance of MFC M4010 is greater when it is used for transmission at interface (Figure 12b) than for transmis-sion in the lamella (Figure 12a). The PVDF FLDT1 works in transmistransmis-sion in the lamella (Figure 12a) but not in transmission at interface (Figure 12b). The curves present maximum peaks at 150 kHz because it is the resonant frequency of the R15α sensor.
It can be concluded that when conducting measurements in transmission at interface, MFC M4010 presents better performance both in emission (Figure 11b) and in reception (Figure 12b) than PVDF FLDT1 from 50 kHz to 400 kHz. When conducting measurements in trans-mission in the lamella, MFC M4010 exhibits better performance in reception than PVDF FLDT1 from 50 kHz to 400 kHz (Figure 11a). Regarding the performance in emission, al-though the highest amplitude is obtained by PVDF FLDT1 at around 150 kHz (Figure 12a), the performance of MFC M4010 can still be considered better since its characteristic curve is more wideband in the range from 50 kHz to 400 kHz. As a result, in the following step, the test was realised with two MFC M4010 sensors.
3.2.2. Investigation of the optimal frequency
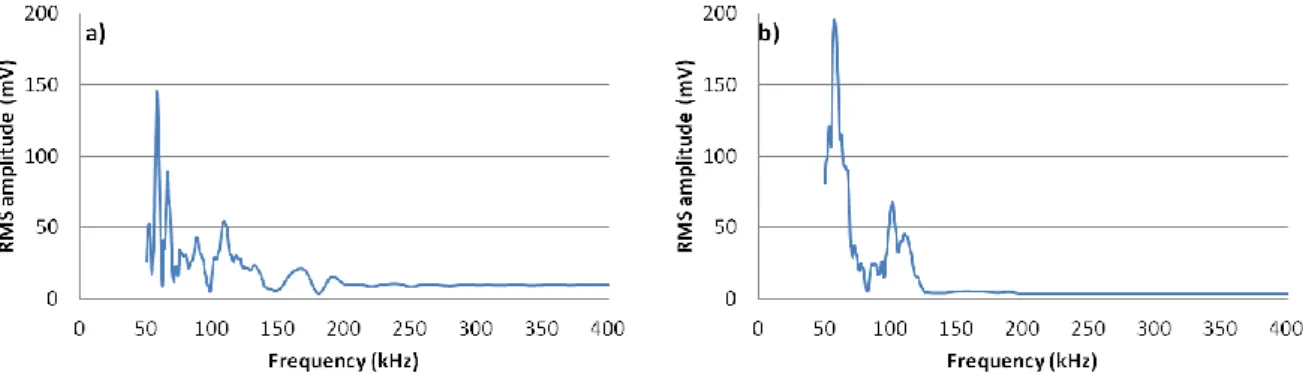
Following the previous step, frequency sweep test was conducted with 2 MFC M4010 sen-sors in both measurement configurations (Figure 5). The objective is to find out the optimal frequency when two MFC M4010 sensors are used. Results showed that the highest amplitude is obtained at 60 kHz for both configurations (Figure 13). Considering the fact that consider-able attenuation will happen when wood increases in MC [19], a better signal strength is de-sired to guarantee the feasibility of ultrasonic measurement in high MC. As a result, 60 kHz was used for the measurement of ultrasonic velocities in the following study in both meas-urement configurations.
Figure 13: Test of frequency sweep with 2 MFC M4010 sensors: a) in Configuration 5(Transmission in the la-mella); b) in Configuration 6(Transmission at interface)
3.2.3. Influence of bonding pressure
Tests were then conducted at 60 kHz with two MFC M4010 sensors using impulse signal to compare the sensor response with or without the pressure of 10 bars. It was found that the pressure can improve the facility of TOF measurement since the amplitude is increased. An example is given in Figure 14 which presents the result of Configuration 6. In the figure, the response without pressure is multiplied by 10. The explanation for this observation is that the pressure has improved the acoustic coupling between wood and sensors.
Figure 14: Comparison of results between measurement without extra pressure and with a pressure of 10 bars
Figure 15: Ultrasonic velocity measured with different sensor distances
3.2.4. Influence of distance between sensors
In order to investigate the influence of sensor distance, tests were realized in transmission at interface at 60 kHz with two MFC M4010 sensors by approaching them 50 mm each time. The results are presented in Figure 15. The velocities are in the same order of magnitude with information available in literature concerning the longitudinal velocity [19]. It can be ob-served that the ultrasonic velocity remains almost stable as a function of distance between sensors, except for the small distances (84 and 134 mm). This difference can be explained by the fact that at these distances (from center to center of sensors), the length of wood left be-tween sensors (44 and 94 mm) is comparable with the sensor dimension (50 mm in length). As a result, we could not have a clear separation of emitting and receiving signals, which is important for a precise measurement of ultrasonic velocity. As a result, it is better to not re-duce the sensor distance smaller than 184 mm in order to have a clear separation of emitting and receiving signals for a precise measurement of ultrasonic velocity.
4 CONCLUSIONS
In order to extend the service life of glulam structures, it is necessary to embed MC meas-urement systems in the lamellas because it is more precise and furthermore it can provide a link between the MC (or wetting/drying cycles) and the durability of the structures in order to inform the infrastructure supervisors as early as possible with the potential risk of damage so that appropriate maintenance operations can be made in advance. As a result, within this framework, 4 measurements configurations using electrical methods and 2 configurations us-ing ultrasonic method were tested in this study.
4.1. Electrical measurements
Results showed that it is possible to conduct electrical measurements in wood with the proposed configurations. On the other hand, it was found that when surface electrodes were used (Configuration 4), the glulam specimens exhibit lower electrical resistance and higher capacitance compared to the solid wood specimens. At last, with the decreasing sensor dis-tance, no influence was observed for the resistive measurements and the capacitance was found to have increased.
4.2. Ultrasonic measurements
The performance of 5 piezoelectric film sensors from 2 families (PVDF and MFC) was tested in this study in two measurement configurations. It turned out that the MFC M4010 presents the best performance in both emission and reception. The optimal frequency for the measurement of ultrasonic velocity using two M4010 sensors was found to be 60 kHz. On the other hand, the M4010 was observed to be able to resist the pressure of 10 bars, and in fact the signal amplitude can be improved thanks to the pressure. At last, measurements were con-ducted with different sensor distances and it turned out that the ultrasonic velocity remains almost stable except for distances comparable with the sensor length.
Future study should be continued to investigate the feasibility using the 4 electrical config-urations and the 2 ultrasonic configconfig-urations to monitor the MC variation in glulam specimens.
ACKNOWLEDGMENT
Special thanks should be addressed to Emannuel Laught for his contribution in developing the Giga-Ohmmeter and to Tommy Vilella and Frédéric Leroy for their help in experimenta-tion.
REFERENCES
[1] Kasal, B. 2013. “Assessment, Reinforcement and Monitoring of Timber Structures–COST FP1101”. Adv. Mater. Res., 778, Pp:1037–1040.
[2] Dietsch, P., Gamper, A., Merk, M., and Winter, S. 2014. “Monitoring Building Climate and Timber Moisture Gradient in Large-Span Timber Structures”. J. Civ. Struct. Health
Monit., 5(2), Pp:153–165.
[3] Skaar, C. 1988. Wood-Water Relations, Springer-Verlag, Berlin Heidelberg.
[4] Moron, C., Garcia-Fuentevilla, L., Garcia, A., and Moron, A. 2016. “Measurement of Moisture in Wood for Application in the Restoration of Old Buildings,” Sensors, 16(5), Pp: 697-705.
[5] Brischke, C., Rapp, A. O., and Bayerbach, R. 2008. “Measurement System for Long-Term Recording of Wood Moisture Content with Internal Conductively Glued Electrodes”. Build.
Environ., 43(10), Pp:1566–1574.
[6] Kabir, M. F., Daud, W. M., Khalid, K., and Sidek, H. a. A. 1998. “Dielectric and Ultra-sonic Properties of Rubber Wood. Effect of Moisture Content Grain Direction and Frequen-cy”. Holz Als Roh- Werkst., 56(4), Pp:223–227.
[7] Goncalves, R., and Leme da Costa, O. A. 2008. “Influence of Moisture Content on Longi-tudinal, Radial, and Tangential Ultrasonic Velocity for Two Brazilian Wood Species”. Wood
Fiber Sci., 40(4), Pp:580–586.
[8] Brischke, C., Rapp, A. O., Bayerbach, R., Morsing, N., Fynholm, P., and Welzbacher, C. R. 2008. “Monitoring The ‘material Climate’ of Wood to Predict the Potential for Decay: Re-sults from in Situ Measurements on Buildings”. Build. Environ., 43(10), Pp:1575–1582. [9] Raghavan, A., and Cesnik, C. E.. 2007. “Review of Guided-Wave Structural Health Mon-itoring”. Shock Vib. Dig., 39(2), Pp:91–116.
[10] Cai, J., Qiu, L., Yuan, S., Shi, L., Liu, P., and Liang, D. 2012. “Structural Health Moni-toring for Composite Materials”. In Composites and Their Applications. Edited by N. Hu, InTech, Croatia.
[11] AFNOR, 2013. “NF EN 14080, Timber structures - Glued laminated timber and glued solid timber - Requirements”.
[12] James, W. 1986. “The Interaction of Electrode Design and Moisture Gradients in Dielec-tric Measurements on Wood”. Wood Fiber Sci., 18(2), Pp:264–275.
[13] Kholkin, A. L., Pertsev, N. A., and Goltsev, A. V. 2008. “Piezoelectricity and Crystal Symmetry”. In Piezoelectric and Acoustic Materials for Transducer Applications, Edited by A. Safari and E.K. Akdogan, Springer US.
[14] Brown, J. ., Davidson, R. W., and Skaar, C. 1963. “Mechanism of Electrical Conduction in Wood”. For. Prod. J., 13(10), Pp:455–459.
[15] James, W. L. 1963. Electric Moisture Meters for Wood, Dept. of Agriculture, Forest Ser-vice, Forest Products Laboratory, Madison, Wisconsin.
[16] James, W. L. 1977. “Dielectric Behavior of Douglas-Fir at Various Combinations of Temperature, Frequency, and Moisture-Content”. For. Prod. J., 27(6), Pp:44–48.
[17] Holm, R. 1967. Electric Contacts - Theory and Application, Springer-Verlag, Berlin Heidelberg.
[18] Dervos, C. T., and Michaelides, J. M. 1998. “The Effect of Contact Capacitance on Cur-rent-Voltage Characteristics of Stationary Metal Contacts”. In 43rd IEEE Holm Conference
on Electrical Contacts. 20-22 October, Philadelphie, Pennsylvania, Pp:530–540.