Contents lists available atScienceDirect
Geoderma
journal homepage:www.elsevier.com/locate/geoderma
Sub-micrometer distribution of Fe oxides and organic matter in Podzol
horizons
J.-T. Cornelis
a,b,⁎, B. Delvaux
b, E. Van Ranst
c, P.G. Rouxhet
daUniversity of Liege, Gembloux Agro-Bio Tech, Water-Soil-Plant Exchanges, 5030 Gembloux, Belgium
bUniversité catholique de Louvain, Faculté des bioingénieurs, Earth and Life Institute– Soil Science, Croix du Sud L7.05.10, 1348 Louvain-la-Neuve, Belgium cGhent University, Department of Geology (WE13), Campus Sterre, Krijgslaan 281/S8, 9000 Gent, Belgium
dUniversité catholique de Louvain, Faculté des bioingénieurs, 1348 Louvain-la-Neuve, Belgium
A R T I C L E I N F O
Handling Editor: M. Vepraskas Keywords: Podzol Spodosol Organo-mineral associations Organic matter Fe oxides Soil micro-aggregation SEM XPS A B S T R A C T
The spatial distribution of soil constituents at the micrometer scale is of great importance to understand pro-cesses controlling the formation of micro-aggregates and the stabilization of organic carbon. Here, the spatial distribution of organic and mineral constituents in Podzol horizons is studied by concerted measurements of (i) the content of various forms of Fe, Al, Si and C determined by selective extraction in thefine earth fraction of soil (f < 2 mm); (ii) the elemental composition of the clay fraction (f < 2μm) with lateral resolution using scan-ning electron microscopy with energy-dispersive X-ray spectroscopy (SEM-EDS), and with surface selectivity using X-ray photoelectron spectroscopy (XPS); (iii) the specific surface area (SSA) of fine earth and clay fractions by krypton physisorption.
The SSA of thefine earth in illuvial horizons is predominantly due to finely divided Fe oxides, including goethite, characterized by an equivalent particle size of about 10 nm. Kaolinite platelets of about 2μm size account for a large volume proportion in the clay fraction but have a minor contribution to SSA. Fe oxides and organic matter (OM) are intimately associated. Heterogeneity at theμm scale is created by local variations in the relative amounts of kaolinite and Fe-OM associations. These two kinds of physical entities are in random mix-ture. Moreover, variation of C/Fe atomic ratios reveals sub-μm scale heterogeneity. The latter is due to variation in the relative proportion of organic compounds and Fe oxides, indicating that aggregation of nanoparticles, and not only mere adsorption or porefilling, plays a role in these associations. In this regard, our results highlight that OM associated with Fe protects Fe oxides against physical displacement and that part of this associated OM is oxidizable by NaOCl treatment. Thesefindings demonstrate that the concept of OM stabilization through association with Fe must be revisited when considering the sub-μm scale level because fine Fe oxide particles can be easily dispersed during oxidation of associated carbon. Combination of physical fractionation and micro-analysis (e.g. SEM-EDS, vibrational spectroscopy) offer promising perspectives to clarify the relationship be-tween chemical composition and sub-μm scale architecture, and to better understand soil processes.
1. Introduction
The traditional view of soil organic matter (SOM) has long focused on fractions separated after acid and alkaline extractions, and on the formation of large-molecular-sized and persistent“humic” substances. The limitations of this view and of related models on the fate of the organic inputs to soils were assessed byLehmann and Kleber (2015). The emergent view of a soil continuous model (SCM) focuses on the complexity of soil organic compounds and the dynamics of the inter-actions between chemical, physical and biological factors. Accordingly “models based on pools should be replaced with models based on organic
matter solubility and spatial architecture” (Lehmann and Kleber, 2015). The co-evolution of soil organic and mineral constituents con-tributes to the pool of organo-mineral associations (OMA) that partly control the formation of soil aggregates and, in turn, the dynamics of SOM (Six et al., 2002;Schmidt et al., 2011;Kleber et al., 2015). Both the SOM progressive decomposition and reactivity with mineral sur-faces in soil aggregates lead to organic molecules with variable stages in the process of mineralization depending on their accessibility to enzy-matic activity (Lehmann and Kleber, 2015). SOM is thus partitioned in a continuum, regarding both the nature and lability of its compounds. The more labile organic carbon is readily available for decomposition
https://doi.org/10.1016/j.geoderma.2018.02.043
Received 28 August 2017; Received in revised form 19 February 2018; Accepted 25 February 2018
⁎Corresponding author at: TERRA Research Centre - Water-Soil-Plant Exchanges Gembloux Agro-Bio Tech, University of Liege (ULiège), 5030 Gembloux, Belgium.
E-mail address:jtcornelis@uliege.be(J.-T. Cornelis).
0016-7061/ © 2018 Elsevier B.V. All rights reserved.
by microorganisms (Schmidt et al., 2011), while the most stable organic carbon is momentarily preserved from decomposition in a mineral-protected pool, i.e., organic matter associated with mineral constituents (Chenu and Plante, 2006;Mikutta et al., 2009). The progressive de-composition of large biopolymers into smaller molecules through oxi-dation enhances the reactivity of SOM and its association with metal ions and mineral surfaces. This process can lead to SOM encapsulation in aggregates and protection against the activity of decomposers (Lehmann and Kleber, 2015). The formation of inorganic pedogenic sub-products of mineral weathering together with the progressive de-composition of SOM determine the spatiotemporal evolution of organic carbon and its accessibility to micro-organisms (Oades, 1988; Marschner et al., 2008;von Lutzöw et al., 2008;Schmidt et al., 2011; Dungait et al., 2012;Marín-Spiotta et al., 2014;Basile-Doelsch et al., 2015).
Podzols often exhibit a thick organic mor-moder forest floor re-vealing a net accumulation of OM in the topsoil favoured by adverse physico-chemical conditions. Moreover, the quartz-rich nature of their parental material implies a small Acid Neutralizing Capacity (van Breemen et al., 1983). These features promote acidic conditions and poor biological activity. They further enhance the co-transfer of aqu-eous organic molecules and inorganic ions in the soil profile (Lundström et al., 2000;Sauer et al., 2007), as well as the formation of clay-sized short-range-order ferrihydrite and aluminosilicates (Farmer et al., 1980;Farmer, 1982). The importance of Fe oxide to form OMA is well documented. However, both their evolution during pedogenesis and the relationship between the patchy distribution of C at particle surfaces and Fe oxides have yet not been elucidated.
Since organic and inorganic constituents accumulate in illuvial podzolic subsoil horizons (De Coninck, 1980; Farmer et al., 1980; Farmer, 1982;Van Ranst et al., 1997;Buurman and Jongmans, 2005), podzolization is a model soil-forming process to study the sub-μm spatial distribution of OM and Fe oxides, and the influence of pedo-genesis on the stability of OMA. Here we assess the spatial distribution of elements (Si, Al, Fe, C) and relevant phases oxide to clarify how the spatial heterogeneity of the interactions between constituents affects the stability of OMA. The amounts of inorganic and organic constituents are determined by chemical analyses, following selective chemical ex-tractions. The identification of the clay-sized mineral phases of key samples by X-ray diffraction (XRD) and infrared spectroscopy (FTIR) was complemented by other advanced analytical techniques: (i) scan-ning electron microscopy with energy-dispersive X-ray spectroscopy (SEM-EDS) to focus on the spatial distribution of chemical elements; (ii) X-ray photoelectron spectroscopy (XPS) which provides a chemical analysis of thefirst nm below the surface exposed by the sample, and (iii) specific surface area determination using krypton physisorption which provides information in terms of equivalent particle size.
2. Materials and methods
2.1. Study site
The selected Podzol pedon belongs to a weathering soil sequence (Herbauts, 1982), located on the Lower Lias outcrop in Southeast Bel-gium (Belgian Lorraine). The altitude ranges between 300 and 350 m, the annual rainfall amounts to 1100 mm and the mean annual tem-perature is 7.7 °C (Herbauts, 1982). The bedrock is a calcareous sand-stone (Lower Lias age). The parent material consists of an auto-chthonous sandy layer, formed by the dissolution of the calcareous bedrock, overlaid by a mixture of this sandy material withfine quartz-rich loessic silt-sized particles (Herbauts, 1982). The sequence shows an increased Podzol development from Dystric Cambisol to Carbic Podzol (IUSS Working Group WRB, 2015). According to Herbauts (1982), podzolization is a current active process driven by the quartz-rich nature of parent material, acidic moder-mor litter under dominant beech, and humid climate. One of the traits is the fate of Al which is
involved in the chloritization of 2:1 phyllosilicates in OM-poor hor-izons, but in complexation with OM in OM-rich horizons (Herbauts, 1982). Palynological studies (Munaut, 1967) and 14C datation
(Herbauts, 1982) further show that the podzolization process started around 4500–5000 years ago (formation rate of E horizon ~0.08 mm/ yr), and that the mean residence time (years) of OC ranges between 95 ± 75 and 85 ± 75.
The Carbic Podzol represents the most advanced weathering stage in the sequence, and was selected for this study. The soil samples were collected in each horizon: AE–E (eluvial) – Bhs (enriched in humic acids and Fe oxides)– Bs (enriched in Fe oxides) – Bw (weakly colored; se-parated into Bw1 and Bw2)– BC (slightly weathered parent material). The samples were air-dried, then sieved (f < 2 mm) and homogenized.
2.2. Physico-chemical characterization of thefine earth fraction (f < 2 mm)
The particle size analysis was carried out by collecting quantita-tively the clay, silt and sand fractions. Sand fractions (f > 50μm) were collected by wet sieving after ultrasonication (w/v ratio 1:3, applied energy of 300 J·min−1;Balesdent et al., 1991) and OM oxidation in 6% H2O2. Silt and clay fractions were then separated through
sedimenta-tion after dispersion with Na hexametaphosphate. The pH was mea-sured in H2O (10 g:25 ml). Exchangeable cations were extracted by 1 M
CH3COONH4at pH 7 for Ca2+, Mg2+, K+, Na+and by 1 M KCl for H+
and Al3+. The sum of these cations is the effective cation exchange
capacity (ECEC). The specific surface area (SSA) was determined by krypton physisorption at liquid N2temperature (77 K) using a
Micro-meritics ASPA 2000 instrument (UCL-IMCN/MOST). Before the mea-surements, 100 mg of sample were outgassed at 120 °C overnight under vacuum (0.67 Pa). The Brunauer, Emmett and Teller (BET) equation (Brunauer et al., 1938) was used to determine the SSA from adsorption data in the range of 0.05 to 0.30 relative pressures.
The organic debris from thefine earth samples were removed by water flotation at density of 1.0 g·cm−3. Soil samples (~4 g) were
slurried in 40 ml of deionized water, shaken for 4 h, and centrifuged at 314g for 15 min. The supernatant was removed and the pellet was dried at 105 °C. The total carbon content (TOC) was measured on ground samples through dry combustion with a CNS analyzer (Flash EA 1112 Series). A subsample was treated with NaOCl as detailed byMikutta et al. (2006): 3 g of soil was reacted with 30 ml of 6 wt% NaOCl at pH 8 adjusted by adding 32% HCl; after 6 h of slow mixing at 21 ± 1 °C, the suspension was centrifuged (314g; 15 min) and the supernatant was removed; the extraction with NaOCl was repeated twice more. The NaOCl-treated samples were washedfive times with 20 ml deionized water, dried at 40 °C, weighted and submitted to carbon analysis. A portion was then extracted further with hydrofluoric acid (HF) in order to ensure dissolution of all the mineral constituents: 2 g of the dried NaOCl-treated sample was transferred into a pre-weighed centrifugal bottle and reacted with 20 ml 10% HF; after shaking for 2 h at 21 ± 1 °C, the suspension was centrifuged (314g; 15 min) and the su-pernatant was discarded; the extraction with HF was repeated three times more. The pellets were washedfive times with 20 ml deionized water, dried at 105 °C, weighted and submitted to carbon analysis. The carbon concentrations measured in the NaOCl and HF treated samples were converted into concentrations in the initial sample. This provides the contents of two categories of carbon: ROC, i.e. the content left in the residue after treatment with NaOCl and HF (tentatively considered as “recalcitrant carbon”), and MPOC, i.e. the result of subtracting ROC from the content measured after NaOCl treatment (tentatively attribu-table to“mineral-protected carbon”;Kleber et al., 2005;Mikutta et al., 2006). The distinction of these categories in TOC is motivated by the assumption that NaOCl treatment which mimics natural oxidative processes, does not dissolve pedogenic oxides and only slightly dis-solves Al from the short-range-order minerals (Lavkulich and Wiens, 1970;Siregar et al., 2005).
Fe, Al and Si were extracted from the soil samples using dark acid ammonium oxalate 0.2 M (o) and dithionite-citrate-bicarbonate (DCB) (d) (Dahlgren, 1994). Their concentrations in the extracts were mea-sured by inductively coupled plasma atomic emission spectrometry (ICP-AES; Thermo Jarrell Ash, IRIS Advantage). DCB-extracted Fe (Fed)
is considered to include crystalline and short-range-order Fe oxides (Mehra and Jackson, 1960), and organo-Fe complexes (Wada, 1989). Dark oxalate dissolves short-range-order minerals such as allophanic substances (Wada, 1989), ferrihydrite (Cornell and Schwertmann, 1996), and organo-metallic compounds (Dahlgren, 1994).
2.3. Physico-chemical characterization of the clay fraction (f < 2μm) 2.3.1. Separation and treatment
The clay fraction (< 2μm on the basis of a particle density of 2.65 g·cm−3) from E, Bhs, Bs, Bw1 and BC horizons was separated after dispersion with Na+-resin, without any chemical pretreatment
(Rouiller et al., 1972) in order to avoid surface contamination (Gerin et al., 2003). This method is very efficient to disperse micro-aggregated soils such as Ferralsols (Bartoli et al., 1991) and Andosols (Ndayiragije and Delvaux, 2003). Besides, in the absence of H2O2removal of OM, it
preserves organic compounds in their respective particle size fractions. 4 g of fine earth was sonicated in 100 ml of deionized water during 3 × 1 min (90 J per min; Balesdent et al., 1991). The suspension was then sieved at 50 mesh. The fraction retained on the sieve was re-sus-pended in deionized water and sonicated; then the process of sieving and re-suspension was performed three times more, which left a clear supernatant. The liquids collected by sieving were pooled, sonicated (w/v ratio 1:3, applied energy of 300 J·min−1;Balesdent et al., 1991), dispersed with Na+ resin through Na+ saturation (Rouiller et al.,
1972), and centrifuged at 11g for 3.5 min. The pellet was re-suspended in deionized water, sonicated and centrifuged. This operation was re-peated three or four times until the supernatant was clear. A mild so-nication was used to limit disturbance in the clay fraction; however the latter may originate from coatings of sand and silt fractions (Balesdent et al., 1991). The supernatants were pooled, centrifuged at 1968g for 10 min, andfinally re-suspended in methanol and incubated overnight in an oven at 105 °C, providing the clay fraction (< 2μm).
A subsample of the clay fraction of Bhs was treated with DCB (DCB-Bhs) to dissolve Fe oxides. Furthermore, a subsample of the clay frac-tion of Bhs and Bw1 horizons was oxidized using a treatment with NaOCl (6% at pH 8) as described above, with the aim to remove easily-oxidizable organic compounds.
2.3.2. Analytical methods
The bulk concentration of inorganic elements in the clay fractions was determined after calcination at 950 °C followed by borate fusion (Chao and Sanzolone, 1992). Briefly, a crushed sample of 150 mg of the ignition residue was melted at 1000 °C in a graphite crucible in the presence of 0.4 g Li-tetraborate and 1.6 g Li-metaborate. After the dis-solution of fusion beads in 10% HNO3 under magnetic agitation at
100 °C, elemental contents were determined by ICP-AES. The bulk concentration of each element is expressed as mole per kg of clay-sized material (dry weight at 105 °C), accounting for the weight loss due to calcination.
The surface analysis of the clay fractions was performed by X-ray photoelectron spectroscopy (XPS), using a SSX 100/206 photoelectron spectrometer from Surface Science Instruments (USA) equipped with a monochromatized micro-focused Al X-ray source (powered at 20 mA and 10 kV). The samples were pressed in a small stainless steel cylinder of 4 mm diameter and 0.5 mm depth and placed on an aluminium carousel. The pressure in the analysis chamber was about 10−6Pa. The angle between the perpendicular to the sample surface and the axis of the analyzer lens was 55°. The analyzed area was approximately 1.4 mm2and the pass energy was set at 150 eV for the survey scan and
50 eV for narrow scans. Under these conditions, the full width at half
maximum (FWHM) of the Au 4f7/2peak of a clean gold standard sample
was about 1.1 eV. Aflood gun set at 6 eV and a Ni grid placed 3 mm above the sample surface were used for charge stabilization. The fol-lowing sequence of spectra was recorded: survey spectrum, C 1s, O 1s, N 1s, Al 2p, Si 2p Fe 2p, Ca 2s, Mg KL23L23and C 1s again to check the
stability of sample charging with time. Data treatment was performed with the CasaXPS program (Casa Software Ltd., UK). The C 1s peak component due to carbon only bound to carbon and hydrogen wasfixed to 284.8 eV in order to set the binding energy scale. Molar fractions (percentage over all elements except hydrogen) were calculated using peak areas determined with a Shirley baseline and a normalization based on acquisition parameters and sensitivity factors provided by the manufacturer (mean free path varying according to the 0.7th power of the photoelectron kinetic energy; Scofield cross sections; transmission function assumed to be constant). The Fe concentration was determined from the Fe 2p3/2peak.
The SSA of the clay fractions was determined as described forfine earth samples. XRD analysis was performed on the clay fraction from Bhs and Bw1 horizons after removal of OM using H2O2. XRD patterns
were collected with a Bruker Advance diffractometer using CuKα ra-diation. FTIR spectra of the clay fraction from the E, Bh and Bs horizons were recorded with a IFS55 Equinox Fourier Transform infrared spec-trometer (Brücker) equipped with a DTGS detector, using 200 scans and a resolution of 1 cm−1. Disks of 13 mm diameter were pressed after mixing 5 mg sample with 200 mg KBr (Janssens Chimica, 99%), and drying at 150 °C to remove moisture. Spectra were also recorded on sample– KBr mixtures heated at 350 °C in order to check the evolution of the OH-stretching bands attributed to kaolinite.
Clay fractions from Bhs and Bw1 horizons were examined by scanning electron microscopy, combined with SEM-EDS to assess the micro-scale distribution of elements (Fe, Al, Si and C). This examination was also performed on the Bhs and Bw1 subsamples treated with NaOCl. Droplets of suspensions were dried on a Si wafer piece used as a support. The images were obtained on a FEG-SEM Zeiss Ultra55, with a beam energy of 5 keV, using the signal of secondary electrons. EDS analysis was performed with the same instrument equipped with a Bruker Quantax system (XFlash Silicon Drift Detector; the diameter of the volume analyzed is 0.5μm). For each sample of interest, the EDS analysis was performed on at least 3 different images with 3 spots per image.
3. Results
3.1. Properties of thefine earth fraction (f < 2 mm)
Table 1presents the particle size distribution, pHH2O, contents of
oxalate (o) and DCB (d) extractable Si, Al and Fe, ECEC, and SSA. This table also gives the contents of TOC and of the categories MPOC (re-ferring tentatively to“mineral-protected carbon”) and ROC (referring tentatively to“recalcitrant carbon”), keeping in mind that the physical meaning of such partitioning is quite relative (Lehmann and Kleber, 2015).
As expected, the evolution of Feo, Fed and organic carbon
con-centrations with depth shows a large accumulation in Bhs and Bs.
3.2. Properties of the clay fraction (f < 2μm)
XRD diagrams of non-oriented powders are presented in Fig. 1. Clay-sized kaolinite (0.712 nm), quartz (0.334 nm) and goethite (0.417 nm) occur in Bhs and Bw. The FTIR spectra (data not presented) show OHe stretching bands typical of kaolinite (two sharp peaks at 3620 and 3700 cm−1separated by a peak of about half their height; Rouxhet et al., 1977) with about the same intensity for the clay frac-tions of E, Bhs and Bs horizons.
The values of elemental contents (Si, Al, Fe) and SSA are given in Table 2. The Fe concentration is the largest in Bs whereas the Al
concentration increases with depth. The DCB-Bhs clay sample exhibits a very small Fe content, thereby confirming the efficiency of the DCB extraction. The SSA follows the same trend as the Fe concentration. Indeed, the largest SSA value occurs in Bs (80 m2·g−1), while the lowest one is measured in DCB-Bhs (9 m2·g−1).
Surface analysis by XPS provides carbon concentrations ranging from 29 to 41%. The C 1s peak shape does not differ markedly from that of adventitious organic contaminants always detected in XPS analysis of oxides (Landoulsi et al., 2016); consequently it did not provide sig-nificant information on the relative abundance of different functional groups in SOM. The oxygen concentration varies from 45 to 53%. The shape of the C 1s peak allows quantifying oxygen from organic com-pounds (Landoulsi et al., 2016). The concentration of oxygen from in-organic compounds deduced by difference accords with combinations of stoichiometries of SiO2, Al(OH)3, kaolinite [Al2Si2O5(OH)4], and
FeOOH, Fe(OH)3or organic complex of Fe(OH)2+, but does not provide
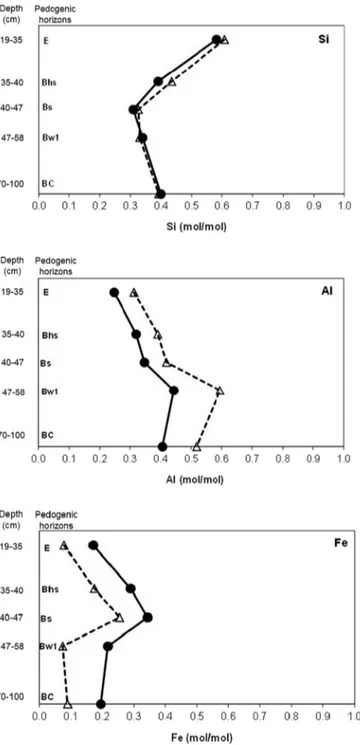
a significant information on their relative importance. The mole frac-tions of Si, Al and Fe with respect to the sum (Si + Al + Fe), as mea-sured by XPS, are given inTable 2. Their evolution through the pedon is presented inFig. 2 and compared with the respective mole fractions computed from the bulk composition.
Fig. 3illustrates the SEM micrographs as well as the peak intensities of C, Fe, Al and Si as measured by EDS in Bhs clay. The intensity of each of the C, Al, Si and Fe peaks recorded by EDS was measured in absolute values. Their conversion into molar ratios may not be performed owing to the multiphasic nature of the samples and the lack of adequate standards. Therefore, the absolute intensities are compared with each other, without any normalization, as presented inFig. 4. It is important to check that the apparent relationships illustrated in thisfigure do not result from anomalies generated by the influence of Fe on C, Al and Si
intensities. The possible influence of the presence of Fe on the intensity ratios C/Al and Si/Al is evaluated using data for spots characterized by large Fe peak intensity. The apparent molar ratios are computed using the computer software Esprit v1.9, considering the effective Fe intensity of 6700, on the one hand, and assuming it is zero, on the other hand. The deduced C/Al molar ratios are 0.48 and 0.53, respectively, while the Si/Al ratios are 0.93 and 0.97, respectively. The same calculation performed on another spot, considering the effective Fe intensity of 7532 and assuming it is zero, provides C/Al molar ratios of 0.83 and 1.02, respectively, and Si/Al ratios of 1.35 and 1.28, respectively. This demonstrates that the relationships between the intensity ratios and the
Table 1
Major physico-chemical characteristics of the Podzol horizons. Concentrations of elements are given in mmol·kg−1of soil dried at 105 °C. Horizon Depth Soil fractions pHH2O Sio Sid Alo Ald Feo Fed TOC MPOC
a ROCb ECECc SSA
Sand Silt Clay
cm Mass % mmol·kg−1 mmolc·kg−1 m2·g−1
AE 0–11 92.0 4.4 3.6 4.6 1.1 9.2 5.2 9.1 8.5 55.4 900.0 208.3 308.3 13 nd E 19–35 94.0 3.1 2.9 5.0 0.7 1.3 1.3 3.2 1.7 38.4 150.0 50.0 58.3 2 0.6 Bhs 35–40 89.0 7.0 4.0 4.7 2.2 10.1 47.5 76.4 82.0 298.8 1041.7 525.0 83.3 24 2.6 Bs 40–47 90.0 6.0 4.0 4.8 12.1 10.5 74.4 91.0 99.1 300.9 475.0 358.3 75.0 11 3.9 Bw1 47–58 91.6 3.4 5.0 5.1 17.7 13.7 80.1 78.0 11.9 122.5 400.0 166.7 58.3 4 2.4 Bw2 58–70 93.6 2.5 3.9 5.0 10.4 7.1 34.3 37.3 3.2 76.7 150.0 66.7 33.3 3 nd BC 70–100 92.9 2.5 4.6 5.1 7.1 5.0 24.1 26.8 1.5 51.0 91.7 50.0 8.3 2 1.5 o = oxalate-extractable Si, Fe and Al; d = DCB-extractable Si, Fe and Al; nd = not determined.
aMPOC: resistant to NaOCl and extracted by HF treatment. bROC: resistant to HF treatment.
cmmol
c·kg−1= millimoles of charge per kg soil.
10 20 30 40 Kaolinite Goethite K Q G G G KK Angle (°2θ) 2 10 20 30 40 Bhs Bw1
Fig. 1. X-ray diffraction (XRD) patterns of non-oriented samples from the clay fractions of the Bhs (black) and Bw1 (grey) horizons. Full names in black are the first order reflections of the main minerals. Letters are assignments of other peaks (G = goethite, K = kaolinite and Q = quartz).
Table 2
Bulk composition (mole·kg−1dried at 105 °C), specific surface area, and surface com-position (mole fraction in % with respect to the sum of the Si, Al and Fe concentrations) of the clay fractions.
Clay fraction
Bulk composition Surface composition Horizon Depth Si Al Fe SSA Si Al Fe
cm mole·kg−1 m2·g−1 %mol E 19–35 6.59 2.81 1.95 19 0.61 0.31 0.08 Bhs 35–40 3.52 2.88 2.60 30 0.43 0.39 0.17 Bs 40–47 3.18 3.57 3.52 80 0.33 0.42 0.25 Bw1 47–58 3.61 4.72 2.32 43 0.33 0.59 0.07 BC 70–100 5.06 5.17 2.48 39 0.39 0.52 0.09 DCB-Bhs* 35–40 5.90 3.61 0.18 9 0.56 0.44 0.00 DCB-Bhs: Dithionite-Citrate-Bicarbonate treated clay fraction of Bhs.
concentration ratios for C, Si and Al are not influenced by a variation of the Fe concentration. It is also important to check that the apparent relationships expressed inFig. 4do not result from any unwanted effect of the silicon wafer used as sample holder. The EDS analysis of three spots of a Si wafer used as sample substrate provides Si peak intensities of 152 × 103± 30 × 103, with peak intensities of C (1,274 ± 263), Fe (533 ± 230) and Al (836 ± 138) which are much smaller than the ones measured for the samples of interest as shown inFig. 4b and c. This indicates that the sample holder does not interfere appreciably with the samples.
SEM-EDS data reveal the presence of numerous plate-like particles (spot 2 inFig. 3a and spot 1 inFig. 3b), of about 2μm size, which are characterized by large and similar Si and Al peak intensities, as illu-strated in Fig. 3. These particles exhibit the typical morphology of
kaolinite, as evidenced by XRD and FTIR. Round shape particles (spot 1 inFig.3a) showing a large Si peak intensity and very small Fe and Al peak intensities are probably micro-grains of quartz. Sub-micrometer sized aggregates are observed with various concentrations of C, Fe, Al and Si.
Fig. 4plots the EDS Si, Fe, Al and C peak intensities against each other for the Bhs and Bw1 clay fractions both treated and not treated with NaOCl. For the sake of clarity, 8 spots out of 37 are excluded from all plots: (i) 6 spots are merely silica with intensity ratios Si/Al > 50 and Si peak intensities above 23,000 (2 spots for Bhs, 3 spots for NaOCl-treated Bhs, 1 spot for NaOCl-NaOCl-treated Bw1); and (ii) 2 spots are merely Fe oxide, with intensity ratios Fe/C > 10, Fe/Al > 4 and Fe in-tensities above 19,000 (1 spot for Bhs and 1 spot for Bw1). The corre-lations are positive between Si and Al signals (r = 0.87;Fig. 4a), ne-gative between Fe and Al signals (r =−0.86;Fig. 4c). The correlation between C and Fe signals is positive, but scattered (r = 0.73;Fig. 4b). Noteworthy is the fact that the Bhs clay fraction is characterized by more dispersed C/Fe intensity ratios and a wider range of C peak in-tensities (500 to 7000) than those observed in the Bw1 clay fraction (500 to 2000). The NaOCl treatment of Bw1 left a material showing negligible C intensities with some spots (not presented inFig. 4) con-stituted merely of either pure silica or pure Fe oxide. The NaOCl treatment of Bhs also reduced the range of C and Fe intensities but left spots with a significant value of these intensities.
4. Discussion
4.1. Correlations between data in thefine earth fraction (f < 2 mm) Correlation coefficients between the different variables collected for fine earth samples, except AE horizon (Table 1) were computed. The correlation coefficient between Feoand Fedis very large (r = 0.98). Yet
the proportion of Feowith respect to Fedcontent ranges between 2 and
15% in AE, E, Bw and BC horizons, but amounts to 27–33% in Bhs and Bs horizons. This means that the proportion of short-range-order Fe oxide is largest in the illuvial B horizons. The correlations between Fed
and, respectively, MPOC (r = +0.96) and TOC (r = +0.85) further illustrate the expected relationships between the accumulations of OM and Fe oxides (Fig. 5). The plot of MPOC against TOC (r = +0.96; not shown) shows evenly distributed data points and a linear regression equation MPOC = 0.53∗ TOC − 1.5. Moreover the variation of the MPOC/TOC ratio is small: standard deviation of 0.13 for an average value of 0.50. This indicates a lack of significant variation, throughout the profile, of the proportion of OM which would be protected from degradation through association with inorganic phases.
SSA is positively correlated with both oxalate- and DCB-extractable Al and Fe (0.85≤ r ≤ 0.97). The relationship between SSA and Fedis
shown inFig. 6a and will be discussed in the next section. These cor-relation coefficients are not significantly modified if Bhs fine earth is excluded from the set of samples. In contrast, correlations of SSA with TOC and MPOC (r = +0.53 and +0.72, respectively, for the whole set of samples) become much stronger (r = +0.88 and +0.96, respec-tively) if Bhs sample is excluded. This reveals that the association of OM with Fe oxides can impede the increase of the SSA controlled by Fe oxides. Such an observation would have been missed if concentrations had been expressed as mass fractions.
ECEC is correlated with Feo and Fed (r = 0.82 and 0.87,
respec-tively), and TOC and MPOC (r = 0.97). However the relationship be-tween ECEC and SSA deserves more attention. The mean value of the ECEC/SSA ratio amounts to 2.29μmolc·m−2in E, Bs, Bw1and BC, but to
9.23μmolc·m−2in Bhs. The latter value is much larger than the surface
charge density which is physically possible on a solid surface. For comparison, the surface charge density of smectite ranges between 1.1 and 2.2μmolec·m−2 (Shainberg et al., 1987) whereas the amount of
water in an adsorbed monolayer is 15.4μmole·m−2 (Rouxhet and
Brindley, 1966). Accordingly, a large proportion of OM accumulated in
Fig. 2. Evolution of Si, Al and Fe contents (mole fraction with respect to Si + Al + Fe) of clay fractions (solid line,●: bulk analysis; dashed line, △: X-ray photoelectron spec-troscopy analysis) in the Podzol profile.
Bhs may be viewed as a sponge, collapsed when dry but able to swell in water and to show a high cation-exchange capacity. This behaviour is typical of ion exchange resins and observed for oxidized carbonfibers (Pamula and Rouxhet, 2003).
These observations corroborate that the accumulation of Fe and OM are related with each other; the SSA is due to Fe oxides (Eusterhues et al., 2005a). The Bhs sample significantly differs from other samples regarding the relationship between OM, Fe oxides and interfacial properties. This must be considered with caution owing to the limited set of samples; however, this assessment will be further supported by SEM-EDS and XPS data.
4.2. Colloidal constituents: nature and distribution
The clay fractions contain goethite, kaolinite and quartz (Fig. 1), the latter two occurring as micrometric particles (Fig. 3). Plate-like parti-cles of about 2μm in size are kaolinite, which is responsible for the large Si/Fe and Al/Fe atomic ratios. The average Al/Si intensity ratio of about 1 (Fig. 4a) indicates that the intensity ratio, as measured by SEM-EDS, is close to the Al/Si atomic ratio attributed to kaolinite.
The soil depth variation of the relative concentrations of Si, Al and Fe in clay fractions follows the same trend for both the surface and bulk measurements, with a marked accumulation of Fe in Bhs and Bs hor-izons (Fig. 2), analogous to the soilfine earth (Table 1). The similarity of surface and bulk concentrations for Si and Al is consistent with a mere mixture of quartz and kaolinite particles. The systematically lower value of the surface relative Fe concentration [Fe / (Si + Al + Fe)] compared to the bulk concentration (Fig. 2) is attributed to the privi-leged association of OM with Fe-containing phases, in contrast with Si and Al-containing phases.
While the results indicate a mere mixture of quartz, kaolinite and Fe-rich particles, one may not infer the absence of coating of the former ones by the latter as a disturbance may have been provoked by dis-persion and drying involved in the clay fraction separation.
The SEM-EDS results show that the clay fraction separation provides distinct particles of aluminosilicates and entities in which iron and organic compounds are preferentially located. The latter are described as organans (Van Ranst et al., 1980). The removal of SOM by wet oxidation (NaOCl treatment) leads to a removal of Fe (Fig.4b) psumably in the form of suspended oxide nanoparticles. Yet the re-maining material containsμm-sized aggregates which are merely pure Fe oxides, presumably goethite. This observation is in contradiction with the idea that OM associated with Fe oxides is resistant against oxidation (Kleber et al., 2015) and with the assumption that MPOC represents that part of carbon which is protected through associations with minerals. While Fe-bearing phases protect OM from microorgan-isms (Eusterhues et al., 2005b;Kögel-Knabner et al., 2008;Eusterhues et al., 2014), our data further shows that OM protects Fe-bearing phases from dispersion and other forms of physical displacement.
Fig. 7plots SSA of thefine earth samples against SSA of the corre-sponding clay fractions. The regression equation gives a small intercept (0.29 m2·g−1), and a slope of 0.045 which is in the range of the soil clay
content (3 to 5%;Table 1). This is consistent with the fact that soil SSA is essentially due to clay-sized particles.Fig. 6a plots SSA against total Fe concentration of the clay fractions, including DCB-Bhs. Fe oxides thus play a major role in the development of SSA, as compared to aluminosilicates. According toFig. 6a, 1 mol of Fe accounts for a SSA in the range of 10,000 to 20,000 m2. The value of 10,000 m2is perfectly consistent with the relationship between SSA and Fedcontent in thefine
earth (Fig.6b). A surface area of 10,000 m2/mol Fe corresponds to 112 m2·g−1if Fe is in the form of FeOOH. Assuming that SSA is due to spherical particles of diameter d, relevant for amorphous particles, or needles with a square section of width w, relevant for goethite, the sizes are related to SSA as follows:
= ∗ ∗ − = ∗ ∗ −
d 6 (ρ SSA) 1or w 4 (ρ SSA) 1
where ρ is the particle density, assumed to be that of goethite 4.28 g·cm−3. Accordingly, the equivalent particle diameter or needle
Fig. 3. Scanning electron microscopy (SEM) micrographs of clay fractions from Bhs horizon with C, Fe, Al and Si peak intensities as measured by energy-dispersive X-ray spectroscopy (EDS) on spots 1, 2 and 3 in 2 images (a and b).
width would be 12 or 8 nm, respectively. Considering furthermore the possibility of 20,000 m2per mole Fe, the equivalent sizes of Fe oxide
particles range between 4 and 12 nm. This order of magnitude is not biased by assumptions regarding particle shape and stoichiometry, or by possible particle aggregation with pore formation.
The data concerning DCB-Bhs (Table 2) indicates that 1 mol of Al present in the clay fraction may account for a SSA of about 2500 m2,
which is much smaller compared to that associated with Fe. If this SSA is considered to be developed by the faces of platelets, the platelet thickness (t) is related to SSA by:
= ∗ ∗ −
t 2 (ρ SSA) .1
Considering the stoichiometry and density of kaolinite [Si2Al2O5(OH)4; 2.65 g·cm−3] provides a platelet thickness of 40 nm.
These calculations demonstrate that the main aluminosilicate particles are appreciably coarser than the Fe oxides, which is in agreement with SEM-EDS observations.
The incidence of OM on SSA requires attention, because of the cross correlations occurring between SSA, Fedand MPOC in thefine earth
samples. The interaction between OM and Fe oxides has stimulated much interest in relation to the accessibility of OM to microbial and enzymatic activities (Schmidt et al., 2011;Lehmann and Kleber, 2015). It has been reported that adsorption of natural OM by synthetic goethite (73 m2·g−1) decreases the specific surface area by pore filling (Kaiser and Guggenberger, 2007). In that study, the adsorption plateau was about 1.9 mg carbon/m2initial goethite, corresponding to a volume of
0.95 cm3OM/cm3 goethite, considering OM density of 1.4 g/cm3 (Mayer et al., 2004) and an carbon concentration of 441 mg∙g−1(Kaiser
and Guggenberger, 2007). Under these conditions, the specific surface area was reduced to 32 m2∙g−1 goethite. The ratio of micropore (< 2 nm) volume to goethite volume, equal to 0.189, accounted for a large proportion of the specific surface area and was reduced to 0.025 after adsorption; the ratio of mesopore (2–50 nm) volume to goethite volume was reduced from 0.071 to 0.008 as a result of adsorption. Note that the volume of adsorbed OM was much larger than the pore volume; as a matter of fact, SEM-EDS observations revealed the presence of voluminous aggregates of goethite and organic compounds.
Fig. 5shows the MPOC/Fed molar ratio of fine earth samples is
about 1.3; the molar ratio TOC/Fedis about twice more. Considering
the density and carbon concentration of OM reported byKaiser and Guggenberger (2007), a MPOC/Fedmolar ratio of 1.3 corresponds to an
OM/FeOOH volume ratio of 1.2. This is amazingly close to the volume ratio obtained by Kaiser and Guggenberger (2007) from laboratory experiments. However, the variation of the C/Fe ratio at the micro-meter scale, revealed by SEM-EDS for Bhs shows that OM/Fe oxide ratio has no straightforward physical meaning owing to the complex material
Fig. 4. Plots of peak intensities (arbitrary units) of Fe, Al, C and Si as measured by Scanning electron microscopy and Energy-dispersive X-ray spectroscopy (SEM-EDS) on the clay fractions of Bhs (●) and Bw1(▲) horizons, and on the respective NaOCl-treated clay fractions (Bhs =○; Bw1 = △). Measurements performed on the Si wafer are re-presented by a cross in (b) and (c).
0.0
0.2
0.4
0.6
0.8
1.0
1.2
0.0
0.1
0.2
0.3
0.4
OC ( mole/kg)
Fe
d(mole/kg)
TOC MPOCFig. 5. Plot of the organic carbon concentrations (○: TOC; △: MPOC) of the fine earth fraction against DCB-extractable Fe content (Fed).
architecture. Our observations, combined with laboratory experiments (Kaiser and Guggenberger, 2007) show that the formation of aggregates of Fe oxides with organic macromolecules or nanoparticles must be considered in addition to (i) the formation of a defined adsorbed or-ganic layer on an inoror-ganic surface and/or (ii) thefilling of the pores of an inorganic adsorbent.
Table 1andFigs. 6b and5indicate that the Bhsfine earth sample is characterized by a large TOC/Fedratio and a small SSA/Fedratio. This
explains that the correlation coefficients between SSA and TOC or MPOC increase if this sample is excluded, as mentioned above. The SEM-EDS examination of the clay fraction of Bhs (Figs. 3 and 4) reveals spots which are characterized not only by a low concentration of Al and Si but also by a large C/Fe ratio. The heterogeneity of the C/Fe con-centration ratio of Bhs clay fraction, and its relatively small SSA, may possibly be related to differences in the relative importance of different
forms of OM (molecules adsorbed on, molecules blocking pores of, nanoparticles aggregated with Fe oxide), confirming the interest of the unified model of OM-mineral interactions suggested byBasile-Doelsch et al. (2015).
Furthermore, the question may be raised whether the spatial dis-tribution of OM at the sub-micrometer scale, i.e. the material archi-tecture, is linked to a variation of OM chemical nature (Lehmann and Kleber, 2015). This question is important regarding the mechanisms of accumulation, the stability of OM, and even the color specificity of Bhs with respect to other horizons. It could be answered by extending this study to a larger set of samples, and other types of soils substantially affected by Fe chemistry, such as in Andosols, Gleysols, Ferralsols. Ni-tisols, Umbrisols and Cambisols, and in soils with one of the following qualifiers: spodic, andic, ferralic, nitic. Application of technical ad-vances in soil science can be very promising by focusing on spatial resolution, combining microscopic techniques and methods of physical fractionation according to both particle size and density. In this respect, vibrational spectroscopy (IR, Raman) applied to controlled fractions or in the microscope mode are most promising. Of particular interest is the evaluation of the relative concentrations of chemical functions, of the relative importance of sp2and sp3carbon hybridization, and of the size of aromatic sheets (Rouxhet et al., 1980; Abdallah and Yang, 2012; Parikh et al., 2014). Atomic force microscopy makes it possible to image physico-chemical properties, such as electrical properties and hydrophobicity, with nanoscale resolution (Alsteens et al., 2007). Nano secondary ion mass spectrometry (NanoSIMS) seems to be a powerful technique for studying the distribution of elements and chemical functions at nanoscale, with C and N isotope selectivity (Mueller et al., 2012). NanoSIMS analyses of soil incubated with litter have shown that the newly-incorporated OM is heterogeneously distributed, with pre-ferential retention by organo-mineral clusters with rough surfaces containing pre-existing OM (Vogel et al., 2014).
5. Conclusion
The SSA developed by the soil material of the illuvial horizons of the studied profile is mainly due to finely divided Fe oxides, predominantly goethite. The equivalent particle size of these Fe oxides is of the order of 10 nm. Kaolinite platelets of the order of 2μm account for a large vo-lume proportion in the clay fraction but have a minor contribution to the SSA.
The soil material can be visualized as quartz-rich sand grains coated E Bhs Bs Bw1 BC Bhsdi
0
10
20
30
40
50
60
70
80
90
0
1
2
3
4
SSA
(
m
²/g)
SSA
(
m
²/g)
Fe (mol/kg)
E
Bhs
Bs
Bw1
BC
0
1
2
3
4
5
6
0.0
0.1
0.2
0.3
0.4
Fe
d(mole/kg)
b
a
Fig. 6. (a) Plot of specific surface area (SSA) against the bulk Fe concentration, both in the clay fractions; (b) Plot of SSA against DCB-extractable Fe (Fed), both in thefine earth.
0
0.5
1
1.5
2
2.5
3
3.5
4
4.5
0
20
40
60
80
100
SS
A
of
t
h
e
s
oil
(m²/g)
SSA of the clay-sized fraction (m²/g)
y = 0.045x + 0.29 (R² = 0.75) E Bhs Bs Bw1 BC
Fig. 7. Relationship between the specific surface area (SSA) of the fine earth samples and their respective values in corresponding clay fractions.
by, or mixed with colloidal sub-μm particles. The latter are alumino-silicate minerals, mainly kaolinite, and entities in which Fe oxides and OM are intimately associated. A heterogeneity at theμm scale is created by the varying local proportion of kaolinite and“Fe-OM associations”, both making a random mixture after separation of the clay fraction. Moreover, the variation of the C/Fe concentration ratio reveals a sub-μm scale heterogeneity due to a variation of the proportion of organic compounds with respect to Fe oxides, indicating that the aggregation of nanoparticles plays a role in these organans.
This representation supports the picture of soil reactive micro-spots, or rather nanoscale sites, which result from and control further the fate of the soluble organo-mineral complexes according to physico-chemical conditions (Masiello et al., 2004;Schmidt et al., 2011;Torn et al., 2013; Basile-Doelsch et al., 2015). It highlights the importance of the archi-tecture of the associations between Fe oxides and OM, which involves aggregate formation and not only mere adsorption of organic com-pounds by inorganic phases or porefilling.
The SEM-EDS observations showed that particles below the μm range are differentiated according to a combination of size and specific gravity. Accordingly, refined physical fractionation and the use of ap-propriate micro- or nano-analytical techniques offer promising per-spectives to clarify the relationship between chemical composition (inorganic and organic compounds, organic chemical functions) and sub-μm scale architecture, which is a key to better understand the dy-namic processes occurring through the soil profile. (Lehmann and Kleber, 2015). Soil and environmental science may benefit from latest progresses headed by material science and biophysics, particularly from the characterization of chemical composition and physico-chemical properties with nanoscale resolution.
Acknowledgements
The authors acknowledge A. Iserentant, C. Givron, A. Lannoye, H. Titeux, I. Caignet, M. Genet, L. Ryelandts, M. Jacquemin and E. Gaigneaux (UCL) forfield and laboratory assistance, and Prof. Em. J. Herbauts for his assistance and clever advices. J-T.Cornelis. was sup-ported by “Fonds National de la Recherche Scientifique” of Belgium (FNRS; Postdoctoral Researcher Grant).
References
Abdallah, W.A., Yang, Y., 2012. Raman spectrum of asphaltene. Energy Fuel 26, 6888–6896.
Alsteens, D., Dague, E., Rouxhet, P.G., Baulard, A.R., Dufrêne, Y.F., 2007. Direct mea-surement of hydrophobic forces on cell surfaces using AFM. Langmuir 23, 11977–11979.
Balesdent, J., Pétraud, J.-P., Feller, C., 1991. Effets des ultrasons sur la distribution granulométrique des matières organiques des sols. Science du Sol 29, 95–106.
Bartoli, F., Burtin, G., Herbillon, A.J., 1991. Disaggregation and clay dispersion of oxisols: Na resin, a recommended methodology. Geoderma 49, 301–317.
Basile-Doelsch, I., Balesdent, J., Rose, J., 2015. Are interactions between organic com-pounds and nanoscale weathering minerals the key drivers of carbon storage in soils? Environ. Sci. Technol. 49, 3997–3998.
Brunauer, S., Emmet, P.H., Teller, E., 1938. Adsorption of gases in mulimolecular layers. J. Am. Chem. Soc. 60, 309–319.
Buurman, P., Jongmans, A.G., 2005. Podzolisation and soil organic matter dynamics. Geoderma 125, 71–83.
Chao, T.T., Sanzolone, R.F., 1992. Decomposition techniques. J. Geochem. Explor. 44, 65–106.
Chenu, C., Plante, A.F., 2006. Clay-sized organo-mineral complexes in a cultivation chronosequence: revisiting the concept of the‘primary organo-mineral complex’. Eur. J. Soil Sci. 57, 596–607.
Cornell, R.M., Schwertmann, U., 1996. The Iron Oxides: Structure, Properties, Reactions, Occurence and Uses. Weinheim, VCH.
Dahlgren, R.A., 1994. Quantification of allophane and imogolite. In: Zelazny, L.W., Amonette, J.E. (Eds.), Quantitative Methods in Soil Mineralogy. Soil Science Society of America, Madison, pp. 430–451.
De Coninck, F., 1980. Major mechanisms in formation of spodic horizons. Geoderma 24, 101–128.
Dungait, J., Hopkins, D., Gregory, A., Whitmore, A., 2012. Soil organic matter turnover is governed by accessibility not recalcitrance. Glob. Chang. Biol. 18, 1781–1796.
Eusterhues, K., Rumpel, C., Kögel-Knabner, I., 2005a. Organo-mineral associations in sandy acid forest soils: importance of specific surface area, iron oxides and
micropores. Eur. J. Soil Sci. 56, 753–763.
Eusterhues, K., Rumpel, C., Kögel-Knabner, I., 2005b. Stabilization of soil organic matter isolated via oxidative degradation. Org. Geochem. 36, 1567–1575.
Eusterhues, K., Neidhardt, J., Hädrich, A., Küsel, K., Totsche, K.U., 2014. Biodegradation of ferrihydrite-associated organic matter. Biogeochemistry 119, 45–50.
Farmer, V.C., 1982. Significance of the presence of allophane and imogolite in podzol Bs horizons for podzolization mechanisms: a review. Soil Sci. Plant Nutr. 28 (4), 571–578.
Farmer, V.C., Russel, J.D., Berrow, M.L., 1980. Imogolite and proto- imogolite allophane in spodic horizons: evidence for a mobile aluminum silicate complex in podzol for-mation. J. Soil Sci. 31, 673–684.
Gerin, P.A., Genet, M.J., Herbillon, A.J., Delvaux, B., 2003. Surface analysis of soil ma-terial by X-ray photoelectron spectroscopy. Eur. J. Soil Sci. 54, 589–604.
Herbauts, J., 1982. Chemical and mineralogical properties of sandy and loamy–sandy ochreous brown earths in relation to incipient podzolization in a brown earth–podzol evolutive sequence. J. Soil Sci. 33, 743–762.
IUSS Working Group WRB, 2015. World Reference Base for Soil Resources 2014, Update 2015. International Soil Classification System for Naming Soils and Creating Legends for Soil Maps. World Soil Resources Reports No. 106. FAO, Rome.
Kaiser, K., Guggenberger, G., 2007. Sorptive stabilization of organic matter by micro-porous goethite: sorption into small pores vs surface complexation. Eur. J. Soil Sci. 58, 45–59.
Kleber, M., Mikutta, R., Torn, M.S., Jahn, R., 2005. Poorly crystalline mineral phases protect organic matter in acid subsoil horizons. Eur. J. Soil Sci. 56, 717–725.
Kleber, M., Eusterhues, K., Keiluweit, M., Mikutta, C., Mikutta, R., Nico, P.S., 2015. Mineral-organic associations: formation, properties, and relevance in soil environ-ments. Adv. Agron. 130 (chapter one).
Kögel-Knabner, I., Ekschmitt, K., Flessa, H., Guggenberger, G., Matzner, E., Marschner, B., von Lützow, M., 2008. An integrative approach of organic matter stabilization in temperate soils: linking chemistry, physics, and biology. J. Plant Nutr. Soil Sci. 171, 5–13.
Landoulsi, J., Genet, M.J., Yetioman, Y.S., Fleith, S., Liascukiene, I., Mehivier, C., Rouxhet, P.G., 2016. Organic adlayer on inorganic materials: coping with con-tamination. Appl. Surf. Sci. 383, 71–83.
Lavkulich, L.M., Wiens, J.H., 1970. Comparison of organic matter destruction by hy-drogen peroxide and sodium hypochlorite and its effects on selected mineral con-stituents. Soil Sci. Soc. Am. J. 34, 755–758.
Lehmann, J., Kleber, M., 2015. The contentious nature of soil organic matter. Nature 528, 60–68.
Lundström, U.S., van Breemen, N., Bain, D., 2000. The podzolization process. A review. Geoderma 94, 91–107.
Marín-Spiotta, E., Gruley, K.E., Crawford, J., Atkinson, E.A., Miesel, J.R., Greene, S., Cardona-Correa, C., Spencer, R.G.M., 2014. Paradigm shifts in soil organic matter research affect aquatic carbon turnover interpretations: transcending disciplinary and ecosystem boundaries. Biogeochemistry 117, 279–297.
Marschner, B., Brodowski, S., Dreves, A., et al., 2008. How relevant is recalcitrance for the stabilizatioin of organic matter in soils? J. Plant Nutr. Soil Sci. 171, 91–110.
Masiello, C.A., Chadwick, O.A., Southon, J., Torn, M.S., Harden, J.W., 2004. Weathering controls on mechanisms of carbon storage in grassland soils. Glob. Biogeochem. Cycles 18.
Mayer, L.M., Schick, L.L., Hardy, K., Wagai, R., McCarthy, J., 2004. Organic matter content of small mesopores in sediments and soils. Geochim. Cosmochim. Acta 68, 3863–3872.
Mehra, O.P., Jackson, M.L., 1960. Iron oxides removal from soils and clays by dithioni-te–citrate system buffered with sodium bicarbonate. In: Clays and Clay Minerals: Proc. 7th. Pergamon Press, London, pp. 317–327.
Mikutta, R., Kleber, M., Torn, M.S., Jahn, R., 2006. Stabilization of soil organic matter: association with minerals or chemical recalcitrance? Biogeochemistry 77, 25–56.
Mikutta, R., Schaumann, G.E., Gildemeister, D., Bonneville, S., Kramer, M.G., Chorover, J., Chadwick, O.A., Guggenberger, G., 2009. Biogeochemistry of mineralorganic as-sociations across a long-term mineralogical soil gradient (0.3–4100 kyr), Hawaiian Islands. Geochim. Cosmochim. Acta 73, 2034–2060.
Mueller, C.W., Kölbl, A., Hoeschen, C., Hillion, F., Heister, K., Herrmann, A.M., Kögel-knabner, I., 2012. Submicron scale imaging of soil organic matter dynamics using NanoSIMS– from single particles to intact aggregates. Org. Geochem. 42, 1476–1488.
Munaut, A.-V., 1967. Recherches paleoecologiques en Basse et Moyenne Belgique. Acta Geogr. Lovan. 6, 191.
Ndayiragije, S., Delvaux, B., 2003. Coexistence of allophane, gibbsite, kaolinite and hy-droxy interlayered smectite in a perhydrated Andosol. Geoderma 117 (3–4), 203–214.
Oades, J.M., 1988. The retention of organic matter in soils. Biogeochemistry 5, 35–70.
Pamula, E., Rouxhet, P.G., 2003. Bulk and surface chemical functionalities of type III PAN based carbonfibres. Carbon 41, 1905–1915.
Parikh, S.J., Goyne, K.W., Margenot, A.J., Mukome, F.N.D., Calderón, F.J., 2014. Soil chemical insights provided through vibrational spectroscopy. Adv. Agron. 126, 1–148.
Rouiller, J., Burtin, G., Souchier, B., 1972. La dispersion des sols dans l'analyse granulométrique. Méthode utilisant les résines échangeuses d'ions. ENSAIA Nancy 14, 194–205.
Rouxhet, P.G., Brindley, G.W., 1966. Experimental studies offine-grained micas II. The water content of wet-ground micas. Clay Miner. 6, 219–228.
Rouxhet, P.G., Samudacheata, Ngo, Jacobs, H., Anton, O., 1977. Attribution of the OH stretching bands of kaolinite. Clay Miner. 12, 171–179.
Rouxhet, P.G., Robin, P.L., Nicaise, G., 1980. Characterization of kerogens and study of their evolution by infrared spectroscopy. In: Durand, B. (Ed.), Kerogen. Technip, Paris, pp. 163–190 (Ch. 6).
Sauer, D., Sponagel, H., Sommer, M., Giani, L., Jahn, R., Stahr, K., 2007. Podzol: soil of the year 2007 - a review on its genesis, occurrence, and functions. J. Plant Nutr. Soil Sci. 170, 581–597.
Schmidt, M.W.I., Torn, M.S., Abiven, S., et al., 2011. Persistence of soil organic matter as an ecosystem property. Nature 478, 49–56.
Shainberg, I., Alperovitch, N.I., Keren, R., 1987. Charge density and Na-K-Ca exchange on smectites. Clay Clay Miner. 35 (1), 68–73.
Siregar, A., Kleber, M., Mikutta, R., Jahn, R., 2005. Effect of sodium hypochlorite oxi-dation on soils containing poorly crystalline mineral phases. Eur. J. Soil Sci. 56, 481–490.
Six, J., Conant, R.T., Paul, E.A., Paustian, K., 2002. Stabilization mechanisms of soil or-ganic matter: implications for C-saturation of soils. Plant Soil 241, 155–176.
Torn, M.S., Kleber, M., Zavaleta, E.S., Zhu, B., Field, C.B., Trumbore, S.E., 2013. A dual isotope approach to isolate soil carbon pools of different turnover times. Biogeosciences 10, 8067–8081.
Van Breemen, N., Mulder, J., Driscoll, C.T., 1983. Acidification and alkalinization of soils.
Plant Soil 75, 283–308.
Van Ranst, E., Righi, D., De Coninck, F., Robin, A.M., Jamagne, M., 1980. Morphology, composition and genesis of argilans and organans in soils. J. Microsc. 120, 353–361.
Van Ranst, E., Stoops, G., Gallez, A., Vandenberghe, R.E., 1997. Properties, some criteria of classification and genesis of upland forest Podzols in Rwanda. Geoderma 76, 263–283.
Vogel, C., Müller, C.W., Höschen, C., Buegger, F., Heister, K., Schulz, S., Schloter, M., Kögel-Knabner, I., 2014. Submicron structures provide preferential spots for carbon and nitrogen sequestration in soils. Nat. Commun. 5.
von Lutzöw, M., Kögel-Knabner, I., Ludwig, B., Matzner, E., Flessa, H., Ekschmitt, K., Guggenberger, G., Marschner, B., Kalbitz, K., 2008. Stabilization mechanisms of or-ganic matter in four temperate soils: development and application of a conceptual model. J. Plant Nutr. Soil Sci. 171, 111–124.
Wada, K., 1989. Allophane and imogolite. In: Dixon, J.B., Weed, S.B. (Eds.), Minerals In Soil Environments, 2nd Edition. SSSA Book Series N°1, Madison, Wisconsin, pp. 1051–1087.