C
HAPTER
1
Controlled Substances and Other Source Gases
Lead Authors: S.A. Montzka P.J. Fraser Coauthors: J.H. Butler P.S. Connell D.M. Cunnold J.S. Daniel R.G. Derwent S. Lal A. McCulloch D.E. Oram C.E. Reeves E. Sanhueza L.P. Steele G.J.M. Velders R.F. Weiss R.J. Zander Contributors: S.O. Andersen J. Anderson D.R. Blake M.P. Chipperfield E. Dlugokencky J.W. Elkins A. Engel D. Harper E. Mahieu K. Pfeilsticker J.-P. Pommereau J.M. Russell III G. Taylor M. Van Roozendael D.W. WaughCONTROLLED SUBSTANCES AND OTHER SOURCE GASES Contents
SCIENTIFIC SUMMARY . . . 1.1 1.1 INTRODUCTION . . . 1.5 1.2 HALOGENATED OZONE-DEPLETING GASES IN THE ATMOSPHERE . . . 1.5 1.2.1 Updated Atmospheric Observations of Ozone-Depleting Gases . . . 1.5 1.2.1.1 Chlorofluorocarbons (CFCs) . . . 1.5 1.2.1.2 Halons . . . 1.9 1.2.1.3 Carbon Tetrachloride (CCl4) . . . 1.9 1.2.1.4 Methyl Chloroform (CH3CCl3) . . . 1.11 1.2.1.5 Hydrochlorofluorocarbons (HCFCs) . . . 1.11 1.2.1.6 Methyl Bromide (CH3Br) . . . 1.13 1.2.1.7 Methyl Chloride (CH3Cl) . . . 1.13
1.2.2 Twentieth Century Atmospheric Histories for Halocarbons from Firn Air . . . 1.13 1.2.3 Total Atmospheric Chlorine . . . 1.14 1.2.3.1 Total Organic Chlorine in the Troposphere . . . 1.14 1.2.3.2 Total Inorganic Chlorine in the Stratosphere . . . 1.15 1.2.3.3 Hydrogen Chloride (HCl) at 55 km Altitude in the Stratosphere . . . 1.15 1.2.3.4 Stratospheric Chlorine Compared with Tropospheric Chlorine . . . 1.15 1.2.4 Total Atmospheric Bromine . . . 1.16 1.2.4.1 Total Organic Bromine in the Troposphere . . . 1.16 1.2.4.2 Total Inorganic Bromine in the Stratosphere . . . 1.17 1.2.4.3 Stratospheric Bromine Compared with Tropospheric Bromine . . . 1.18 1.2.5 Effective Equivalent Chlorine and Effective Equivalent Stratospheric Chlorine . . . 1.18 1.2.6 Fluorine in the Stratosphere . . . 1.19 1.3 HALOCARBON SOURCES ESTIMATED FROM INDUSTRIAL PRODUCTION . . . 1.19 1.3.1 CFCs and HCFCs . . . 1.21 1.3.2 Halons . . . .1.21 1.3.3 Carbon Tetrachloride (CCl4) . . . 1.21
1.3.4 Methyl Chloroform (CH3CCl3) . . . 1.21
1.4 HALOCARBON LIFETIMES, OZONE DEPLETION POTENTIALS, AND GLOBAL
WARMING POTENTIALS . . . 1.21 1.4.1 Introduction . . . 1.21 1.4.2 Lifetimes . . . 1.22 1.4.3 Fractional Release Factors . . . 1.27 1.4.4 Ozone Depletion Potential . . . 1.28 1.4.5 Global Warming Potential . . . 1.31 1.4.5.1 Radiative Forcing Updates . . . 1.31 1.4.5.2 Direct Global Warming Potentials . . . 1.34 1.4.5.3 Net Global Warming Potentials . . . 1.34 1.4.6 Hydroxyl Radical Changes with Time . . . 1.34 1.4.7 Other Sinks . . . 1.36 1.5 METHYL BROMIDE AND METHYL CHLORIDE . . . 1.36 1.5.1 Methyl Bromide (CH3Br) . . . 1.36
1.5.1.4 A Twentieth Century, Southern Hemispheric Trend and Its Implications . . . 1.39 1.5.1.5 Atmospheric Budget . . . 1.40 1.5.2 Methyl Chloride (CH3Cl) . . . 1.40 1.5.2.1 Atmospheric Distribution and Trends . . . 1.41 1.5.2.2 Sources of Atmospheric Methyl Chloride . . . 1.41 1.5.2.3 Sinks of Atmospheric Methyl Chloride . . . 1.43 1.5.2.4 Atmospheric Budget . . . .1.43 1.6 ATMOSPHERIC HALOCARBON OBSERVATIONS COMPARED WITH EXPECTATIONS . . . 1.44 1.6.1 Consistency Between Atmospheric Halocarbon Measurements and Known Sources and Sinks . . . 1.44 1.6.1.1 CFCs . . . 1.44 1.6.1.2 Methyl Chloroform . . . 1.44 1.6.1.3 Carbon Tetrachloride . . . 1.44 1.6.1.4 HCFCs . . . 1.47 1.6.1.5 Halons . . . 1.47 1.6.1.6 Regional Emissions . . . 1.47 1.6.2 Are Atmospheric Measurements Consistent with Compliance with the Fully
Amended Montreal Protocol? . . . 1.47 1.7 OTHER TRACE GASES . . . 1.51 1.7.1 Carbon Dioxide (CO2) . . . 1.51 1.7.2 Methane (CH4) . . . 1.53
1.7.3 Nitrous Oxide (N2O) . . . 1.55
1.7.4 Carbon Monoxide (CO) . . . 1.56 1.7.4.1 Atmospheric Global Distribution and Trends . . . 1.56 1.7.4.2 CO Sources and Sinks . . . 1.56 1.7.4.3 Isotopic Data . . . 1.56 1.7.5 Carbonyl Sulfide (COS) . . . 1.57 1.7.6 Hydrofluorocarbons (HFCs) . . . 1.57 1.7.6.1 HFC-134a . . . 1.57 1.7.6.2 HFC-23 . . . 1.57 1.7.6.3 HFC-125, HFC-143a, and HFC-152a . . . 1.59 1.7.7 Fluorocarbons (FCs), SF6, and SF5CF3 . . . 1.59 1.7.7.1 CF4and C2F6 . . . 1.59
1.7.7.2 C4F8and C3F8 . . . 1.59
1.7.7.3 Sulfur Hexafluoride (SF6) . . . 1.61 1.7.7.4 Trifluoromethylsulfurpentafluoride (SF5CF3) . . . 1.61 1.8 HALOGENATED SOURCE GASES IN THE FUTURE . . . 1.61 1.8.1 Development of the Baseline Scenario Ab . . . 1.61 1.8.2 Projecting Future Halocarbon Mixing Ratios . . . 1.62 1.8.2.1 CFCs . . . 1.62 1.8.2.2 Methyl Chloroform . . . 1.62 1.8.2.3 Carbon Tetrachloride . . . 1.62 1.8.2.4 Halons . . . 1.67 1.8.2.5 HCFCs . . . 1.68 1.8.2.6 Methyl Bromide and Methyl Chloride . . . .1.68 1.8.2.7 Effective Equivalent Chlorine . . . 1.68 1.8.3 Scenario Results: Calculated Mixing Ratios and EESC . . . 1.68 1.8.4 Uncertainty in the Baseline Scenario . . . 1.70 1.8.5 Potential Influence of Future Climate Change on Halogenated Source Gases . . . 1.71 REFERENCES . . . 1.71
SCIENTIFIC SUMMARY
• As a result of the Montreal Protocol and its Amendments and Adjustments, organic chlorine in the global tropo-sphere continues to decline slowly, and inorganic chlorine in the global stratotropo-sphere has stabilized.
(a) Total organic chlorine from long- and short-lived chlorocarbons continues to decline in the global troposphere. Total tropospheric chlorine in 2000 was about 5% lower than observed at its peak (3.7 ± 0.1 parts per billion (ppb)) in 1992-1994, and the rate of change in 2000 was about -22 parts per trillion per year (ppt yr-1) (-0.6%
yr-1). The influence of methyl chloroform on this decline is diminishing. Total organic chlorine from chloro-fluorocarbons (CFCs) is no longer increasing at Earth’s surface.
(b) Total inorganic chlorine in the atmosphere, as estimated from hydrogen chloride and chlorine nitrate total column absorbance measurements, stopped increasing in 1997-1998 and has remained fairly constant since. Because most atmospheric hydrogen chloride and chlorine nitrate reside in the stratosphere, this result provides an estimate of chlorine changes in the stratosphere. These stratospheric changes are consistent with expecta-tions based on our understanding of trace gas trends in the troposphere, stratospheric chemistry, and atmos-pheric mixing processes.
(c) Space-based measurements show that the global mean growth rate of hydrogen chloride at 55 km has been sub-stantially less since 1997 than it was before that time. Although the measurements since 1997 also show short-term variations, the recent data do not show the steady increases observed in the early 1990s.
• Recent results from observations of tropospheric and stratosphere bromine show the following:
(a) As of 2000, total organic bromine from halons continued to increase in the troposphere at about 0.2 ppt Br yr-1 (pmol mol-1yr-1), and halons accounted for nearly 8 ppt of bromine. Global trend data for methyl bromide, a gas that is responsible for about half of the 20 ppt of total bromine in today’s stratosphere, have not been updated since the previous Assessment. Atmospheric histories inferred from Southern Hemisphere air archives and Antarctic firn air suggest that, assuming similar changes in both hemispheres, total organic bromine from the sum of methyl bromide and halons has more than doubled since the mid-1900s.
(b) Measurements of inorganic bromine in the stratosphere indicate a rate of increase consistent with observed tro-pospheric trends of halons and methyl bromide, but mixing ratios that are 4-6 ppt higher. Additional strato-spheric bromine stems from the transport of nonanthropogenic, very short-lived gases (such as bromoform and dibromomethane) and their degradation products to the stratosphere.
• Ozone-depleting halogens in the troposphere, as assessed by calculating chlorine equivalents from measurements of organic chlorine- and bromine-containing source gases, continue to decrease. As of mid-2000, equivalent organic chlorine in the troposphere was nearly 5% below the peak value in 1992-1994. The recent rate of decrease is slightly less than in the mid-1990s owing to the reduced influence of methyl chloroform on this decline.
• Trends of ozone-depleting substances in the atmosphere have been updated, and 20thcentury trends have been deduced from air trapped in snow above glaciers (firn air).
(a) In 2000, tropospheric mixing ratios of CFC-11 and -113 were decreasing faster than in 1996, and mixing ratios of CFC-12 were still increasing, but more slowly.
(b) Global methyl chloroform mixing ratios have been declining exponentially since 1998 because of the rapid drop in emissions to low levels; mixing ratios in 2000 were less than one-half of the peak observed in 1992. As a result, the rate of decline observed for methyl chloroform (and chlorine from methyl chloroform) during 2000 was about two-thirds of what it was in 1996.
(c) Newly reported measurements of air from firn allow inferences regarding 20thcentury histories of ozone-depleting substances in the atmosphere. These data confirm that nonanthropogenic sources of chlorofluorocar-bons, halons, carbon tetrachloride, methyl chloroform, and hydrochlorofluorocarbons are insignificant. They are consistent, however, with there being substantial natural emissions of both methyl chloride and methyl bromide.
• Atmospheric halocarbon measurements can provide some assessment of past global compliance with production restrictions in the Montreal Protocol, and these considerations provide the foundation for projecting halocarbon mixing ratios in future scenarios.
(a) The substantial reductions in emissions of ozone-depleting substances during the 1990s that are inferred from measured atmospheric trends are consistent with controls on production and consumption in the fully amended and adjusted Montreal Protocol. Consumption in developing countries is now a significant contributor to global emissions. The year 1999 is the first in which production and consumption of a class of ozone-depleting substances (the CFCs) were restricted in all Parties to the Montreal Protocol. Atmospheric measurements are consistent with emissions derived from reported global production data for CFCs.
(b) The updated, best-estimate scenario (Ab) for future halocarbon mixing ratios suggests that the atmospheric burden of halogens will return to the 1980, pre-Antarctic-ozone-hole levels around the middle of this century, provided continued adherence to the fully amended and adjusted Montreal Protocol. Only small improvements would arise from reduced production allowances in the future. Lack of compliance to the Protocol controls would delay or prevent recovery of stratospheric ozone.
• With respect to hydrochlorofluorocarbons (HCFCs) and hydrofluorocarbons (HFCs), the gases used as interim sub-stitutes for CFCs, halons, and chlorinated solvents, this Assessment found the following:
(a) Organic chlorine from the HCFCs in the troposphere reached nearly 180 ppt in 2000 and represented 6% of total chlorine from anthropogenic gases. The rate of increase in organic chlorine from HCFCs remained con-stant at about 10 ppt yr-1from 1996 to 2000.
(b) Discrepancies reported in past Assessments between atmospheric observations and expectations based on industry-reported production and emissions have narrowed substantially for HCFC-142b. This improvement stems from a better description of the functions relating emissions to usage in foam applications.
(c) Mixing ratios of HFC-134a and -23 have continued to increase in recent years, and by 2000 each had approached about 15 ppt in the background atmosphere. Three additional HFCs (HFC-125, -124, and -152a) have been identified in the remote troposphere, but their abundance in 2000 was low (1-3 ppt).
• New lifetime recommendations are made in this Assessment:
(a) The global lifetime of carbon tetrachloride is estimated to be 26 years, or about 25% shorter than in the pre-vious Assessment. This shorter lifetime stems from identification of an ocean sink that is inferred from wide-spread observations of carbon tetrachloride undersaturation in surface waters of the ocean. Emissions inferred from this shorter lifetime and measured trends in 1996 are about a factor of 2 larger than those estimated from industry production data for that year. This apparent discrepancy, however, is within the rather large uncertain-ties in both estimates. Emissions inferred from atmospheric measurements and a lifetime of 26 years are about 7 times greater than the limits to global production set for 2005.
(b) In this Assessment, the global lifetime of Halon-1211 is taken to be 16 years based upon the mid-range of mod-eling results. This lifetime estimate and estimates of emission magnitudes and atmospheric mixing ratios con-tain substantial uncercon-tainties. Observational studies and emission histories have not reduced the uncercon-tainties in the global lifetime of 9-25 years calculated in models.
(c) The lifetime of methyl chloroform has been revised from 4.8 to 5.0 years based upon new observations. The implications of this change on our estimates of atmospheric hydroxyl suggest slightly longer lifetimes for HCFCs, HFCs, methane, and all other gases removed from the atmosphere by this important oxidant.
• With respect to methyl bromide and methyl chloride, ozone-depleting gases with both natural and human-derived sources, this Assessment found the following:
(a) A substantial imbalance remains in estimates of source and sink magnitudes for both methyl bromide and methyl chloride; known sinks outweigh sources for both of these gases. New sources of methyl bromide from individual crops and ecosystems have been identified, and new sources of methyl chloride from tropical plants have been discovered. These findings have narrowed the budget imbalances for both of these gases. Additional studies continue to show that the ocean is a small (10-20 Gg yr-1) net sink for atmospheric methyl bromide,
although this results from a balance of large production and loss terms. Our understanding of the saturation of methyl bromide in ocean waters has been refined, but the estimates of net flux between the ocean and atmos-phere remain essentially unchanged.
(b) Twentieth-century trends of methyl bromide and methyl chloride have been inferred for the Southern Hemisphere from analyses of firn air. Provided these gases are neither produced nor destroyed in the firn, these trends sug-gest 20thcentury increases in the Southern Hemisphere of about 3 ppt for methyl bromide and 50 ppt for methyl chloride.
(c) The best estimate for the global lifetime of methyl bromide remains at 0.7 (0.5-0.9) years. Additional studies directly related to estimating loss processes for methyl bromide have narrowed the uncertainties slightly, but they do not suggest large revisions to this lifetime. The fraction of emissions derived from industrially pro-duced methyl bromide is unchanged at 10-40% based upon our current understanding of source and sink magnitudes.
• Approaches to further accelerating the date of the recovery of the ozone layer are limited. This Assessment has made hypothetical estimates of the upper limits of improvements that could be achieved if global anthropogenic
production of depleting substances were to stop in 2003 or if global anthropogenic emissions of
ozone-depleting substances were to stop in 2003. Specifically:
Production. Relative to the current control measures (Beijing, 1999) and trends in recent production data, the
equivalent effective chlorine atmospheric loading above the 1980 level, integrated from 2002 until the 1980 level is reattained (about 2050), could be decreased by the following amounts:
• 5%, if production of hydrochlorofluorocarbons (HCFCs) were to cease in 2003. • 4%, if production of chlorofluorocarbons (CFCs) were to cease in 2003. • 4%, if production of methyl bromide were to cease in 2003.
• 1%, if production of halons were to cease in 2003.
• 0.3%, if production of methyl chloroform were to cease in 2003.
Emissions. Similarly, the equivalent effective chlorine atmospheric loading above the 1980 level, integrated from
2002 until the 1980 level is reattained (about 2050), could be decreased by the following amounts: • 11%, if emissions of halons were to cease in 2003.
• 9%, if emissions of chlorofluorocarbons (CFCs) were to cease in 2003. • 9%, if emissions of hydrochlorofluorocarbons (HCFCs) were to cease in 2003. • 4%, if emissions of methyl bromide were to cease in 2003.
• 3%, if emissions of carbon tetrachloride were to cease in 2003. • 2%, if emissions of methyl chloroform were to cease in 2003.
The decreases calculated for reduced production and emissions scenarios would be about a factor of 2 smaller if the decreases were compared with the loading integrated from 1980, which is when significant ozone depletion was first detected. Furthermore, the decreases calculated for the integrated equivalent effective chlorine atmospheric loading would be smaller if the cessation in production or emission occurred later than 2003.
The hypothetical elimination of all anthropogenic production of all ozone-depleting substances would advance the return of stratospheric loading to the pre-1980 values by about 4 years. The hypothetical elimination of all emis-sions derived from anthropogenic production of all ozone-depleting substances would advance the return of strato-spheric loading to the pre-1980 values by about 10 years.
1.1 INTRODUCTION
This chapter provides an update on scientific progress since the previous Scientific Assessment of Ozone
Depletion (WMO, 1999) regarding ozone-depleting
sub-stances (ODSs) in the atmosphere. This includes a dis-cussion of the latest available data for observed trends in the troposphere and stratosphere, emissions, lifetimes, Ozone Depletion Potentials (ODPs), and Global Warming Potentials (GWPs). On the basis of this updated informa-tion, we relate observations of ODSs in the atmosphere to expectations, and discuss the evidence that the Montreal Protocol is effectively reducing ozone-depleting gases in the atmosphere.
Also explored in this chapter are the potential future mixing ratios of halocarbons based upon the current Montreal Protocol and recent trends in halocarbon pro-duction data. Scenarios are presented to investigate a range of possible future halocarbon mixing ratios. A number of hypothetical “cases” are also explored to demonstrate how production and emission of different ODSs will affect atmospheric halogen burdens in the future.
A discussion of non-ozone-depleting gases, such as carbon dioxide and methane, is also included here. Although they do not participate directly in ozone-destroying reactions, these gases influence stratospheric ozone indirectly by affecting the availability of inorganic chlorine and bromine, or by affecting stratospheric tem-peratures and thus the occurrence and persistence of polar stratospheric clouds, among other effects.
The discussions here focus on all significant ODSs with atmospheric lifetimes long enough that they are rea-sonably well mixed in the troposphere. This lifetime cutoff was taken to be 0.5 years. Classic methods for cal-culating ODPs for gases with lifetimes longer than 0.5 years are assumed to be valid. The details regarding budgets, sources, sinks, ODPs, etc., for gases with shorter lifetimes are discussed in Chapter 2.
1.2 HALOGENATED OZONE-DEPLETING
GASES IN THE ATMOSPHERE
Atmospheric measurements of ozone-depleting substances provide a foundation for understanding changes in Earth’s protective ozone layer. Since the pre-vious Assessment (WMO, 1999) additional measurements have refined our understanding of the amounts, distribu-tions, and changes in ozone-depleting gases in the atmos-phere. For example, measurements suggest that inorganic chlorine in the stratosphere has now stabilized. This plateau arises as a result of the slow but continued overall
decline in organic chlorine observed globally in the tro-posphere since 1992-1994. Also, new results from the analysis of firn air provide further evidence that most ozone-depleting gases are entirely of human origin. Details regarding these results and others are found here.
In this chapter and in subsequent ones, the terms concentration, mixing ratio, volume mixing ratio (assuming ideal gas behavior), abundance, amount, and loading refer to dry air mole fraction. These mole frac-tions are expressed, for example, as parts per trillion (ppt; pmol mol-1). The term “ton” is used to represent a metric ton, which is 106 grams. Also, the term “Montreal Protocol” is used to indicate the fully amended and adjusted Montreal Protocol as of 2002 (Beijing Amendments), unless otherwise specified.
1.2.1 Updated Atmospheric Observations of Ozone-Depleting Gases
1.2.1.1 CHLOROFLUOROCARBONS(CFCS)
Updated ground-based measurements of chloroflu-orocarbons (CFCs) show continued increases for global surface mixing ratios of CFC-12 (CCl2F2). Surface
mixing ratios of CFC-113 (CCl2FCClF2) peaked around
1996 and have been decreasing slowly thereafter. The decrease noted for CFC-11 (CCl3F) mixing ratios in 1996
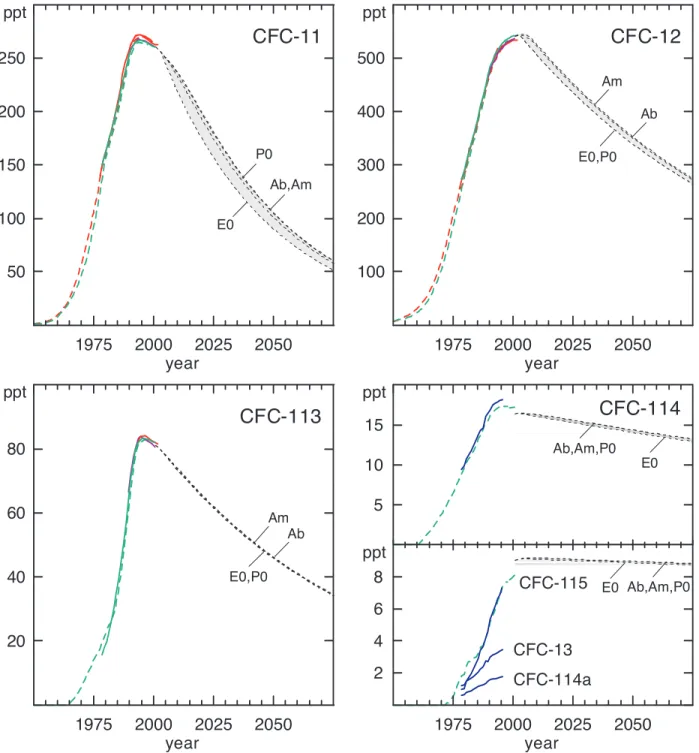
has continued (Figure 1-1; Table 1-1; Montzka et al., 1999; Prinn et al., 2000). Observed rates of change in the lower atmosphere for all three of these CFCs were slightly smaller in 2000 than in 1996 (Table 1-1; Prinn and Zander et al., 1999). Although emissions of CFC-12 declined substantially during the 1990s, mixing ratios of CFC-12 continue to increase because emissions are still larger than the small losses associated with its long atmospheric life-time (100 years).
Calibration differences between three global ground-based measurement networks—the Atmospheric Lifetime Experiment/Global Atmospheric Gases Experi-ment/Advanced GAGE (ALE/GAGE/AGAGE; denoted “AGAGE” in this chapter) network, the National Oceanic and Atmospheric Administration/Climate Monitoring and Diagnostics Laboratory (NOAA/CMDL; denoted “CMDL” in this chapter) network, and the University of California at Irvine (UCI) network—are on the order of 1-2% for CFC-11 and -12, and are slightly smaller for CFC-113. The trends measured at Earth’s surface by these three networks are similar in recent years (Table 1-1).
Updated column abundance measurements of CFC-12 from the ground also show continued increases in the atmospheric burden of this gas (Figure 1-2; Zander et al., 2000). The mean rate of accumulation, however, has slowed
CFC-114
5 10 15 ppt 2 4 6 8 ppt 1975 2000 2025 2050 year CFC-115 CFC-13 CFC-114a E0 Ab,Am,P0 Ab,Am,P0 E0CFC-113
20 40 60 80 ppt 1975 2000 2025 2050 year E0,P0 Am AbCFC-12
100 200 300 400 500 ppt 1975 2000 2025 2050 year E0,P0 Am AbCFC-11
50 100 150 200 250 ppt 1975 2000 2025 2050 year E0 Ab,Am P0Figure 1-1. Past and potential future atmospheric mixing ratios of CFCs. Measurements of ambient air (solid lines) and histories inferred from measurements of firn air (long-dashed lines) define past burdens at Earth’s surface. Potential future mixing ratios (short-dashed lines) have been calculated for different scenarios that are described in Section 1.8 (Ab, best guess; E0, zero emissions (not attainable, but defines a lower limit); Am, maximum allowed production; P0, zero production). Data sources for measurements of ambient air: AGAGE global monthly means (solid green lines: Prinn et al., 2000); CMDL global monthly means (solid red lines: Montzka et al., 1999); UCI global quarterly means (solid purple lines: D.R. Blake et al., 1996); and University of East Anglia (UEA) results from Cape Grim, Tasmania (for 41°S only) (solid blue lines: Oram, 1999). See the notes to Table 1-1 for more details regarding sampling frequencies and techniques. Antarctic histories have been derived from firn air extracted at the South Pole (red dashed lines: Butler et al., 1999) and Law Dome, Antarctica (green dashed lines: Sturrock et al., 2002). The shading shows the range of mixing ratios encompassed by the future scenarios.
from 4.97 × 10¹³molec cm−2yr−1(or +0.71% yr−1) in 1998 to 3.06 × 10¹³molec cm−2yr−1(or +0.43% yr−1) in 2000.
Updated balloon-based measurements at northern midlatitudes also reveal continued increases for CFC-12 in the stratosphere, up to 21 km altitude. Growth rates between 1997 and 2001, however, are between 2 and 3 ppt yr−1, which is less (significant at the 2σ level) than observed between 1978 and 1990, and also less (signifi-cant at the 1σ level) than observed between 1990 and 1997 (updated work from Engel et al., 1998).
Measured trends and atmospheric distributions continue to suggest that CFC emissions in 2000 were sub-stantially smaller than in the late 1980s and early 1990s (Montzka et al., 1999; Prinn et al., 2000). The most recent trends and interhemispheric gradients suggest, however, that emissions are not yet insignificant. Persistent mixing ratio gradients (or lack thereof) across latitudes on hemi-spheric scales can provide some indication of emission locations, but they are generally not useful for delineating emission rates from any individual country despite asser-tions to the contrary in some studies (Libo et al., 2001).
A number of less abundant CFCs have been meas-ured in the atmosphere. CFC-13 (CClF3), CFC-114 (CClF2CClF2), and CFC-115 (CClF2CF3) have found use as specialist refrigerants (R-13, R-114, R-115), aerosol propellants (CFC-114, -115), and foam-blowing agents (CFC-114). Small amounts of CFC-13 are also emitted during aluminum production (Harnisch, 1997) and during the manufacture of CFC-12. CFC-114a (CCl2FCF3),
which is an isomer of CFC-114 (CClF2CClF2), has also been detected in the background atmosphere (Oram, 1999; Culbertson et al., 2000). The most likely origin of CFC-114a is as a byproduct of the CFC-114 production process (Chen et al., 1994).
Measurements of air samples collected at Cape Grim, Tasmania (41°S), show that the abundance of all four of these minor CFCs increased substantially between 1978 and the mid-1990s (Figure 1-1; Table 1-1; Oram, 1999). During the early 1990s, however, the growth rates began to decline and by 1995 had all fallen to below 0.4 ppt yr−1. In late 1995, mixing ratios at Cape Grim were 3.5 ppt 13), 16.5 ppt 114), 1.8 ppt (CFC-114a), and 7.5 ppt (CFC-115) (Table 1-1).
More recent measurements from Cape Grim show mid-2000 mixing ratios of about 8 ppt and 16.7 ppt for CFC-115 and -114, respectively (Sturrock et al., 2001). CFC-115 was increasing at 0.1 ppt yr−1, while CFC-114 had stopped growing altogether. Mangani et al. (2000) similarly reported negligible growth for CFC-114 in recent years from samples collected in Antarctica. For these gases, direct comparisons between reported results are difficult because they often do not overlap in time, and, in the case of CFC-114, the AGAGE and Mangani et al. (2000) measurements may include significant contri-butions from both C2Cl2F4isomers (CFC-114 and -114a). Culbertson et al. (2000) measured CFC-13 and -114a in air samples collected at a rural, continental site in the United States in March-April 2000. The mean
CALENDAR YEAR 1986. 0 1988.0 1990.0 1992.0 1994.0 1996.0 1998.0 2000.0 2002.0 C O L U M N A B U N D A N C E (× 1 0 15 m ol ec ./c m 2 ) 1 2 5 6 7
8
CFC-12 and HCFC-22 above Jungfraujoch
CFC-12
HCFC-22 Pressure normalized monthly means
Pressure normalized June to November monthly means Polynomial fit to filled datapoints
NPLS fit (20% ) Figure 1-2. The time
evolu-tion of the monthly mean vertical column abundances of CFC-12 and HCFC-22 above the Jungfraujoch sta-tion, Switzerland, from 1985 to 2002 (update of Zander et al., 2000). Polynomial fits to the June to November columns are represented by the solid lines; nonpara-metric least-square fits (NPLS, dashed lines) are also shown but are notice-able only for CFC-12.
Table 1-1. Mixing ratios and growth rates of some important ozone-depleting substances.
Chemical Common or Mixing Ratio (ppt) Growth (1999-2000) Laboratory, Method
Formula Industrial Name 1996 1998 2000 (ppt yr–1) (% yr–1)
CFCs CCl2F2 CFC-12 532.4 538.4 542.9 2.3 0.42 AGAGE, in situ a 525.9 531.0 534.5 1.9 0.35 CMDL, in situ a 523.2 529.3 534.0 1.8 0.34 CMDL, flasks a 526.2 532.0 535.7 1.9 0.35 UCI, flasks a CCl3F CFC-11 265.6 263.0 260.5 –1.1 –0.41 AGAGE, in situ a 270.5 267.2 263.2 –2.0 –0.76 CMDL, in situ a 269.5 265.9 262.6 –1.5 –0.56 CMDL, flasks a 266.3 263.7 261.0 –1.0 –0.39 UCI, flasks a CClF3 CFC-13 3.5 UEA, SH, flasks b CCl2FCClF2 CFC-113 83.2 82.9 82.0 –0.35 –0.43 AGAGE, in situ a 84.2 83.0 82.1 –0.32 –0.39 CMDL, flasks b 83.1 82.1 81.1 –0.49 –0.60 UCI, flasks a CClF2CClF2 CFC-114 16.5 UEA, SH, flasks b
CCl2FCF3 CFC-114a 1.8 UEA, SH, flasks
b
CFC-114, -114a 17.1 17.2 –0.10 –0.58 AGAGE, in situ b
CClF2CF3 CFC-115 7.8 8.1 0.16 0.20 AGAGE, in situ b
7.5 UEA, SH, flasks b
Halons
CBrClF2 Halon-1211 3.9 4.1 0.13 3.2 AGAGE, in situ
b
3.5 3.8 4.0 0.10 2.5 CMDL, flasks a, b
3.4 3.6 3.9 0.12 3.2 UCI, flasks a
3.8 4.2 4.4 0.13 2.9 UEA, SH, flasks b
CBrF3 Halon-1301 2.8 2.9 0.08 2.8 AGAGE, in situ
b 2.3 2.5 2.6 0.06 2.4 CMDL, flasks a 2.0 2.2 2.3 0.05 2.2 UEA, SH, flasks b CBrF2CBrF2 Halon-2402 0.48 CMDL, flasks b 0.42 0.42 0.43 0.001 0.2 UEA, SH, flasks b
CBr2F2 Halon-1202 0.037 0.044 UEA, SH, flasks b
Chlorocarbons—see also Chapter 2
CH3Cl Methyl chloride 538 536 AGAGE, SH, in situ
b
588 OGI, flasks c
CCl4 Carbon 100.5 98.2 96.1 –0.94 –0.97 AGAGE, in situ a
tetrachloride 103.2 101.9 99.6 –0.95 –0.95 CMDL, in situ a
103.1 101.4 99.2 –1.03 –1.03 UCI, flasks a
CH3CCl3 Methyl 90.3 64.6 45.4 –8.7 –17 AGAGE, in situ
a chloroform 96.9 68.9 46.4 –10.2 –20 CMDL, in situ a 92.3 65.7 45.7 –9.1 –18 CMDL, flasks b 93.6 71.7 47.6 –13.0 –24 UCI, flasks a HCFCs CHClF2 HCFC-22 122.4 132.7 143.2 5.4 3.8 AGAGE, in situ a 121.5 131.4 141.9 5.1 3.7 CMDL, flasks b CH3CCl2F HCFC-141b 9.5 13.0 1.8 15 AGAGE, in situ b 5.4 9.1 12.7 1.7 15 CMDL, flasks b 4.3 UT, flasks b
mixing ratio of CFC-13 was 3.6 ± 0.3 ppt, which is in rea-sonable agreement with the measurements of Oram (1999). Conversely, the mixing ratio of CFC-114a was 7.9 ± 0.8 ppt, which is substantially higher than that reported by Oram (1999).
1.2.1.2 HALONS
Although the phaseout was imposed on halon pro-duction in developed countries earlier than for all other halocarbons, mixing ratios of both Halon-1211 (CBrClF2) and Halon-1301 (CBrF3) continued to increase in the atmosphere in 2000 (Figure 1-3). Global surface mixing ratios of individual halons were less than 5 ppt in 2000 (Table 1-1). Since the previous Assessment (WMO, 1999) a new set of regular measurements has become available (Prinn et al., 2000; Sturrock et al., 2001). Among the lab-oratories studying long-term trends of halons in the atmos-phere, calibration differences are about 10-15% (UCI < CMDL < AGAGE < University of East Anglia (UEA)) for Halon-1211 and about 25% (UEA < CMDL < AGAGE) for Halon-1301 (Butler et al., 1998; Fraser et al., 1999; Montzka et al., 1999).
For Halon-1211, all four laboratories report rates of increase in 2000 of about 3% yr-1, or 0.1 to 0.13 ppt yr-1 (Table 1-1). For Halon-1301, CMDL, UEA, and
AGAGE data suggest rates of increase of 0.05-0.08 ppt yr-1or 2-3% yr-1 in 2000 (Table 1-1). For both these halons, these rates of increase are only slightly slower than observed during the first half of the 1990s.
Two less abundant halons have been further moni-tored in the atmosphere. Halon-2402 (CBrF2CBrF2) is
present at between 0.4 and 0.5 ppt in the global atmos-phere (Table 1-1; Butler et al., 1998; Fraser et al., 1999), and its rate of increase has slowed dramatically since the mid-1990s (Fraser et al., 1999; Figure 1-3). Halon-1202 (CBr2F2) has been measured in background air at mixing
ratios of 0.04-0.05 ppt (Table 1-1; Figure 1-3; Engen et al., 1999; Fraser et al., 1999). During 1995-1996 the abun-dance of Halon-1202 was increasing at 17% yr-1(0.007 ppt yr-1) in the Southern Hemisphere, although updated measurements by UEA suggest that this rate is much smaller now (Figure 1-3). Although this halon has been used by the military in a few minor applications, most is produced from over-bromination during the production of Halon-1211 (UNEP, 1998b).
1.2.1.3 CARBONTETRACHLORIDE(CCl4)
Global surface mixing ratios of carbon tetrachlo-ride (CCl4) have decreased since about 1990; mixing ratios
in 2000 were between 95 and 100 ppt (Figure 1-4; Table Table 1-1, continued.
Chemical Common or Concentration (ppt) Growth (1999-2000) Laboratory, Method
Formula Industrial Name 1996 1998 2000 (ppt yr–1) (% yr–1)
CH3CClF2 HCFC-142b 10.4 12.5 1.1 9.4 AGAGE, in situ b 7.7 9.6 11.7 1.0 8.9 CMDL, flasks b 9.2 UT, flasks b CHCl2F HCFC-21 0.29 UEA, SH, flasks b CHCl2CF3 HCFC-123 0.03 UEA, SH, flasks b CHClFCF3 HCFC-124 0.89 1.34 0.35 30 AGAGE, in situ b
Bromocarbons—see also Chapter 2
CH3Br Methyl bromide 9-10 Many d
8.4 8.1 AGAGE, SH, in situ b
Global mixing ratios and growth rates at Earth’s surface unless otherwise specified. AGAGE: 4-5 in situ electron capture detection (ECD) sampling sites, 2 in situ gas chromatography-mass spectrometry (GC-MS) sampling sites, 2 flask sampling sites; CMDL: 5 in situ sampling sites, 8-10 remote flask sampling sites; UEA: University of East Anglia, analysis of archive flasks and regularly sampled flasks filled at Cape Grim, Australia (41°S); UCI: quarterly sampling from a multitude of sites between 47°S and 71°N.; UT: University of Tokyo, 2 flask sampling sites; OGI: Oregon Graduate Institute, quarterly flask sampling at ~40 sites. NH, Northern Hemisphere; SH, Southern Hemisphere.
Data sources: AGAGE: Prinn et al. (2000); Sturrock et al. (2001); ftp://cdiac.esd.ornl.gov/pub/ale_gage_Agage. CMDL: Butler et al. (1999); Montzka et al. (1999, 2000); Hall et al. (2002); http://www.cmdl.noaa.gov. UEA: Fraser et al. (1999); Oram et al. (1995); Oram (1999). UCI: D.R. Blake et al. (1996); N.J. Blake et al. (2001). UT: Shirai and Makide (1998).
a Measurements by gas chromatography with electron capture detection. b
Measurements by gas chromatography with mass spectrometry detection. c
Results from OGI for CH3Cl have been scaled by 550/600; see Kurylo and Rodríguez et al. (1999). d See Section 1.5.
0.1
0.2
0.3
0.4
ppt
1975
2000
2025
2050
year
Ab,Am,P0 E00.01
0.02
0.03
0.04
0.05
ppt
1975
2000
2025
2050
year
E0,P0 Am Ab1
2
3
ppt
1975
2000
2025
2050
year
E0 P0 Ab Am1
2
3
4
ppt
1975
2000
2025
2050
year
P0 Am E0 AbHalon-2402
Halon-1301
Halon-1211
Halon-1202
Figure 1-3. Past and potential future atmospheric mixing ratios of halons. Measurements of ambient air (solid lines) and histories inferred from measurements of firn air (long-dashed lines) define past burdens at Earth’s surface. Potential future mixing ratios (short-dashed lines) have been calculated for different sce-narios that are described in Section 1.8 and the caption to Figure 1-1. Data inferred from firn air are from the same sources as described in Figure 1-1. Data sources for measurements of ambient air: UEA from Cape Grim, Tasmania (for 41°S only) (solid blue lines: Fraser et al., 1999); AGAGE global mean data (solid green lines: Sturrock et al., 2001); UCI global quarterly means (solid purple lines: Blake et al., 2001); and CMDL global means (solid red lines: Butler et al., 1998; Montzka et al., 1999). The shading shows the range of mixing ratios encompassed by the future scenarios. See the notes to Table 1-1 for more details regarding sampling frequencies and techniques.
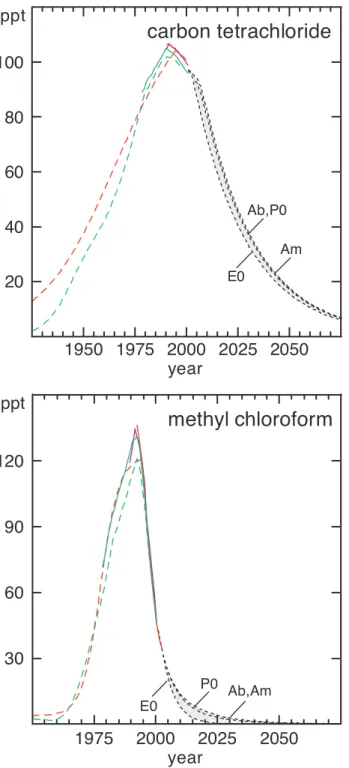
1-1; Simmonds et al., 1998a; Montzka et al., 1999; Prinn et al., 2000). The observed rates of change have remained fairly constant since 1993 at about –1% yr-1 or –1 ppt yr-1. The interhemispheric difference has also been fairly constant at about 2% (North > South) since 1993 and sug-gests that significant emissions of carbon tetrachloride remain (see Section 1.6). Calibration differences between CMDL, UCI, and AGAGE are 3 to 4%.
1.2.1.4 METHYLCHLOROFORM(CH3CCl3)
The rapid decline in emissions of methyl chloro-form (CH3CCl3) and its relatively short lifetime have together resulted in rapidly decreasing mixing ratios in recent years (Figure 1-4; Montzka et al., 2000; Prinn et al., 2001). The global mean surface mixing ratio in 2000 was approximately 46 ppt (Table 1-1), compared with the maximum of 130 ppt observed in 1992. Hemispheric dif-ferences were 2 to 3% in 2000, or much smaller than in earlier years.
Fairly constant exponential decay with a time con-stant of (5.5 yr)-1was observed for methyl chloroform during 1998-2000 (Montzka et al., 2000). This implies that the absolute rate of decline for methyl chloroform is becoming smaller: it peaked at –14 to –15 ppt yr-1in 1995-1996, and was one-third less in 1999-2000, or about –10 ppt yr-1(Table 1-1).
Scale differences between CMDL and AGAGE were stated as being ~10% in Prinn and Zander et al. (1999), and even larger among a broader range of labora-tories. Since then scale revisions by AGAGE (Scripps Institution of Oceanography (SIO), SIO-93 to SIO-98; Prinn et al., 2000) and CMDL (Hall et al., 2002) suggest that the AGAGE-CMDL differences are now on the order of <3%. There is a small time dependence to this differ-ence. Similar mixing ratios are reported by UCI in 2000 (Table 1-1).
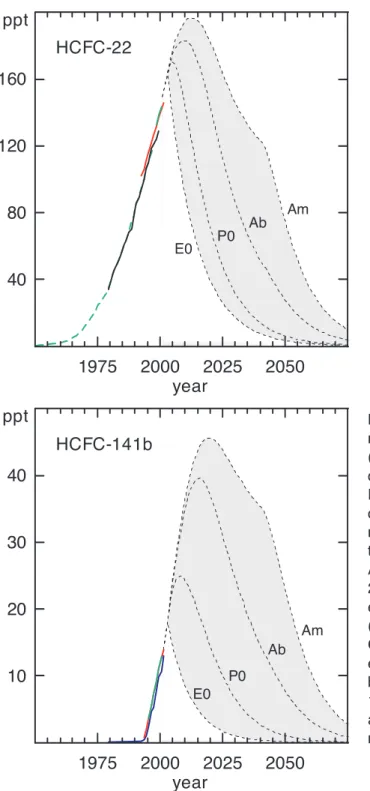
1.2.1.5 HYDROCHLOROFLUOROCARBONS(HCFCS) Updated measurements of hydrochlorofluorocar-bons (HCFCs) indicate that global mixing ratios of the three most abundant HCFCs continue to increase in the atmosphere, owing to sustained emissions (Figure 1-5). Updated measurements suggest global mixing ratios for HCFC-22 (CHClF2) of 140-145 ppt in 2000 and a fairly
constant growth rate of about 5 ppt yr-1(Table 1-1; Figure 1-5; Simmonds et al., 1998b; Montzka et al., 1999). Sturrock et al. (2001) reported slightly faster increases from samples collected only at Cape Grim, Tasmania (6.3 ppt yr-1). Hemispheric differences have been fairly con-stant in recent years at about 10% (North > South).
30
60
90
120
ppt
1975
2000
2025
2050
year
E0 P0 Ab,Am20
40
60
80
100
ppt
1950 1975 2000 2025 2050
year
E0 Ab,P0 Amcarbon tetrachloride
methyl chloroform
Figure 1-4. Past and potential future atmospheric mixing ratios of carbon tetrachloride (CCl4) and methyl
chloroform (CH3CCl3). Measurements of ambient air (solid lines) and histories inferred from measurements of firn air (long-dashed lines) define past burdens at Earth’s surface. Potential future mixing ratios (short-dashed lines) have been calculated for different scenarios that are described in Section 1.8 and the caption to Figure 1-1. Data sources and shading are the same as described in Figure 1-1.
Mean total column abundances of HCFC-22 meas-ured above the Jungfraujoch station, Switzerland, in 1995 were 1.66 ¥ 1015molec cm-2, increasing by 8.71 ¥ 1013
molec cm-2yr-1(or 5.2% yr-1); for 2000, these figures were 2.11 ¥ 1015molec cm-2, increasing by 8.93 ¥ 1013
molec cm-2yr-1(or 4.2% yr-1), thus indicating that the absolute rate of atmospheric accumulation during those 5 years did not change substantially (Figure 1-2; an update of Zander et al., 2000).
Updated measurements show that the global mean surface mixing ratio of HCFC-141b (CH3CCl2F) rose
from about 5 ppt in mid-1996 to nearly 13 ppt in mid-2000 (Table 1-1; Figure 1-5; Montzka et al., 1994, 1999; Simmonds et al., 1998b; Prinn et al., 2000; Sturrock et al., 2001). The current growth rate is slightly less than 2 ppt yr-1. Northern Hemispheric mean mixing ratios were
approximately 3 ppt higher than Southern Hemispheric means in mid-2000.
5
10
15
20
25
30
ppt
1975
2000
2025
2050
year
E0 P0 Am Ab10
20
30
40
ppt
1975
2000
2025
2050
year
E0 P0 Ab Am40
80
120
160
ppt
1975
2000
2025
2050
year
E0 Ab P0 AmHCFC-22
HCFC-141b
HCFC-142b
Figure 1-5. Past and potential future atmospheric mixing ratios of HCFCs. Measurements of ambient air (solid lines) and histories inferred from measurements of firn air (long-dashed lines) define past burdens at Earth’s surface. Potential future mixing ratios (short-dashed lines) have been calculated for different sce-narios that are described in Section 1.8 and the cap-tion to Figure 1-1. Data sources: mixing ratios from Antarctic firn (long-dashed green line: Sturrock et al., 2002); AGAGE global means (solid green lines: Prinn et al., 2000; Sturrock et al., 2001); CMDL global means (solid red lines: Montzka et al., 1999); UEA from Cape Grim, Tasmania (for 41°S only) (solid blue lines: Oram et al., 1995); SIO from Cape Grim (41°S only) (solid black line: Miller et al., 1998). See the notes to Table 1-1 for more details regarding sampling frequencies and techniques. The shading shows the range of mixing ratios encompassed by the future scenarios.
Global mean surface mixing ratios of HCFC-142b (CH3CClF2) have risen from 7 to 8 ppt in mid-1996 to about 12 ppt in mid-2000, with a current growth rate of 1.0 ppt yr-1 (Table 1-1; Figure 1-5; Montzka et al., 1994; 1999; Simmonds et al., 1998b; Prinn et al., 2000; Sturrock et al., 2001). Northern Hemispheric means were 2 to 2.5 ppt higher than Southern Hemispheric means in mid-2000. Calibration differences are about 5% or less for HCFC-22, -141b, and -142b among laboratories reporting results recently (Table 1-1).
Since the previous Assessment, three other HCFCs have been reported in the background atmosphere: HCFC-123 (CHCl2CF3), HCFC-124 (CHClFCF3), and HCFC-21
(CHCl2F) (Table 1-1). From measurements at Cape Grim, Sturrock et al. (2001) reported late-1998 tropospheric mixing ratios of 0.53 ppt and 0.1 ppt for HCFC-124 and -123, respectively, the former having a growth rate of 0.06 ppt yr-1(13%). Oram (1999) found similarly low levels of HCFC-123 at Cape Grim from archived samples col-lected between 1978 and 1993, but noted that the mixing ratio doubled between 1990 and 1993. Oram (1999) also reported measurements of HCFC-21 over the same period. Mixing ratios were typically in the range 0.2-0.4 ppt, with no significant trend.
1.2.1.6 METHYLBROMIDE(CH3Br)
Our understanding of the concentration of methyl bromide (CH3Br) in the atmosphere during the 1990s remains much the same as was given in the previous (1998) Assessment (WMO, 1999). No new global trends have been reported since those of Khalil et al. (1993). Recent data from research cruises encompassing a wide latitudinal span in both hemispheres (Yokouchi et al., 2000a; Li et al., 2001; Groszko and Moore, 1998; King et al., 2000), from aircraft missions (Schauffler et al., 1999), and from two midlatitude, ground-based sites (Miller, 1998) suggest that the mean global mixing ratio of atmos-pheric CH3Br ranged from 9 to 10 ppt before reductions
in industrial production began in the late 1990s, consis-tent with that reported in the 1998 Assessment. These new studies, along with that of Wingenter et al. (1998), suggest that the best estimate of the global, area-weighted, mean hemispheric ratio lies between 1.2 and 1.3 (North > South). This hemispheric ratio varies seasonally from 1.1 to 1.4, driven mainly by seasonality in Northern Hemispheric mixing ratios. Recent published compar-isons between the National Center for Atmospheric Research (NCAR) and UCI show measurements agreeing within an average of 7% (Schauffler et al., 1999).
The vertical distributions and weak tropospheric gradient observed by N.J. Blake et al. (1996; 1997) are supported by measurements of Schauffler et al. (1999).
The tropospheric gradient in mixing ratio of 3-14% reported by Schauffler et al. (1999) is consistent with that reported in the 1998 Assessment, which noted a 0-15% vertical gradient in the tropospheric mixing ratio. Additionally Schauffler et al. (1999) noted that CH3Br
mixing ratios in the lower stratosphere (20 km) were reduced by 40% in the tropics and by 70% at Northern Hemispheric midlatitudes (July) relative to amounts observed in the troposphere.
1.2.1.7 METHYLCHLORIDE(CH3Cl)
Khalil and Rasmussen (1999) recently published a detailed analysis of global measurements of methyl chlo-ride (CH3Cl) conducted over 16 years (1981-1997) at
loca-tions distributed throughout both hemispheres, during which methyl chloride reportedly decreased by about 4%. As noted in Chapter 2 of the 1998 Assessment (Kurylo and Rodríguez et al., 1999), Khalil and Rasmussen’s global mean mixing ratio of 606 ppt is somewhat higher than the average of 550 ± 30 ppt obtained by other inves-tigators. New results continue to suggest global means closer to 550 ppt than 600 ppt (Sturrock et al., 2001; Yokouchi et al., 2000b; Table 1-1). Khalil and Rasmussen (1999) reported a mean annual latitudinal distribution in the CH3Cl mixing ratio in which the tropics were about
40 ppt higher than the poles, and they inferred that this had to be caused by a tropical terrestrial source. They also reported a seasonal cycle with an amplitude of about 10%, explicable mainly in terms of seasonal changes in hydroxyl radical (OH) abundance. In more recent work involving land-based and shipboard measurements extending from the Canadian Arctic through the Pacific and Indian Oceans to the Antarctic between 1996 and 1998, Yokouchi et al. (2000b) found CH3Cl mixing ratios
ranging from 500 ppt in the high Arctic and Antarctic to 570 ppt near the equator. Although this latitudinal distri-bution was measured only over a fraction of a year, it is similar to the annual mean distribution reported by Khalil and Rasmussen (1999).
1.2.2 Twentieth Century Atmospheric Histories for Halocarbons from Firn Air
Since the previous Assessment (WMO, 1999), 20th
century atmospheric histories for halocarbons have been reconstructed from the analysis of air trapped in snow above glaciers, also known as firn air (Figures 1-1, 1-3, 1-4, and 1-5; Butler et al., 1999; Sturges et al., 2001a; Sturrock et al., 2002). Conclusions drawn from the firn-air results rely on the assumption that these halocarbons are neither produced nor destroyed in the firn. These
firn-air data show that mixing ratios of CFCs, halons, and HCFCs in the oldest air sampled are generally less than 2% of the amounts measured today in the background atmosphere. Furthermore, and consistent with these halo-carbons not being destroyed or produced in firn air over time, the 20thcentury atmospheric histories reconstructed
from firn-air results and firn diffusion models are reason-ably consistent with calculated histories based on records of industrial halocarbon production (Prinn et al., 2000). Somewhat higher amounts of carbon tetrachloride (5 ppt) and methyl chloroform (2-4 ppt) have been reported in the deepest and oldest samples, although these amounts were close to the detection limit of the instruments used in these analyses. These results suggest that nonindus-trial sources of these halocarbons are insignificant.
Mixing ratios for methyl chloride and methyl bro-mide were only 10-30% lower than present day in firn air from Antarctica dating back to the early 1900s (Butler et al., 1999; Sturges et al., 2001a). The results are consis-tent with the presence of substantial nonindustrial emis-sions of these gases. Consistent results were observed for methyl bromide in firn samples at four different locations in Antarctica. These suggest that levels of methyl bro-mide in the Southern Hemisphere have increased by about 3 ppt since the early 20thcentury and about 2 ppt since the mid-20th century (see Section 1.5). Unfortunately,
Northern Hemispheric firn-air profiles of methyl bromide show significant anomalies near the snow-ice transition, a feature not observed in the Antarctic profiles. For methyl chloride, firn data from both hemispheres suggest that the atmospheric burden over the last half of the 20thcentury
increased by about 10%. Additional details and discus-sion of these results appear in Section 1.5.
1.2.3 Total Atmospheric Chlorine
1.2.3.1 TOTALORGANICCHLORINE IN THE TROPOSPHERE
Total organic chlorine (CCly) contained in
long-lived chlorine-bearing source gases continues to decrease slowly in the lower atmosphere. In mid-2000, CClywas
~3.5 parts per billion (ppb) (Table 1-2), or about 5% lower than the peak observed in 1992-1994. The decrease still results primarily from the exponential decline observed for methyl chloroform (Table 1-2; Table 1-1; Figure 1-4). This situation is changing, however, because the absolute rate of decrease observed in 1999-2000 for methyl chlo-roform had diminished by one-third compared with 1995-1996 and will continue to lessen in the future (Montzka et al., 1999; see also Section 1.8).
By 2000 total chlorine from aggregated CFCs was no longer increasing (Table 1-2). Continued increases in chlorine from CFC-12 (3.6-4.6 ppt Cl yr-1) in 2000 were similar in magnitude to declines in chlorine from the sum of CFC-11 and CFC-113 (Table 1-1).
The rate of increase in chlorine from HCFCs has been fairly constant since 1996 (Tables 1-1 and 1-2). HCFC-22 accounts for approximately 80% of chlorine from HCFCs in today’s atmosphere and for about half of the annual increase in chlorine from all HCFCs (5 ppt Cl yr-1out of about 10 ppt Cl yr-1). Continued increases in
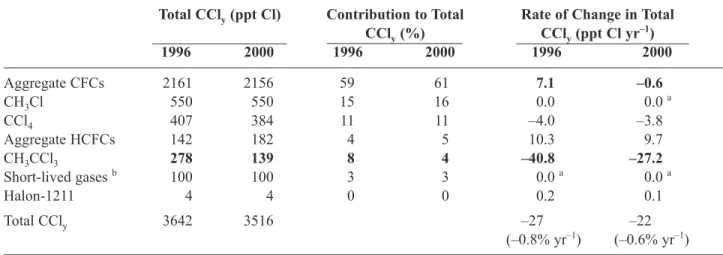
Table 1-2. Contributions of halocarbons to total organic chlorine (CCly) in the troposphere.
Total CCly(ppt Cl) Contribution to Total Rate of Change in Total
CCly(%) CCly(ppt Cl yr–1) 1996 2000 1996 2000 1996 2000 Aggregate CFCs 2161 2156 59 61 7.1 –0.6 CH3Cl 550 550 15 16 0.0 0.0 a CCl4 407 384 11 11 –4.0 –3.8 Aggregate HCFCs 142 182 4 5 10.3 9.7 CH3CCl3 278 139 8 4 –40.8 –27.2 Short-lived gases b 100 100 3 3 0.0 a 0.0 a Halon-1211 4 4 0 0 0.2 0.1 Total CCly 3642 3516 –27 –22 (–0.8% yr–1) (–0.6% yr–1)
Bold-faced type is used to highlight the largest changes from 1996 to 2000. Some differences for 1996 from WMO (1999) arise because of small recent adjustments to absolute calibration scales and because the results presented here are an average of AGAGE and CMDL global means. Similar con-clusions could be drawn with data from UCI (Table 1-1).
a Presumed to be zero; not well documented. b Gases such as CH
HCFC-141b and -142b mixing ratios account for the addi-tional annual chlorine increase.
The four minor CFCs accounted for about 50 ppt of Cl, or less than 1.5% of the total tropospheric chlorine burden in 2000 (CFC-13, -114, -114a, and -115). About 70% of this 50 ppt is from CFC-114. The current rate of growth for chlorine in these minor CFCs is small (<1 ppt Cl yr-1; Table 1-1).
1.2.3.2 TOTALINORGANICCHLORINE IN THE STRATOSPHERE
In a stratosphere unperturbed by polar stratospheric clouds or recent volcanism, more than 95% of inorganic chlorine (Cly) is accounted for by the two reservoirs
hydrogen chloride (HCl) and chlorine nitrate (ClONO2)
(Zander et al., 1992, 1996). Furthermore, because tropo-spheric HCl and ClONO2mixing ratios are small, the sum of their vertical column abundances is a good surrogate of the Clyloading and its evolution in the stratosphere.
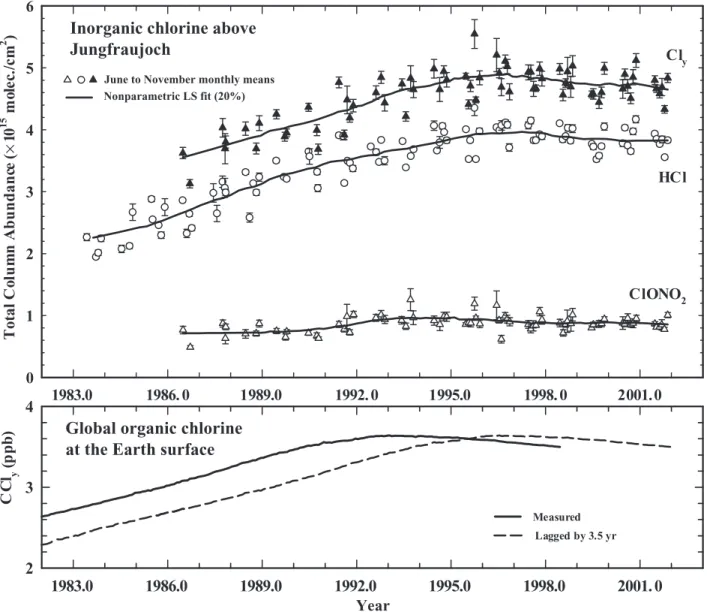
Past reports of total column abundances of HCl and ClONO2, as well as their sum (Cly) derived from observa-tions at Jungfraujoch (Switzerland, 46.5°N) through 1999, showed increases commensurate with trends in CClyat
Earth’s surface but delayed by 3-4 years owing to air trans-port rates between the troposphere and the stratosphere (Prinn and Zander et al., 1999; Mahieu et al., 2000).
An update of measurements from the Jungfraujoch now shows that the monthly mean total column abun-dances of HCl and ClONO2 have stopped increasing (Figure 1-6). Updates of column abundance measure-ments of HCl at Kitt Peak (Arizona, U.S., 31.9°N) (Rinsland et al., 1991; Wallace et al., 1997) and of HCl and ClONO2at Lauder (New Zealand, 45°S) (Matthews et al., 1989; Reisinger et al., 1995) also show similar overall long-term trends. These results provide robust evidence that the loading of inorganic Clyin the
unper-turbed stratosphere has recently stabilized in response to the production regulations on ozone-depleting substances outlined in the Montreal Protocol. Within the uncertainty of these measurements, the trends in total column HCl and ClONO2are consistent with the trends for chlorinated organic trace gases measured at Earth’s surface.
1.2.3.3 HYDROGENCHLORIDE(HCl) AT55 KM ALTITUDE IN THESTRATOSPHERE
An independent assessment of total Clynear the
stratopause has been provided by measurements of HCl made since 1991 at 55 km altitude by the Halogen Occultation Experiment (HALOE) instrument aboard the Upper Atmosphere Research Satellite (UARS) (Russell et al., 1996; Prinn and Zander et al., 1999). At that altitude,
most Cly(~ 93-95%, globally) is in the form of HCl. The
broad changes in mean global HCl at 55 km measured by HALOE show a period of monotonically increasing HCl mixing ratios before 1997, and much slower mean changes thereafter (updates to Anderson et al., 2000; Figure 1-7). These long-term trends are consistent with expectations from ground-based measurements after considering lag times associated with transport of tropospheric air to the stratosphere and stratospheric mixing processes (Waugh et al., 2001; Hall and Plumb, 1994).
What remain unexplained in the HALOE HCl data are abrupt changes that occurred over shorter periods, such as those observed in early 1997 (Waugh et al., 2001; Engel et al., 2002) and in 2000 (Figure 1-7). These changes strongly suggest that additional atmospheric processes affect trends in HCl at 55 km (Randel et al., 1999; Considine et al., 1999). Several possible mechanisms likely to cause the early-1997, abrupt peaking of Clyat 55 km altitude were considered by Waugh et al. (2001) (such as changes in transport and chemistry partitioning), but none could explain a sharp decrease as early as 1997 in upper stratospheric Cly, given the measured tropospheric halocarbon trends and our understanding of atmospheric transport rates and mixing processes. HALOE measure-ments of methane, however, are anticorrelated with HCl since 1997. This suggests that transport may contribute to the variability observed in the HCl record, but trans-port effects alone do not resolve these tendencies (per-sonal communication, J. Russell III, Hampton University, U.S., 2001).
1.2.3.4 STRATOSPHERICCHLORINECOMPARED WITH TROPOSPHERICCHLORINE
Evaluations of total chlorine (Cltot) in the
strato-sphere have been derived from measurements of CClyand
Cly throughout the stratosphere with the Atmospheric
Trace Molecule Spectroscopy (ATMOS) shuttle-based Fourier transform infrared (FTIR) spectrometer (Gunson et al., 1996). Average stratospheric Cltotwas measured at
2.58 ± 0.10 ppb in 1985 (Zander et al., 1992) and 3.53 ± 0.10 ppb in 1994 (Zander et al., 1996). From measure-ments of a suite of chlorine-bearing source-, sink-, and reservoir species with a balloonborne FTIR spectrometer launched on 8 May and on 8 July 1997 from Fairbanks (Alaska, 64.8°N), Sen et al. (1999) derived a nearly con-stant value of Cltot, equal to 3.7 ± 0.2 ppb between 9 and
38 km altitude. Each of these studies confirmed that the bulk of inorganic stratospheric chlorine is well explained by the photodissociation of organic source gases meas-ured in the troposphere after considering time lags associ-ated with air transport and mixing processes.
1.2.4 Total Atmospheric Bromine 1.2.4.1 TOTALORGANICBROMINE IN THE
TROPOSPHERE
Total organic bromine (CBry) in the troposphere results primarily from surface emissions of methyl bro-mide, halons, and short-lived bromocarbons. Recent trends in CBryare uncertain because global atmospheric trends in methyl bromide since 1992 are not yet well
doc-umented. Firn-air measurements suggest significant increases for this gas during 1900-1998, but they do not tightly constrain recent atmospheric trends. Changes in the growth rate of methyl bromide are perhaps likely during the 1990s because of the restrictions placed on industrial production in developed countries then (see the fully revised and amended Montreal Protocol).
Total organic bromine from halons has continued to increase since 1996 owing to continued anthropogenic production and use. The aggregate contribution of halons 1.16 1983.0 1986. 0 1989.0 1992. 0 1995.0 1998. 0 2001.0 T ot al C ol u m n A b u n d an ce (× 1 0 15 m ol ec ./c m 2 ) 0 1 2 3 4 5 6 Year 1983.0 1986.0 1989.0 1992.0 1995.0 1998.0 2001. 0 2 3 4 Lagged by 3.5 yr Measured C C l(py pb ) HCl ClONO2 Cly
June to November monthly means Nonparametric LS fit (20%)
Inorganic chlorine above
Jungfraujoch
Global organic chlorine
at the Earth surface
Figure 1-6. Upper frame: Time series of June to November (to avoid significant variability during winter and spring periods) monthly mean vertical column abundances of HCl (open circles) and ClONO2(open triangles) derived from solar observations at the Jungfraujoch between 1983 and 2001 (update from Mahieu et al., 2000). Inorganic chlorine (Cly, filled triangles) is obtained by summing the HCl and ClONO2column measure-ments. Lines represent nonparametric least-squares fits with 20% weighting. Lower frame: The temporal evolution of global organic chlorine loading (CCly) determined from in situ measurements at the ground (solid line: Prinn et al., 2000), and CClylagged by 3.5 years (dashed line).
to CBrywas 0.7 ppt in 1978, 6.7 ppt in 1996, and 7.7 ppt
in 2000, and was increasing at 0.2 ppt Br yr-1in 2000 (Table 1-1; Figure 1-8).
Shorter-lived gases with predominantly natural sources, such as bromoform (CHBr3) and
dibro-momethane (CH2Br2), also add to the bromine burden of
the atmosphere. Atmospheric measurements indicate between 1 and 3 ppt of organic bromine is present near the tropopause in the form of these gases (Shauffler et al., 1998; Pfeilsticker et al., 2000). Although the precise amount of organic plus inorganic bromine delivered to the stratosphere by these short-lived gases is uncertain (see Chapter 2), we estimate that in 2000 methyl bromide accounted for about 50% of CBry, and the halons
accounted for about 40% of CBry.
1.2.4.2 TOTALINORGANICBROMINE IN THE STRATOSPHERE
The burden and trend of inorganic bromine (Bry) in the stratosphere can be estimated indirectly from meas-urements of organic source gases in the stratosphere (Schauffler et al., 1998; Wamsley et al., 1998) and from stratospheric bromine monoxide (BrO) measurements and calculated BrO/Bry partitioning (Harder et al., 2000; Pfeilsticker et al., 2000; Sinnhuber et al., 2002). In strat-ospheric air in which most organic source gases had become oxidized, Brywas estimated in early 1999 to be 18.4 (+1.8/-1.5) ppt from organic precursor ments and 21.5 ± 3.0 ppt from coincident BrO measure-ments and photochemical modeling (Pfeilsticker et al., Figure 1-7. The time evolution of monthly mean HCl
at altitudes of 54-56 km between 70°N and 70°S as measured by HALOE (green line: an update of Anderson et al., 2000). From this HCl record, total inorganic chlorine (Cly) mixing ratios at 55 km (red line) and their ±1 standard deviations (orange shading) were derived using weighted contributions at 55 km altitude from all important source gases as determined from NCAR 2-D model calculations (Brasseur et al., 1990). Also shown are (i) CClyat Earth’s surface based on the Ab scenario in Madronich and Velders et al. (1999) (dashed blue line), (ii) this surface result lagged by 6 years (solid blue line), and (iii) this lagged CClyconvolved with a 3-yr-wide “age spectrum” (black line: an update of Waugh et al., 2001). 6 8 10 12 14 16 18 20 22 24 26 methyl bromide + halons Bromine (ppt) Year methyl bromide Total l Inorganic
Figure 1-8. Past measured trends for bromine in the troposphere (lines) and stratosphere (points): global tropospheric bromine from methyl bromide as measured in ambient air and firn air (short dashed line: Khalil et al., 1993; Butler et al., 1999; Sturges et al., 2001a); global tropospheric bromine from the sum of methyl bromide plus halons as measured in ambient air, archived air, and firn air (solid line: Butler et al., 1999; Fraser et al., 1999; Sturges et al., 2001a), or as derived from firn-air and global flask samples (long-dashed line: Butler et al., 1998); and total inorganic bromine derived from stratospheric measurements of BrO and photochemical modeling that accounts for BrO/Brypartitioning (open squares:
Harder et al., 2000; Fitzenberger et al., 2000; Pfeilsticker et al., 2000). The years indicated on the abscissa are sampling times for tropospheric data. For stratospheric data, the date corresponds to when that air was last in the troposphere (i.e., sam-pling date minus mean time in stratosphere).
2000; measurements were made at 25 km in air inferred to have a 5.6-yr mean age). Lower in the stratosphere, Bryis a much smaller fraction of total bromine; these same
investigators estimated Bryto be 1.5 ppt in air just above
the local Arctic tropopause (about 9.5 km).
1.2.4.3 STRATOSPHERICBROMINECOMPARED WITH TROPOSPHERICBROMINE
Spectrometric BrO measurements allow for esti-mates of total stratospheric Bry. These measurements
sug-gest an increase in Bry over time and a stratospheric
burden that is 4 to 6 ppt higher than indicated by the tro-pospheric burdens of halons and methyl bromide alone (Figure 1-8; an update of Pfeilsticker et al., 2000). Measurements of long- and short-lived gases at the tropopause and throughout the stratosphere suggest that an additional 1 to 3 ppt of bromine reaches the strato-sphere in the form of organic short-lived gases, such as dibromomethane and bromoform (Schauffler et al., 1998; Wamsley et al., 1998; Pfeilsticker et al., 2000). This addi-tional bromine does not appear to account for all the BrO measured, however. The remaining difference may sug-gest the presence of unmeasured, brominated organic gases reaching the stratosphere, or an influx of inorganic bromine into the stratosphere (see Chapter 2), or calibra-tion errors either in the measurement of BrO or the organic source gases (Fitzenberger et al., 2000).
1.2.5 Effective Equivalent Chlorine and Effective Equivalent Stratospheric Chlorine
The net effect of changes in both atmospheric chlo-rine and bromine can be gauged roughly by computing effective equivalent chlorine (EECl) and effective equiv-alent stratospheric chlorine (EESC) from ground-based measurements of halocarbons (Prather and Watson, 1990; Daniel et al., 1995; Montzka et al., 1996a, 1999; WMO, 1999). EECl is calculated with ground-based halocarbon measurements, consideration of the enhanced efficiency of bromine to deplete stratospheric ozone (a factor of 45 used here; see discussion of a in Section 1.4.4), and con-sideration of the relative rates at which halocarbons decompose and release their halogen into the stratosphere. Ground-based measurement networks of the most abun-dant ODSs indicate that total ozone-depleting halogen measured in the troposphere peaked in 1992-1994 (Figure 1-9; Montzka et al., 1996a; Cunnold et al., 1997). Updated observations show that EECl in tropospheric air declined from 1995 through 2000 at a mean rate of about 1.2% yr-1, or 24 ppt EECl yr-1. As of mid-2000, EECl was about 5% below the peak that was observed in 1992-1994.
-2.0% -1.0% 0.0% 1.0% 2.0% 1990 1995 2000 2005 2010 Sample date Rate o f Change (per yr) (b) 1850 1950 2050 2150 2250 1990 1995 2000 2005 2010 Sample date Effective Equivalent Cl (ppt) (a)
Figure 1-9. Burden and trends in aggregate tropo-spheric Cl plus Br from purely anthropogenic halo-carbons expressed as effective equivalent chlorine. (a) Effective equivalent chlorine estimated from ground-based measurements of the major CFCs, methyl chloroform, carbon tetrachloride, Halon-1211, Halon-1301, and HCFCs (blue line with dia-monds: Montzka et al., 1999; red line with squares: Prinn et al., 2000), and from the same gases as in scenario Ab (thin smooth line). The time scale on the x-axis refers to the date tropospheric air was sampled; to convert to effective equivalent strato-spheric chlorine (EESC), add approximately 3 years to these dates. (b) The rate of change in effective equivalent chlorine as measured by [AGAGE + CMDL halon] measurements (red squares); CMDL measurements only (blue diamonds); [AGAGE + UEA halon] measurements (green plus symbols: halon data from Fraser et al., 1999); and in scenario Ab (thin solid line). Rates of change correspond to the 12-month difference over the previous 12 months. In both panels, total bromine was multiplied by 45, and the absolute fractional release assumed for CFC-11 was 0.8 (see Section 1.4.4).
Smaller declines and slower rates of decline are inferred when halon measurements by UEA at Cape Grim are con-sidered (Figure 1-9; update of Fraser et al., 1999).
Although decreases observed for methyl chloro-form are the primary reason for the turnover in EECl, the influence of methyl chloroform on EECl is diminishing. Furthermore, the increases still observed for CFC-12 and halons are slowing the decline of EECl (Fraser et al., 1999; Montzka et al., 1999). As a result of these influences, EECl decreased in 2000 at a rate that was only about two-thirds of the rate 3 to 4 years earlier (Figure 1-9). As the influence of methyl chloroform continues to lessen, a sus-tained decrease in EECl is assured only if trends for other halocarbons decrease further or become more negative (Montzka et al., 1999; see also Section 1.8).
Whereas EECl reflects the time evolution of equiv-alent effective halogen only in the troposphere, EESC pro-vides an estimate of that burden in the stratosphere. EESC is derived by simply adding a 3-year time lag to EECl (see Section 1.8). Although EESC provides a useful measure to gauge the combined influence of tropospheric chlorine and bromine trends on stratospheric ozone-depleting halogen, it has important limitations. First, stratospheric halocarbon abundances lag tropospheric abundances by a few months to 6 years, depending upon location. Despite this range, a lag of 3 years is generally used in the calcu-lation of EESC to approximate the mean transport time for air from the surface to the lower-mid stratosphere, which is where most ozone depletion has been observed. The 3 years is typical of the average age of air (time since air was in the troposphere; see Section 1.4.3) in these regions. Second, stratospheric halocarbon burdens are not determined by tropospheric burdens at a single time in the past. They instead represent a mean of tropospheric burdens from a range of earlier years (Hall and Plumb, 1994); this can result in errors with this simple technique especially when atmospheric mixing ratios are changing nonlinearly. Finally, Prather (1997) pointed out that the rate at which halogens are removed from the stratosphere has its own time scale in addition to the lag time associ-ated with transport of halocarbons into the stratosphere. For short-lived halocarbons such as methyl bromide, whose tropospheric abundance could decrease rapidly rel-ative to the rates at which air is transported into or out of the stratosphere, the decay of stratospheric inorganic halogen resulting from a rapid drop in tropospheric burden would be delayed and would not be well approximated by a single lag time. This effect is less important for most chlorinated ODSs because they have atmospheric life-times that are long relative to these transport rates.
Trends for EECl and EESC depend upon our under-standing of the equivalency factor for bromine (alpha (a)),
which varies over different latitudes and altitudes and is weighted by the distribution of stratospheric ozone (Daniel et al., 1999; see also Section 1.4.4). Although 45 represents a globally-weighted mean for alpha, higher estimates for this equivalency factor would suggest smaller decreases for EECl during years in which bromine continued to increase.
1.2.6 Fluorine in the Stratosphere
Measurements of hydrogen fluoride (HF) and car-bonyl fluoride (COF2), which are primarily concentrated
in the stratosphere (Zander et al., 1992), provide an esti-mate of changes in the total fluorine burden of the atmosphere (Sen et al., 1996). Although fluorine does not catalytically destroy stratospheric ozone, trends in F*y
(defined here as F*
y= [HF] + 2 ¥ [COF2]) have provided
an independent measure of changes in the abundance of ozone-depleting substances (Gunson et al., 1994; Anderson et al., 2000).
Since the previous Assessment (WMO, 1999), long-term investigations of HF and COF2have continued, both
from the ground and from space. Related Jungfraujoch results show a steady increase in column F*yuntil the
mid-1990s, and a slower rate of increase afterward (Figure 1-10; updates to Mahieu et al., 2000 and Mélen et al., 1998). Two-dimensional (2-D) model calculations that include atmospheric histories for the most abundant, anthro-pogenic F-containing gases (CFC-12, CFC-11, CFC-113, HCFC-22, Halon-1211, and Halon-1301, which all are important ODSs) reproduce the measured trends in F*y
above the Junfraujoch station reasonably well (Figure 1-10; Chipperfield et al., 1997). This consistency provides further evidence that anthropogenic ODSs undergo photo-chemical degradation in the stratosphere and are respon-sible for the large increases in stratospheric chlorine and fluorine observed during the past 20 years or more. Similar conclusions have been drawn from analyses of the near-global mean HF measurements at 55 km from HALOE (Anderson et al., 2000) and from ATMOS measurements of individual F-containing gases between 1985 and 1994 over the altitude range of 8 to 60 km (Irion et al., 2002).
1.3 HALOCARBON SOURCES ESTIMATED
FROM INDUSTRIAL PRODUCTION
The combination of halocarbon production data from both the Alternative Fluorocarbons Environmental Acceptability Study (AFEAS, 2001) and the United Nations Environment Programme (UNEP, 2002) have allowed for the first time a rigorous estimate of total global production and consumption of ozone-depleting


![Figure 1-10. Time series of monthly mean vertical column abundances of HF (open circles: update from Mahieu et al., 2000); COF 2 (open triangles: update from Mélen et al., 1998); and their weighted sum, F*y (filled triangles; where F* y = [HF] + 2×[COF 2](https://thumb-eu.123doks.com/thumbv2/123doknet/6483904.173045/24.918.88.791.100.613/figure-monthly-vertical-abundances-circles-triangles-weighted-triangles.webp)
