Correlations of longevity evaluation with type traits in
Walloon Region
S. Vanderick1, C. Croquet1,2, P. Mayeres3, H. Soyeurt1,4 and N. Gengler1,2 1Animal Science Unit, Gembloux Agricultural University, B-5030 Gembloux, Belgium
E-mail: [email protected]
2National Fund for Scientific Research, B-1000 Brussels, Belgium 3Walloon Breeding Association, B-5590 Ciney, Belgium
4 F.R.I.A. fellow
Introduction
Since May 2005, a genetic evaluation system for longevity using a lactation random regression model has been introduced for dairy cattle of Walloon Region in Belgium. How are genetic relationships between direct
longevity and type traits ?
Material
•Genetic breeding values of direct longevity
evaluated by INTERBULL
• Genetic breeding values of 16 linear type traits and 3 synthetic type traits evaluated by INTERBULL • + Predicted 14 type traits (9 linear and 5 synthetic)
Statistical analyses
Estimation of correlations between longevity and type traits using as weight the reliability of longevity breeding value.
approximated genetic correlations !!!
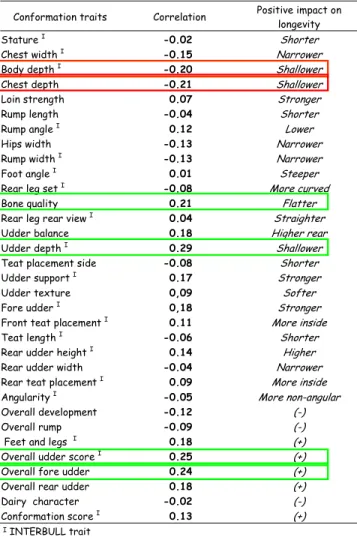
In this study, a negative correlation indicated that a higher score for the trait was associated with a shorter length of productive life, and thus with a higher risk of being culled.
Positive impact on longevity, presented in Table 1, is the impact observed on longevity if the selection of bulls is based on type traits.
Conclusions
The computed correlations show that there are important relationships between type traits and direct longevity.
Results permitted to develop combined longevity evaluations and to improve the current genetic evaluation system for longevity of the cows in our herds.
Results
« Balanced morphological animal » seems to be ideal to have a good longevity !
Type traits = good factors to predict indirect longevity
Table 1. Correlations of linear and composite type traits with direct longevity.
Conformation traits Correlation Positive impact on longevity
Stature I -0.02 Shorter
Chest width I -0.15 Narrower
Body depth I -0.20 Shallower
Chest depth -0.21 Shallower
Loin strength 0.07 Stronger
Rump length -0.04 Shorter
Rump angle I 0.12 Lower
Hips width -0.13 Narrower
Rump width I -0.13 Narrower
Foot angle I 0.01 Steeper
Rear leg set I -0.08 More curved
Bone quality 0.21 Flatter
Rear leg rear view I 0.04 Straighter
Udder balance 0.18 Higher rear
Udder depth I 0.29 Shallower
Teat placement side -0.08 Shorter
Udder support I 0.17 Stronger
Udder texture 0,09 Softer
Fore udder I 0,18 Stronger
Front teat placement I 0.11 More inside
Teat length I -0.06 Shorter
Rear udder height I 0.14 Higher
Rear udder width -0.04 Narrower
Rear teat placement I 0.09 More inside
Angularity I -0.05 More non-angular
Overall development -0.12 (-)
Overall rump -0.09 (-)
Feet and legs I 0.18 (+)
Overall udder score I 0.25 (+)
Overall fore udder 0.24 (+)
Overall rear udder 0.18 (+)
Dairy character -0.02 (-)
Conformation score I 0.13 (+)
IINTERBULL trait
Strong positive relationships Weaker negative correlations