Cellular automata urban expansion model based on
support vector machines
A. Mustafa1,3, A. Rienow2, I. Saadi1, M. Cools1, J. Teller1 1University of Liège, Liège, Belgium
Email: {a.mustafa; ismail.saadi; mario.cools; jacques.teller}@ulg.ac.be 2University of Bonn, Bonn, Germany
Email: [email protected] 3Purdue University, Indiana, USA
Email: [email protected]
Abstract
Land-use change models are used to explore the dynamics and drivers of land-use/land-cover change and to inform policies affecting such change. A broad array of applications and modeling methods are available and each type has certain advantages and disadvantages depending on the objective of the research. This work presents an approach combining cellular automata (CA) model and supported vector machine (SVM) and binary logistic regression model (Logit) for simulating urban expansion in Wallonia (Belgium). This article emphasizes the interest in comparing combining CA with conventional Logit versus combining CA with SVM method as a base of CA model transition rule.
Relative operating characteristic (ROC) and spatial matrices are used to validate the model. Model validation shows that the allocation performance of SVM outperformed CA-Logit approach.
1. Introduction
Among the numerical models which are employed to investigate urbanization process and its implications, many rely on CA approach [1–3]. CA is a dynamic discrete space and time bottom-up modelling approach. CA is widely used in land-use change modelling due to its simplicity, transparency and powerful capacities for dynamic spatial simulation [4]. Nevertheless, CA does not explicitly deal with causal factors of phenomena being modelled. Fortunately, huge research efforts have been made in order to improve CA structure. Such efforts include, but not limited to, integrating Logit [5, 6], integrating particle swarm optimization rules [2], and integrating SVM with CA [7]. The Logit allows better understanding of the factors that control urbanization process but it assumes that the occurrence probability is linearly and additively related to the causal factors on a logistic scale [8]. If the assumption cannot be satisfied, the performance may significantly degrade. The SVM is a data mining technique that can model a nonlinearity [9]. A number of scholars reported that the SVM is an effective method to model land-use changes, owing to their ability to model non-linear relationships and good generalization performance [7]. This study employs two different methods, the Logit and the SVM, to define the transition rule of the CA model for predicting urban expansion. Beside transition rules, a classical Moore neighborhood with a window of 5×5 is used to define the neighborhood effects. The
model is applied to Wallonia (Belgium) to simulate urban expansion between 2000 and 2010 using Belgian cadastral data.
2. Methodology
2.1. Study area
The study area is Wallonia (south Belgium) that accounts for 55% of the territory of Belgium with a total area of 16,844 km². It comprises five provinces: Hainaut, Liège, Luxembourg, Namur, and Walloon Brabant. The main urban areas are Charleroi, Liège, Mons and Namur. They are all characterized by a historical city-center, around which the urban development expanded. The total population in 2010 was 3,498,384 inhabitants that makes up a third of Belgium population (Fig. 1).
Figure 1. Study area.
2.2. Modelling approach
Belgian cadastral data of 2000 and 2010 are used as land-use maps for the model. The data is first rasterized at 2x2m resolution and then it was aggregated to 100x100m. The urban expansion model represented in this study contains two types of land-use classes: urban and non-urban land uses.
Changing from non-urban to urban land use is actively allocated using transition rules. For each time step, representing one year, urban developments are allocated to those locations
that have the highest potential for urbanization. Potentials are computed for each non-urban cell and based on transition rules:
urb f
P P N (1)
where Purb is the transition probability of a non-urban cell in a certain year to convert its
land-use to urban land, Pf is the probability based on the urbanization controlling factors
and N is the neighborhood effect calculated by the CA transition rules.
Pf is calculated based on two different ways: (1) the Logit and (2) the SVM. Six
explanatory variables are selected in this study (elevation, slope, proximity to highways, main roads, secondary roads and local roads). N represents the number of urban cells
amongst the Moore 5×5 neighborhood.
3. Results and discussions
The CA-SVM based and CA-Logit based models are assessed and compared by their performances in predicting urban expansion using relative operating characteristic (ROC) curve analysis and landscape matrices [10, 11]. One matrix measuring complexity (area-weighted mean shape index –AWMSI-) and one matrix measuring dispersion (patch cohesion index –PCI-) were selected to evaluate the landscape patterns. For the SVM and the Logit calibration, 4000 cells were selected randomly with a minimum distance of 500 m between each cell within the sample. All existing urban cells in 2000 are excluded from the samples. For validation procedures, different 4000 cells were randomly selected as well. Table 1 lists all results.
Table 1. Results of the accuracy assessment.
ROC Spatial matrices
AWMSI PCI
Obs. LU2010* - 8.62 96.24
CA-SVM 0.723 7.06 95.74
CA-Logit 0.688 7.00 95.70
*Observed land use in 2010
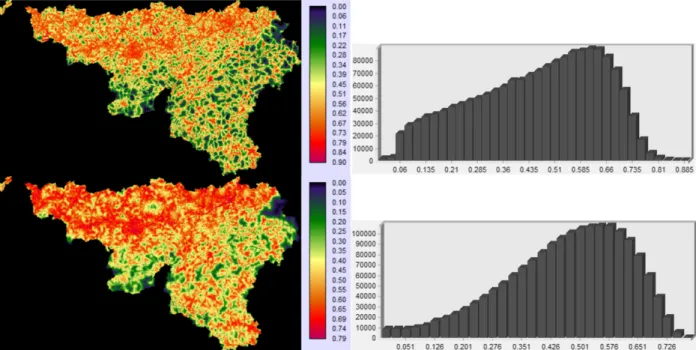
The main focus of this paper is on the resulting probability based on the urbanization controlling factors where every cell exhibits a score between 0 (lowest score) and 100 indicating its probability of being urbanized. The ROC was used for measuring the goodness-of-fit of probability maps. The ROC of the SVM model clearly outperformed Logit. Qualitative analysis of the probability maps can provide some explanation for the varying performances of the two models. Fig. 2 represents the probability maps based on the SVM and Logit. The major difference between the two maps is that transition areas between high and low probability. The Logit map renders these areas as gradual transitions whereas the SVM map renders these areas as sharp edges.
The results presented in Table 1 also show that the CA-SVM outperformed the CA-Logit in terms of landscape structural conformity. The HUEM generates urban patches close to the actual urban patches between in terms of complexity (AWMSI) and dispersion rate.
Figure 2. Probability maps and histograms of the SVM (top) and the Logit (bottom).
4. Conclusion
Urban expansion has attracted a lot of attention. This attention led to the development of a wide range of approaches and applications. In this study, we integrated a CA based model with two different methods, Logit and SVM, to set the transition rules. We have examined two main aspects of the accuracy of the model: (i) the goodness-of-fit of probability maps and (ii) landscape structural conformity in terms of complexity and dispersion. The results show that the overall accuracy rate of the SVM is better than the Logit. Coupling CA urban expansion models with SVM or Logit enables the simultaneous dynamic simulation of urbanization process along with the analyses of a number of controlling factors that determine local urbanization suitability. Our next challenge is to integrate various urban states (low-dense, medium-dense, high-dense) and additional factors (e.g., employment rate, population density, policies) into the model.
Acknowledgment
The research was funded through the ARC grant for Concerted Research Actions, financed by the Wallonia-Brussels Federation.
References
[1] Aljoufie M., Zuidgeest M., Brussel M., van Vliet J., van Maarseveen M. (2013). A cellular automata-based land use and transport interaction model applied to Jeddah, Saudi Arabia. Landsc. Urban Plan. 112, 89–99.
[2] Feng Y., Liu Y., Tong X., Liu M., Deng S. (2011). Modeling dynamic urban growth using cellular automata and particle swarm optimization rules. Landsc. Urban Plan. 102, 188–196.
[3] Han J., Hayashi Y., Cao X., Imura H. (2009). Application of an integrated system dynamics and cellular automata model for urban growth assessment: A case study of Shanghai, China. Landsc. Urban Plan. 91, 133–141.
[4] Clarke K.C., Gaydos, L.J. (1998). Loose-coupling a cellular automaton model and GIS: long-term urban growth prediction for San Francisco and Washington/Baltimore. Int. J. Geogr. Inf. Sci. 12, 699–714.
[5] Munshi T., Zuidgeest,M., Brussel M., van Maarseveen M. (2014). Logistic regression and cellular automata-based modelling of retail, commercial and residential development in the city of Ahmedabad, India. Cities. 39, 68–86.
[6] Puertas O.L., Henríquez C., Meza F.J. (2014). Assessing spatial dynamics of urban growth using an integrated land use model. Application in Santiago Metropolitan Area, 2010–2045. Land Use Policy. 38, 415–425.
[7] Rienow A., Goetzke R. (2015). Supporting SLEUTH – Enhancing a cellular
automaton with support vector machines for urban growth modeling. Comput. Environ. Urban Syst. 49, 66–81.
[8] Cheng J., Masser I. (2003). Urban growth pattern modeling: a case study of Wuhan city, PR China. Landsc. Urban Plan. 62, 199–217.
[9] Martens D., Baesens B., Van G., Vanthienen J. (2007). Comprehensible credit scoring models using rule extraction from support vector machines. Eur. J. Oper. Res. 183, 1466– 1476.
[10] Liu X., Li X., Shi X., Wu S., Liu T. (2008). Simulating complex urban development using kernel-based non-linear cellular automata. Ecol. Model. 211, 169–181.
[11] Mustafa A., Saadi I., Cools M., Teller J. (2014). Measuring the Effect of Stochastic Perturbation Component in Cellular Automata Urban Growth Model. Procedia Environ. Sci. 22, 156–168.