Universit´
e de Montr´
eal
Evaluating perceptual maps of asymmetries for
gait symmetry quantification and pathology
detection
par
Antoine Moevus
D´epartement d’informatique et de recherche op´erationnelle
Facult´e des arts et des sciences
M´emoire pr´esent´e `a la Facult´e des arts et des sciences
en vue de l’obtention du grade de Maˆıtre `es sciences (M.Sc.)
en informatique
Decembre, 2014
c
Universit´
e de Montr´
eal
Facult´e des arts et des sciences
Ce m´emoire intitul´e:
Evaluating perceptual maps of asymmetries for
gait symmetry quantification and pathology
detection
pr´esent´e par:
Antoine Moevus
a ´et´e ´evalu´e par un jury compos´e des personnes suivantes:
—————————————————-Derek Nowrouzezahrai
pr´esident-rapporteur
—————————————————-Max Mignotte & Jean Meunier
directeur de recherche
—————————————————-Roland Memisevic
R´
ESUM´
E
Le mouvement de la marche est un processus essentiel de l’activit´e humaine et
aussi le r´esultat de nombreuses interactions collaboratives entre les syst`emes
neuro-logiques, articulaires et musculo-squelettiques fonctionnant ensemble efficacement.
Ceci explique pourquoi une analyse de la marche est aujourd’hui de plus en plus
utilis´ee pour le diagnostic (et aussi la pr´evention) de diff´erents types de maladies
(neurologiques, musculaires, orthop´edique, etc.). Ce rapport pr´esente une nouvelle
m´ethode pour visualiser rapidement les diff´erentes parties du corps humain li´ees `a
une possible asym´etrie (temporellement invariante par translation) existant dans
la d´emarche d’un patient pour une possible utilisation clinique quotidienne.
L’ob-jectif est de fournir une m´ethode `a la fois facile et peu dispendieuse permettant la
mesure et l’affichage visuel, d’une mani`ere intuitive et perceptive, des diff´erentes
parties asym´etriques d’une d´emarche. La m´ethode propos´ee repose sur l’utilisation
d’un capteur de profondeur peu dispendieux (la Kinect) qui est tr`es bien adapt´ee
pour un diagnostique rapide effectu´e dans de petites salles m´edicales car ce capteur
est d’une part facile `a installer et ne n´ecessitant aucun marqueur. L’algorithme que
nous allons pr´esenter est bas´e sur le fait que la marche saine poss`ede des propri´et´es
de sym´etrie (relativement `a une invariance temporelle) dans le plan coronal.
Mots clefs :
Analyse de la sym´etrie de la marche, Kinect, trouble locomoteur,
po-sitionnement multidimensionnel (MDS), r´eduction de dimensionnalit´e non lin´eaire,
carte de couleur perceptuelle, invariance par d´ecalage temporel.
ABSTRACT
The gait movement is an essential process of the human activity and also the
result of coordinated effort between the neurological, articular and musculoskeletal
systems. This motivates why gait analysis is important and also increasingly used
nowadays for the (possible early) diagnosis of many different types (neurological,
muscular, orthopedic, etc.) of diseases. This paper introduces a novel method to
quickly visualize the different parts of the body related to an asymmetric movement
in the human gait of a patient for daily clinical. The goal is to provide a cheap
and easy-to-use method to measure the gait asymmetry and display results in a
perceptually relevant manner. This method relies on an affordable consumer depth
sensor, the Kinect. The Kinect was chosen because this device is amenable for use
in small, confined area, like a living room. Also, since it is marker-less, it provides
a fast non-invasive diagnostic. The algorithm we are going to introduce relies on
the fact that a healthy walk has (temporally shift-invariant) symmetry properties
in the coronal plane.
Keywords :
Gait asymmetry analysis, Kinect, loco-motor disorders,
multidimen-sional scaling (MDS), nonlinear dimenmultidimen-sionality reduction, perceptual color map,
temporal shift-invariance.
TABLE DES MATI`
ERES
R´
ESUM´
E
. . . .
iii
ABSTRACT
. . . .
iv
TABLE DES MATI`
ERES
. . . .
v
LISTE DES FIGURES
. . . vii
LISTE DES TABLEAUX
. . . viii
LISTE DES ALGORITHMES
. . . .
ix
LISTE DES SIGLES
. . . .
x
CHAPITRE 1 : INTRODUCTION AND STATE OF THE ART
. .
1
1.1
Introduction . . . .
1
1.2
Previous work . . . .
2
1.3
References . . . .
6
CHAPITRE 2 : EVALUATING PERCEPTUAL MAPS OF
ASYM-METRIES FOR GAIT SYMMETRY
QUANTIFI-CATION AND PATHOLOGY DETECTION
. . . .
9
2.1
Introduction . . . .
10
2.2
Previous Work
. . . .
10
2.3
Data Description . . . .
12
2.4
Method . . . .
12
2.4.1
Setup Phase . . . .
12
2.4.2
Silhouette Segmentation . . . .
14
2.4.3
Dimensionality Reduction . . . .
15
2.4.4
Color Space Conversion
. . . .
17
2.6
Conclusion . . . .
19
2.7
Acknowledgments . . . .
20
2.8
References . . . .
21
ANNEXE A : Implementation Notes
. . . .
23
Importing Data
. . . .
23
Clipping Step
. . . .
23
ANNEXE B
. . . .
26
Correlation Metric
. . . .
26
ANNEXE C
. . . .
27
Asymmetry Map Stochastic Local Refinement
. . . .
27
ANNEXE D
. . . .
28
Embc’14 Poster
. . . .
28
ANNEXE E
. . . .
29
Local Symmetry Detection in Natural Images using a Particle
Filte-ring Approach
. . . .
29
LISTE DES FIGURES
1.1 Example of two depth signals for a gait cycle of a patient. . . .
5
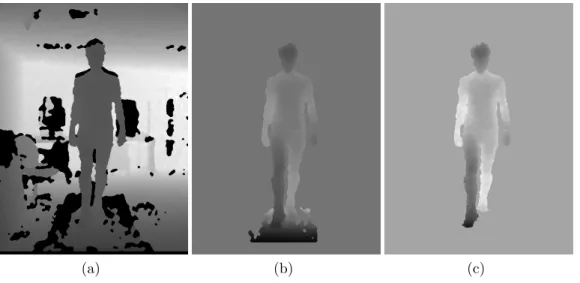
2.1 Setup and pre-processing steps. (a) Original depth map. (b) After
clipping. (c) After treadmill removal. . . .
15
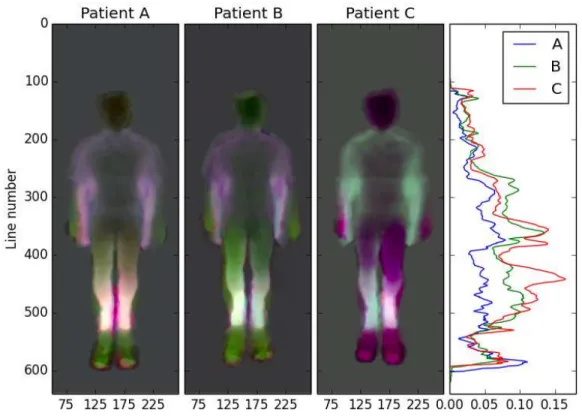
2.2 Asymmetry map for subject #15, one of the best result of the dataset.
ASI is 0.03082 for normal gait, 0.04740 for left asymmetry, and
0.05266 for right asymmetry.
. . . .
18
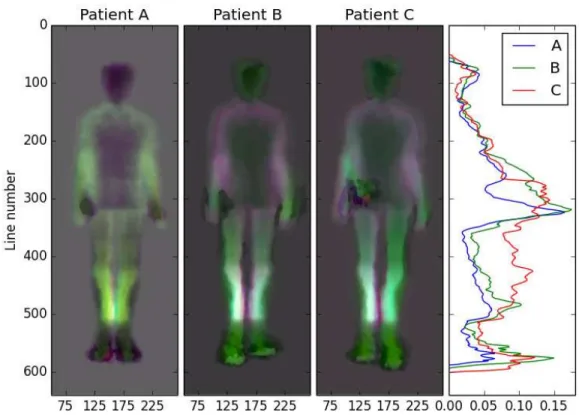
2.3 Asymmetry map for subject #05, one of the best result of the dataset.
ASI is 0.04164 for normal gait, 0.05858 for left LLD, and 0.06824
for right LLD. With the right LLD (case C), the asymmetry of arm
swing is clearly noticeable. . . .
19
2.4 Asymmetry map for subject #09, the worst result of the dataset. The
corresponding ASI are 0.05672 for normal gait, 0.05166 for left LLD,
and 0.04625 for right LLD. The patient had naturally a strong arm
swing but a sole on the left foot seems to help rectifying it. . . .
20
2.5
(a) An input image where non-patient pixels where naively clipped to
zero. The high contrast makes details harder to see. (b) An input image
where non-patient pixels where clipped to the mean value of patient’s
pixels for the whole sequence. More details are visible. (c) The distribution
of the pixel values of the image for the naive clipping (semi-log scale). (d)
The distribution of the pixel values of the image for the smart clipping
(semi-log scale). It is important to notice that the whole point of using
a default clipping value is to make the distribution of pixel value of the
images unimodal and continuous. This will ensure a well contrasted map
that is visually significant for human eye.
. . . .
25
LISTE DES TABLEAUX
LIST OF ALGORITHMS
LISTE DES SIGLES
2D
Two dimensions
3D
Three dimensions
3DGA
3D gait analysis
ASI
Asymmetry Index
DEI
Depth Energy Image
GA
Gait Analysis
IR
Infrared Red
LLD
Length Leg Discrepancy
MDS
Multi-Dimensional Scaling
CHAPITRE 1
INTRODUCTION AND STATE OF THE ART
1.1
Introduction
Scientists and medical communities have been interested in the analysis of gait
movement for a long time, because, as mentioned in [1,2,3] symmetrical gait is
expected in the case of healthy people, whereas asymmetrical gait is a common
feature of subjects with loco-motor disorders.
Abnormal or atypical gait can be caused by different factors, either orthopedic
(hip injuries [4], bone malformations, etc.), muscular, or neurological (Parkinson’s
disease, stroke [5], etc.). Consequently, different parts of the body can be involved
or affected, which make gait analysis a complex procedure but also a reliable and
accurate indicator for early detection (and progression) of a wide range of
patho-logies. It thus also makes a 3D gait analysis (3DGA) procedure a powerful early
clinical diagnostic tool [6] that is reliable and non-invasive, and which has been
used successfully until now for a first screening test, detection and tracking of
di-sease progression, joint deficiencies, pre-surgery planning, as well as recovery from
post-operative surgery or accident (rehabilitation). It is also worth mentioning that
a gait analysis-based diagnostic tool also allows to reduce the costs and amount
of surgery per patient [7]. Also, a more appropriate medical prescription can be
made by performing a gait analysis before treating a patient. This leads to a better
recovery for the patients [6].
But nowadays, with the aging population, clinical diagnostics have to be
chea-per, faster and more convenient for clinical [8,9,10] (or home [11]) usage while
remaining accurate. However, analyzing a gait video sequence is often difficult,
re-quires time, and subtle anomalies can be omitted by the human eye. Also, videos
are not easy to annotate, store and share.
In this work, we design both a reliable and accurate imaging system that is also
cheap and easy to set up for daily clinical usage. This diagnostic tool is relying
on the fact that the gait of healthy people is symmetrical in the coronal (front)
plane (with half a period phase shift) and that asymmetrical gait may be a good
indicator of pathologies (and its progression over different periods of time) [1,2,3,5].
More precisely, the goal of our proposed GA-based diagnostic tool is to evaluate
a perceptual color map of asymmetries from a video acquired by a depth sensor
(Kinect) of a patient walking on a treadmill. The recording plane was the coronal
plan in order to exploit the temporally shift-invariant properties of the movement.
A perceptual color map of asymmetries is the compression of a patient’s video
mapped into a color image in such manner that asymmetries of the body parts
related to an asymmetric movement in the human gait cycle may be clearly visible
and immediately quantifiable.
1.2
Previous work
Current 3DGA techniques can be divided in two categories : with or without
markers.
Among the state-of-the-art marker-based approach, the Vicon motion-tracking
and capture system [12] offers millimeter resolution of 3D spatial displacements.
Due to its accuracy, it is often used as ground-truth for validation in medical
application. On the other hand, the high cost of this system inhibits its widespread
usage for routine clinical practices. Basically, optical motion capture system consists
in tracking infrared (IR) reflective markers with multiple IR cameras [13]. In this
context, some recent work [8] has compared a cheap and simple motion capture
system to a high-end system such as Vicon, since the accuracy of higher-end systems
is often more than required. They found that the cheaper motion capture hardware
provides reliable results for clinical usage, but that the software given by the system
was a limitation on the accuracy of the acquisition and the analysis of the results.
That was because the software was not designed for medical application. Optical
Motion capture is efficient, but requires a lot of space, time, and expertise to
be installed and used. For instance, placing the markers on the patient is prone
to localization errors and requires someone who understands both the patient’s
anatomy and the acquisition system. Also the patient might have to wear a special
suit and change outfits, which is constraining both for the patient and for the
physician.
Therefore, marker-less systems are a promising alternative for clinical
environ-ments and are often regarded as easy-to-set-up, easy-to-use, and non-invasive. They
are either based on either stereo-vision [14], structured light [15], or time-of-flight
(TOF) [16] technologies. As a stereo-vision application, [17] used two camcorders
to extract 3D information of the patients and to measure the gait parameters.
Al-though low-cost, the setup and calibration procedure of the system remains complex
and only the lower parts of the body are measured. Also, stereo vision-based
sys-tems will not function properly if the patient’s outfits lack of texture. However,
the Kinect sensor is based on structured light technology which makes it robust to
surfaces with no textures. The Kinect remains also compact and affordable. Recent
researches have been conducted to test whether the Kinect is suitable for clinical
usage or not. The Kinect has two output modes : depth map or skeleton modes.
The former consists of an image sequence where the value of each pixel is
propor-tional to the inverse of the depth, whereas the latter is a set of 3D points and edges
that represents 20 joints of the human body.
Clark et. al. [18] used the skeleton mode to measure spatial-temporal gait
varia-bility (such as the stride duration, speed, etc.) and compared it with data acquired
by the high-end Vicon MX system. They found encouraging results but important
landmarks were missing on the foot and therefore they conclude that gait
parame-ters have to be chosen carefully. In addition, the Kinect camera was placed facing
the patient, without a treadmill. Therefore the system was based on the analysis of
only one gait cycle, because the intrinsic working range of the Kinect depth sensor
is between 800mm and 4000mm. This somehow compromised the accuracy and the
reliability of their system.
[11] also used the skeleton mode to perform a 3DGA. They made people wear
wireless sensors (gyroscopes and pressure sensors) at movement points and walk
back and forth along a straight path for approximately 7 minutes. They found that
the Kinect was capable of providing accurate and robust results, but only a few
gait parameters were tested and further research is under investigation. Finally, it
is worth mentioning that none of the methods, using the Kinect skeleton mode,
provide a visual feedback of the gait of the patient.
In [19], the authors compared the Kinect with depth map output mode versus a
Vicon system. They place 2 Kinects in a different alignment with the subject (facing
and on the side) and measured key gait parameters, such as stride duration and
length, and speed. They found excellent results with an average difference of less
than 5% for both Kinect camera setups. They also found that using the depth map
data allows to reduce drastically the computation time for background removal.
In [10], the authors proposed to use a treadmill and a Kinect depth sensor to
quantify the gait asymmetry with a low-cost gait analysis system. More precisely,
the authors compute an index for quantifying possible asymmetries between the
two legs by first dividing each gait cycle in two sub-cycles (relative to the left
and right step sub-cycle), and by comparing these two sub-cycles, in term of an
asymmetry index (proportional to the difference of depth, over a gait cycle, between
the two legs) after a rough spatial and temporal registration procedure. Although
the system is able to distinguish whether the patient has a symmetric walk or not,
no visualization or information on the location of the asymmetries is provided,
unlike our method.
In [9], the Kinect camera is placed at the back of a treadmill and is used to
record a video sequence of the patient walk. The authors then simply compute the
mean of the obtained depth image sequence (over a gait cycle or a longer period)
in order to compress the gait image sequence into one image which is finally called
a depth energy image (DEI). Their results were conclusive since they were able
to distinguish both visually and quantitatively asymmetries (a symmetric walk
generating a DEI exhibiting a symmetric silhouette, in terms of mean depth and
conversely). Nevertheless, this latter strategy is inherently inaccurate since taking
the average (mean) depth over a gait cycle does not allow to detect all asymmetric
body movements ; indeed, movement variation of some parts of the body can clearly
be different and asymmetric while keeping the same mean (in term of mean depth).
Fig. 1.1: Example of two depth signals for a gait cycle of a patient.
In our work, the depth image sequence of the gait, containing a number of gait
cycles (wherein each pixel of the video corresponds to a depth signal as a function of
time, as shown in Fig. 1.1) is reduced to three dimensions with a Multi-Dimensional
Scaling (MDS) mapping [20] using a temporally shift invariant Euclidean distance.
This allows us to quickly display the gait image cube into an informative color
image (with red, green and blue channels) allowing to visualize the asymmetric
body parts of the gait cycle of a patient with a color difference, in a perceptual
color space, which is linearly related to the asymmetry magnitude.
This appealing property is crucial in our case and only respected in the case of
the MDS reduction strategy (contrary to all the other existing dimension reduction
techniques) which attempts to find an embedding from the initial feature vectors
in the high dimensional space such that pairwise distances are preserved in a low
dimensional space (as main criterion) via the minimization of the so-called stress
function
1.
1.3
References
[1] J. R. Engsberg, K. G. Tedford, J. A. Harder, and J. P. Mills, “Timing
changes for stance, swing, and double support in a recent below-knee-amputee
child.” Pediatric Exercise Science, vol. 2, no. 3, 1990.
[2] J. Loizeau, P. Allard, M. Duhaime, and B. Landjerit, “Bilateral gait patterns
in subjects fitted with a total hip prosthesis,” Archives of physical medicine and
rehabilitation, vol. 76, no. 6, pp. 552–557, 1995.
[3] J. Hamill, B. Bates, and K. Knutzen, “Ground reaction force symmetry
during walking and running,” Research Quarterly for Exercise and Sport, vol. 55,
no. 3, pp. 289–293, 1984.
[4] H. Miki, N. Sugano, K. Hagio, T. Nishii, H. Kawakami, A. Kakimoto, N.
Na-kamura, and H. Yoshikawa, “Recovery of walking speed and symmetrical movement
of the pelvis and lower extremity joints after unilateral tha,” Journal of
Biomecha-1Let us recall that MDS is formulated as an optimization problem, where the solution is found as a minimizer of the following cost function also called the stress function :ˆ u = arg minuPs,t s6=t ³ βs,t− ° °us− ut) ° ° ´2 (1.1) where the summationP
s,ts6=tis over all the pairs of sites. βs,tand
°
°us−ut) °
°denote, respectively, the Euclidean distance associated between the two initial feature vectors s and t in the full dimensional space and between the two feature vectors us and ut in the low dimensional (or reduced) space.
nics, vol. 37, no. 4, p. 443 455, Apr 2004.
[5] L. D. Alexander, S. E. Black, K. K. Patterson, F. Gao, C. J. Danells, and
W. E. McIlroy, “Association between gait asymmetry and brain lesion location in
stroke patients,” Stroke, vol. 40, no. 2, pp. 537–544, 2009.
[6] T. A. Wren, G. E. Gorton III, S. Ounpuu, and C. A. Tucker, “Efficacy of
clinical gait analysis : a systematic review,” Gait & posture, vol. 34, no. 2, pp.
149–153, 2011.
[7] T. A. Wren, M. M. Kalisvaart, C. E. Ghatan, S. A. Rethlefsen, R. Hara,
M. Sheng, L. S. Chan, and R. M. Kay, “Effects of preoperative gait analysis on
costs and amount of surgery,” Journal of Pediatric Orthopedics, vol. 29, no. 6, pp.
558–563, 2009.
[8] B. Carse, B. Meadows, R. Bowers, and P. Rowe, “Affordable clinical gait
analysis : An assessment of the marker tracking accuracy of a new low-cost optical
3d motion analysis system,” Physiotherapy, vol. 99, no. 4, pp. 347 – 351, 2013.
[9] C. Rougier, E. Auvinet, J. Meunier, M. Mignotte, and J. A. de Guise,
“Depth energy image for gait symmetry quantification,” in Engineering in
Me-dicine and Biology Society, EMBC, 2011 Annual International Conference of the
IEEE. IEEE, 2011, pp. 5136–5139.
[10] E. Auvinet, F. Multon, and J. Meunier, “Lower limb movement asymmetry
measurement with a depth camera,” in Engineering in Medicine and Biology Society
(EMBC), 2012 Annual International Conference of the IEEE, Aug 2012, pp. 6793–
6796.
[11] M. Gabel, R. Gilad-Bachrach, E. Renshaw, and A. Schuster, “Full body
gait analysis with kinect,” in Engineering in Medicine and Biology Society (EMBC),
2012 Annual International Conference of the IEEE. IEEE, 2012, pp. 1964–1967.
[12] “Motion capture systems from vicon.”
http ://www.vicon.com/
of asymmetry in able-bodied gait with the concept of propulsion and brake,” in 9th
Symposium on 3D Analysis of Human Movement, Valenciennes, France, 2006.
[14] N. Lazaros, G. C. Sirakoulis, and A. Gasteratos, “Review of stereo vision
al-gorithms : from software to hardware,” International Journal of Optomechatronics,
vol. 2, no. 4, pp. 435–462, 2008.
[15] J. Salvi, J. Pages, and J. Batlle, “Pattern codification strategies in
struc-tured light systems,” Pattern Recognition, vol. 37, no. 4, pp. 827–849, 2004.
[16] M. Hansard, S. Lee, O. Choi, and R. Horaud, Time-of-flight cameras.
Springer, 2013.
[17] A. Leu, D. Ristic-Durrant, and A. Graser, “A robust markerless
vision-based human gait analysis system,” in Applied Computational Intelligence and
Informatics (SACI), 2011 6th IEEE International Symposium on, May 2011, pp.
415–420.
[18] R. A. Clark, K. J. Bower, B. F. Mentiplay, K. Paterson, and Y.-H. Pua,
“Concurrent validity of the Microsoft Kinect for assessment of spatiotemporal gait
variables,” Journal of biomechanics, vol. 46, no. 15, pp. 2722–2725, 2013.
[19] E. E. Stone and M. Skubic, “Evaluation of an inexpensive depth camera
for passive in-home fall risk assessment.” in PervasiveHealth, 2011, pp. 71–77.
CHAPITRE 2
EVALUATING PERCEPTUAL MAPS OF ASYMMETRIES FOR
GAIT SYMMETRY QUANTIFICATION AND PATHOLOGY
DETECTION
Cet article a ´et´e publi´e comme l’indique la r´ef´erence bibliographique et est
pr´esent´e ici, tel quel, dans la langue originale de publication :
c
°2014 Antoine Moevus, de :
A. Moevus, M. Mignotte, J. de Guise, J. Meunier
,
“Evaluating perceptual maps of asymmetries for gait symmetry
quan-tification and pathology detection”,
36th International Conference of the IEEE Engineering in Medicine
and Biology Society, EMBC’2014, Chicago, Illinois, USA, Aout 2014.
De plus, la version longue de cet article (non pr´esent´ee ici) est actuellement en
cours de soumission `a un journal scientifique pour publication.
Abstract
The gait movement is a complex and essential process of the human activity.
Yet, many types of diseases (neurological, muscular, orthopedic, etc.) can be
diag-nosed from the gait analysis. This paper introduces a novel method to quickly
visualize the different body parts related to an (temporally shift-invariant)
asym-metric movement in the human gait of a patient for daily clinical usage. The goal
is to provide a cheap and easy-to-use method that measures the gait asymmetry
and display results in a perceptual and intuitive way. This method relies on an
af-fordable consumer depth sensor, the Kinect, which is very suitable for small room
and fast diagnostic, since it is easy to setup and marker-less.
2.1
Introduction
Scientists and medical communities have been interested in the analysis of gait
movement for a long time, because, as mentioned in [1,2,3] symmetrical gait is
expected in the case of healthy people, whereas asymmetrical gait is a common
feature of subjects with loco-motor disorders.
Abnormal or atypical gait can be caused by different factors, either orthopedic
(hip injuries [4], bone malformations, etc.), muscular, or neurological (Parkinson’s
disease, stroke, etc.). Consequently, different parts of the body can be involved or
affected, which make gait analysis a complex procedure. Nevertheless, gait
analy-sis remains a powerful early clinical diagnostic tool that is easy to perform and
non-invasive, and has been used until now for detection and tracking of disease
progression, joint deficiencies, pre-surgery planning, as well as recovery from
post-operative surgery or accident.
But nowadays, with the aging population, clinical diagnostics have to be
chea-per, faster and more convenient, while remaining accurate. However, analyzing a
gait video sequence is often difficult, requires time, and subtle anomalies can be
omitted. Also, videos are not easy to annotate, store and share. The goal of the
proposed diagnostic tool is to evaluate a perceptual color map of asymmetries from
a video, acquired by a depth sensor (Kinect), and recorded in the coronal (front)
plane of a patient walking on a treadmill. A perceptual color map of asymmetries
is the compression of a patient’s video mapped into a color image in such manner
that asymmetries of the body parts related to an (temporally shift-invariant)
asym-metric movement in the human gait cycle may be clearly visible and immediately
quantifiable.
2.2
Previous Work
One popular method for gait analysis is motion capture [11] which consists in
tracking infrared (IR) reflective markers with multiple IR cameras. This method is
effective but requires a lot of space to be set up along with lots of expertise and
time and effort to be installed and used.
In [6], the authors proposed to also use a treadmill and a Kinect depth sensor to
quantify the gait asymmetry with a low-cost gait analysis system. More precisely,
the authors compute an index for quantifying possible asymmetries between the
two legs by first dividing each gait cycle in two sub-cycles (relative to the left
and right step sub-cycle), and by comparing these two sub-cycles, in term of an
asymmetry index (proportional to the difference of depth, over a gait cycle, between
the two legs) after a rough spatial and temporal registration procedure. Although,
the system is able to distinguish whether the patient has a symmetric walk or not,
no visualization or information on the location of the asymmetries is provided,
unlike our method.
In [10], the Kinect camera is placed at the back of a treadmill and is used to
record a video sequence of the patient walk. The authors then simply compute the
mean of the obtained depth image sequence (over a gait cycle or a longer period)
in order to compress the gait image sequence into one image which is finally called
a depth energy image (DEI). Their results were conclusive since they were able
to distinguish both visually and quantitatively asymmetries (a symmetric walk
generating a DEI exhibiting a symmetric silhouette, in terms of mean depth and
conversely). Nevertheless, this latter strategy is inherently inaccurate since taking
the average (mean) depth over a gait cycle does not allow to detect all asymmetric
body movements ; indeed, movement variation of some parts of the body can clearly
be different and asymmetric while keeping the same mean (in term of mean depth).
In our work, the depth image sequence of the gait, containing a number of gait
cycles (and wherein each pixel of the video corresponds to a depth signal, as a
function of time) is reduced to three dimensions with a Multi-Dimensional Scaling
(MDS) mapping [12] using a temporally shift invariant Euclidean distance. This
allows us to quickly display the gait image cube into an informative color image
(with red, green and blue channels) allowing to visualize the asymmetric body parts
of the gait cycle of a patient with a color difference, in a perceptual color space,
which is even greater than the asymmetry is large in magnitude.
2.3
Data Description
The dataset consists of multiple sequences of people walking on a treadmill,
facing a cheap depth sensor (Kinect). The Kinect sensor outputs 30 depth maps
per second (30 f ps), with a resolution of 640 per 480 pixels. The dataset contains
51 sequences acquired from 17 subjects walking with or without simulated length
leg discrepancy (LLD). Every patient had to walk normally (group A), then with
a 5 cm sole under the left foot (group B), then with the sole under the right foot
(group C). Sequences are approximately 5 minutes long and contain around 180
gait cycles. For all sequences, the same relative position between the treadmill and
the sensor is kept in order for the subject to be within the same area of images.
2.4
Method
In addition to a prerequisite setup step, the method can be divided into three
steps : pre-processing, MDS-based dimensionality reduction and color space
conver-sion.
2.4.1
Setup Phase
Since the scene took place in a non-cluttered room where the treadmill is in the
same position relatively to the camera, a 3D bounding box around the subjects can
be set. Hence, by retrieving 3D information, such as the position of the treadmill
or the patient, we can convert this information back in the 2D image space and
segment the patient’s silhouette directly from a depth map.
Therefore, the setup step is to, first, determine the 3D position of the treadmill
and the patient by converting a depth map in a 3D point cloud. To do so, the
depth sensor is reasonably considered as a pinhole camera model with intrinsic
parameters, K, (see [5,p.30]) defined as :
K =
f 0 c
u0 f c
v0 0
1
=
575.82
0
240
0
575.82 320
0
0
1
(2.1)
where f is the focal length in pixels and (c
u, c
v) is the image center in pixels (values
given by the manufacturer). From a depth map, a pixel at position (u, v)
Twith
depth value, d is projected in 3D space, (X, Y, Z)
T, using :
X
Y
Z
= dK
−1
u
v
1
= d
1/f ∗ (u − c
u)
1/f ∗ (v − c
v)
1
(2.2)
First, the positions of the points around the patient, approximated by a 3D
bounding box, is first estimated. Second, the minimal and maximal depth, Z
minand Z
max, of the 8 points (of the bounding box) are then retrieved. Third, the 8
points were projected back in the 2D image space (see [5,p.30]) where the minimal
and maximal vertical and horizontal 2D position value (u
min, u
max, v
min, and v
max)
are finally estimated.
The necessity of working in 3D space is because of the spatial coherence of
objects in the scene. For instance, in 3D space the treadmill is always beneath the
subject whereas in an image it overlaps the patient, as shown in Fig. 2.1b. Once
this step is done, it is no more necessary to project the depth maps in the 3D space
as long as the camera and the treadmill stay at the same relative position. In our
case, some small adjustments on the enclosing parameters, u
min, u
max, v
min, v
max,
2.4.2
Silhouette Segmentation
Now with the required information, the patient can be segmented in each frame
of the original gait depth sequence (of N frames).
2.4.2.1
Background removal
Background removal is trivial since the subject is in the middle of the image
in a non-cluttered room. Therefore, every pixel outside the range of the enclosing
parameters around the subject are clipped to a default value.
2.4.2.2
Treadmill removal
After background removal, the only objects remaining in the image are the
treadmill and the patient. Because the treadmill is below the patient, it can be
removed by selecting pixel with coordinates superior to a threshold (Y axis is
going from top to bottom) and clip them. An equation in the 2D-space can be
derived from Eq. (2.2) in order to work directly on the image :
Y < T
y(2.3)
d
f
(v − c
v) < T
y(2.4)
v <
f T
yd
+ c
v,
since d > 0 and f > 0
(2.5)
where T
yis the threshold value measured during the setup phase and d is the depth.
Fig. 2.1 visually shows the different steps of the setup and pre-processing stage.
2.4.2.3
Filtering
Finally, the whole sequence is filtered with a 3D (5 × 5) median filter to remove
some aberrations on the contours or on top of the treadmill.
(a) (b) (c)
Fig. 2.1: Setup and pre-processing steps. (a) Original depth map. (b) After clipping.
(c) After treadmill removal.
2.4.3
Dimensionality Reduction
The MDS dimensionality reduction-based mapping technique [12] aims at
vi-sualizing the (temporally shift-invariant) asymmetric body parts of the gait cycle
of a patient with a color difference, in a perceptual color space, which is linearly
re-lated to the asymmetry magnitude
0This mapping is achieved by considering each
pair of pixels (i.e., pair of N -dimensional depth signals) in the original gait video
sequence and by quantifying their (temporally shift-invariant) degree of
asymme-try with a temporally shift-invariant pairwise Euclidean distance d
tsibetween each
pair (s
1(t), s
2(t)) of depth signals :
d
tsi(s
1, s
2) = min
∀τn
¡
NX
t=0s
1(t + τ ) − s
2(t)
¢
2o
(2.6)
where the maximal value of τ corresponds approximately to the number of frames
in a gait cycle.
0let us recall that this appealing property is crucial in our case and only respected in the case of the MDS reduction strategy which preserves the between-object (or depth signal) distances as well as possible.
In addition, four points are important to consider in this step :
1. First, it is important to understand that the use of the shift-invariant pairwise
Euclidean distance is crucial in this MDS-based mapping step. Indeed, two
pixels in the gait video cube, i.e., two depth signals (as a function of the time)
with a perfect similar movement but in phase opposition (phase difference of
half a gait cycle) like the legs and arms will have to be considered as symmetric
with the same (perceptual) color in the final asymmetry map.
2. Second, in order to finally provide a final perceptual color asymmetry
vi-sualization map, the MDS mapping is achieved in a perceptual color space,
namely the classical CIE 1976 L
∗, a
∗, b
∗(LAB) color space which is
approxi-mately perceptually uniform. In this color space, a color difference shall
(per-ceptually) appear twice as large for a measured (temporally shift-invariant)
asymmetry value which is twice bigger.
3. Third, as already said, MDS is a dimensionality reduction technique that
maps objects lying in an original high N dimensional space to a lower
di-mensional space (3 in our application), but does so in an attempt that the
between-object distances are preserved as well as possible. The original MDS
algorithm is not appropriate in our application and more generally for all
large scale applications because it requires an entire N × N distance matrix
to be stored in memory (with a O(N
3) complexity). Instead, the FastMap [7]
is a fast alternative to the MDS that we have adopted herein with a linear
complexity O(pN ) (with p = 3, the dimensionality of the target space)
1.
4. The above-mentioned FastMap-based mapping method, which exploits an
algebraic procedure [8], has the main advantage of being very fast (for large
scale applications) but slightly less accurate than a (gradient descent or local
stochastic search-based) optimization procedure [8]. For this reason, we decide
1In FastMap, the axis of target space are then constructed dimension by dimension. More precisely, it implicitly assumes that the objects are points in a p-dimensional Euclidean space and selects a sequence of p ≤ N orthogonal axes defined by distant pairs of points (called pivots) and computes the projection of the points onto the orthogonal axes.Tab. 2.1: Average and SD (σ) of the ASI for the 17 patients
Normal gait
Left LLD Right LLD
Average
0.045374
0.053549∗
0.055936∗
σ
0.008080
0.006274
0.009451
*Paired difference t-test is statistically significant (p ≪ 0.01)
to refine the estimated asymmetry map given by the FastMap as being the
initial starting solution of a stochastic local search (using a local exploration
around the current solution and the Metropolis criteria) as proposed in [8].
2.4.4
Color Space Conversion
It is important to mention that, at this stage, we are not assured that the LAB
color values of the 3D asymmetry map are not saturated in the RGB space. In
order to fix this problem, we use a simple linear stretching of the L, A, B color
values such as L ∈ [0 : 100], and A, B have a maximal amplitude of 100 with a zero
mean in order to ensure that a very small number of pixels are outside the RGB
color space [8].
2.5
Experimental Results
This section presents the asymmetry maps obtained for patients with or without
(simulated) pathologies. Sequences of 300 frames have been used (longer sequences
did not yield better results). This corresponds approximately to 5 or 8 gait cycles
depending on the subject’s speed and step size. On average for all images, the
correlation score [8] for the compression of 300 frames to 3 channels is 93.5% ± 2%
which shows us that the FastMap-based MDS procedure is able to preserve, due
to its non-linearity property, a large quantity of information of the original image
sequence.
Fig. 2.2: Asymmetry map for subject #15, one of the best result of the dataset.
ASI is 0.03082 for normal gait, 0.04740 for left asymmetry, and 0.05266 for right
asymmetry.
2.4, but also quantitatively. To do so, the mean of biggest mirrored differences
2is
computed for each line of the map, which yields a vertical curve
3. Then, by taking
the mean value of the curve, as a global asymmetry index (ASI) is computed.
Table 2.1 shows the average and standard deviation of the ASI for the three
groups of patient. The statistical difference for the paired t test were highly
si-gnificant for both left and right legs LLD group (p ≪ 0.01). This demonstrates
2For a line k of width w, the set of mirrored differences is : {kp
i,k− pw−i,kk22,∀i∈[0,w/2]} where pi,j is a pixel at position (i, j).
3To estimate this curve, images are centered a first time based on the position of the neck, then more accurately by seeking the minimum area of the curve around the axis of symmetry.
Fig. 2.3: Asymmetry map for subject #05, one of the best result of the dataset.
ASI is 0.04164 for normal gait, 0.05858 for left LLD, and 0.06824 for right LLD.
With the right LLD (case C), the asymmetry of arm swing is clearly noticeable.
that this method can efficiently detect gait symmetry. In practice, three patients
had a higher ASI for their normal gait than with the sole (Fig. 2.4). By looking
at their videos, the authors have noticed that those patients already had a visible
gait asymmetry (one arm swinging more than the other, tilted shoulders, etc.).
2.6
Conclusion
In this paper, we have presented a new gait analysis system, based on a depth
sensor, which estimates a perceptual color map providing a quick overview of
exis-ting asymmetry exisexis-ting in the gait cycle of a patient and an index (ASI), that was
proved statistically significant (p ≪ 0.01). While being cheap, markerless,
non-Fig. 2.4: Asymmetry map for subject #09, the worst result of the dataset. The
corresponding ASI are 0.05672 for normal gait, 0.05166 for left LLD, and 0.04625
for right LLD. The patient had naturally a strong arm swing but a sole on the left
foot seems to help rectifying it.
invasive, easy to set up and suitable for small room and fast diagnostic, this new
gait analysis system offers a readable and flexible tool for clinicians to analyze
gait characteristics which can be easily exploited for disease progression, recovery
cues from post-operative surgery or might be used for other pathologies where gait
asymmetry might be a symptom.
2.7
Acknowledgments
2.8
References
[1] J. R. Engsberg, K. G. Tedford, J. A. Harder, and J. P. Mills, “Timing
changes for stance, swing, and double support in a recent below-knee-amputee
child.” Pediatric Exercise Science, vol. 2, no. 3, 1990.
[2] J. Loizeau, P. Allard, M. Duhaime, and B. Landjerit, “Bilateral gait patterns
in subjects fitted with a total hip prosthesis,” Archives of physical medicine and
rehabilitation, vol. 76, no. 6, pp. 552–557, 1995.
[3] J. Hamill, B. Bates, and K. Knutzen, “Ground reaction force symmetry
during walking and running,” Research Quarterly for Exercise and Sport, vol. 55,
no. 3, pp. 289–293, 1984.
[4] H. Miki, N. Sugano, K. Hagio, T. Nishii, H. Kawakami, A. Kakimoto, N.
Na-kamura, and H. Yoshikawa, “Recovery of walking speed and symmetrical movement
of the pelvis and lower extremity joints after unilateral tha,” Journal of
Biomecha-nics, vol. 37, no. 4, p. 443-455, Apr 2004.
[5] J. Ponce and D. Forsyth, Computer vision : a modern approach.
United
States of America : Prentice Hall, 2003.
[6] E. Auvinet, F. Multon, and J. Meunier, “Lower limb movement asymmetry
measurement with a depth camera,” in Engineering in Medicine and Biology Society
(EMBC), 2012 Annual International Conference of the IEEE.
IEEE, 2012, pp.
6793–6796.
[7] C. Faloutsos and K.-I. Lin, FastMap : A fast algorithm for indexing,
data-mining and visualization of traditional and multimedia datasets.
Proceedings of
ACM SIGMOD, vol. 24, no. 2, pp. 163-174, 1995.
[8] M. Mignotte, “A bicriteria optimization approach based dimensionality
re-duction model for the color display of hyperspectral images,” Geoscience and
Re-mote Sensing, IEEE Transactions on, vol. 50, no. 2, pp. 501–513, 2012.
1989.
[10] C. Rougier, E. Auvinet, J. Meunier, M. Mignotte, and J. A. de Guise,
“Depth energy image for gait symmetry quantification,” in Engineering in Medicine
and Biology Society, EMBC, 2011 Annual International Conference of the IEEE.
IEEE, 2011, pp. 5136–5139.
[11] F. Potdevin, C. Gillet, F. Barbier, Y. Coello, and P. Moretto, “The study
of asymmetry in able-bodied gait with the concept of propulsion and brake,” in 9th
Symposium on 3D Analysis of Human Movement, Valenciennes, France, 2006.
[12] F.T. Cox and M.A.A. Cox, Multidimensional Scaling, Chapman and Hall
CRC, 2000
ANNEXE A
Importing Data
Each sequence is saved in a binary format and compressed with gzip (NB :
ending with the “.gz” extension). Each pixel is meant to be an 16-bit unsigned
integer (uint16) and represents the depth in millimeter. So as to recover an image
from binary to uint16, three steps are required : the first one is to get to the starting
byte of the image, the second one is to read and convert the pixels of the image,
and the final one is to store each pixel value. To recover the i
thimage, the starting
point is evaluated as follows :
image
i= 8 + (24 + 640 × 480) × i
Each pixel is stored as a 16-bit little-endian (which can be represented as for 4
digits in hexadecimal base). Therefore, 4 bytes are read sequentially. We give them
the notation p
ijread
. And then, they are converted into a decimal base according to
the following scheme :
p
ijread= [A123]
HEX little-endian→ 10 × 16
1+ 1 × 16
0+ 2 × 16
3+ 3 × 16
2= [9121]
DECIMAL= p
ijWhere → design the conversion of the read data to the decimal base. At this point,
the pixel p
ij
is stored as a uint16 in a table. This table represents the i
thimage and
once the i
thimage is fully recovered, it is saved in a tree-dimensional array at the
i
thposition.
Clipping Step
This step takes place when the silhouette of the patient is recovered.
aims at mapping the original high N -dimensional depth signals to a lower 3D
space, but also attempt to preserve the between-depth signal distances as well as
possible. Preserving the between-depth signal distances will result in a visually
more significant map. The map will be more contrasted and the color used are
going to be well distributed. Therefore, the clipping value of the non-patient pixels
have to be set carefully.
In other words, the MDS algorithm will work well if no big artificial pairwise
distances are created, because those distances will induce a squeezing effect on the
other informative distances. For instance, if the relative value of the background
differs a lot from the patient’s pixel values, the asymmetries between the right
and left legs might not be distinguishable. Therefore the default value has to be a
central value, such as the depth of the chest. In this work, the default clipping value
is computed by taking the mean of all the depth value belonging to the patient in
the whole sequence.
(a) (b)
(c) (d)
Fig. 2.5:
(a) An input image where non-patient pixels where naively clipped to zero.
The high contrast makes details harder to see. (b) An input image where non-patient
pixels where clipped to the mean value of patient’s pixels for the whole sequence. More
details are visible. (c) The distribution of the pixel values of the image for the naive
clipping (semi-log scale). (d) The distribution of the pixel values of the image for the
smart clipping (semi-log scale). It is important to notice that the whole point of using a
default clipping value is to make the distribution of pixel value of the images unimodal
and continuous. This will ensure a well contrasted map that is visually significant for
human eye.
ANNEXE B
Correlation Metric
We can evaluate the efficiency of the FastMap technique in its ability to reduce
the dimensionality reduction of a gait sequence by computing the correlation
me-tric [2] which is simply the correlation of the temporally shift-invariant Euclidean
distance between each pairwise vectors in the high (N -)dimensional space (let X
be this vector) and their corresponding (pairwise) Euclidean distances in the low
(3D) dimensional space (let Y be this vector). The correlation ρ can be estimated
by the following equation :
ρ
X,Y= corr(X, Y ) =
cov(X, Y )
σ
Xσ
Y=
X
tY /|X| − ¯
X ¯
Y
σ
Xσ
Y(2.7)
where X
t, |X|, ¯
X and σ
X
respectively represent the transpose, cardinality, mean,
and standard deviation of X. This correlation factor (Pearson) will specifically
quantify the degree of linear dependence between the variables X and Y and
quan-tify how the FastMap technique is able to give a low dimensional mapping in which
each object is placed such that the between-object distances (in the original high
dimensional space) are preserved as well as possible [1]. A perfect correlation ρ = 1
indicates a perfect relationship between original data and reduced data and a
cor-relation of ρ = 0 indicates a total loss of information.
References
[1] T. F. Cox and M. A.. A. Cox, Multidimensional scaling. Chapman and Hall
CRC Press, 2000.
[2] P. Jacobson and M.R. Gupta, Design goals and solutions for display of
hyperspectral images, IEEE Trans. Geosci. Remote Sens., 2005
ANNEXE C
Asymmetry Map Stochastic Local Refinement
As indicated in Section 2.4.3, the FastMap-based mapping method (which
ex-ploits an algebraic procedure) has the main advantage of being very fast for large
scale applications but slightly less accurate than an optimization procedure. For
this reason, we decide to refine the estimated asymmetry map given by the FastMap
as being the initial starting solution of a stochastic local search using a local
explo-ration around the current solution and the Metropolis criteria with the following
algorithm :
Algorithm 1
Local exploration with Metropolis
E
Energy function to be minimized
T
lTemperature at Iteration step l
a
Cooling schedule parameter
r
Radius of exploration, real ∈]0, 1]
T
0, T
fInitial and final temperature
L
Smax
Maximal number of iterations
1. Initialization :
a ←
³
Tf T0´
1 LSmax2. Local Exploration
while
l < L
S maxdo
for
each pixel and each color channel with value
x
sat site s do
• Compute ∆
Energy= E(y
s) − E(x
s) with
y
s∈ [x
s− r : x
s+ r] and y
s∈ [0.0 : 1.0]
• If (∆
Energy< 0) Replace x
sby y
s• Else Replace x
sby y
swith
probability ⊲ exp
³
−
∆EnergyTl
´
l ← l + 1 and T
l← T
0a
lANNEXE D
ANNEXE E
Local Symmetry Detection in Natural Images using a Particle Filtering
Approach
This research work was done in collaboration with Nicolas Widynski and the
related paper was accepted and published by IEEE Transactions on Image
Proces-sing, 23(12) :5309-5321, December 2014.
Contrary to the previously described gait analysis system which estimates a
perceptual color map providing a quick overview of existing asymmetry existing in
the gait cycle of a patient and offering a readable and flexible tool for clinicians for
pathology detection and disease progression, we propose now an original algorithm
to detect smooth local symmetries and the contours of ribbon-like object in natural
images
1.
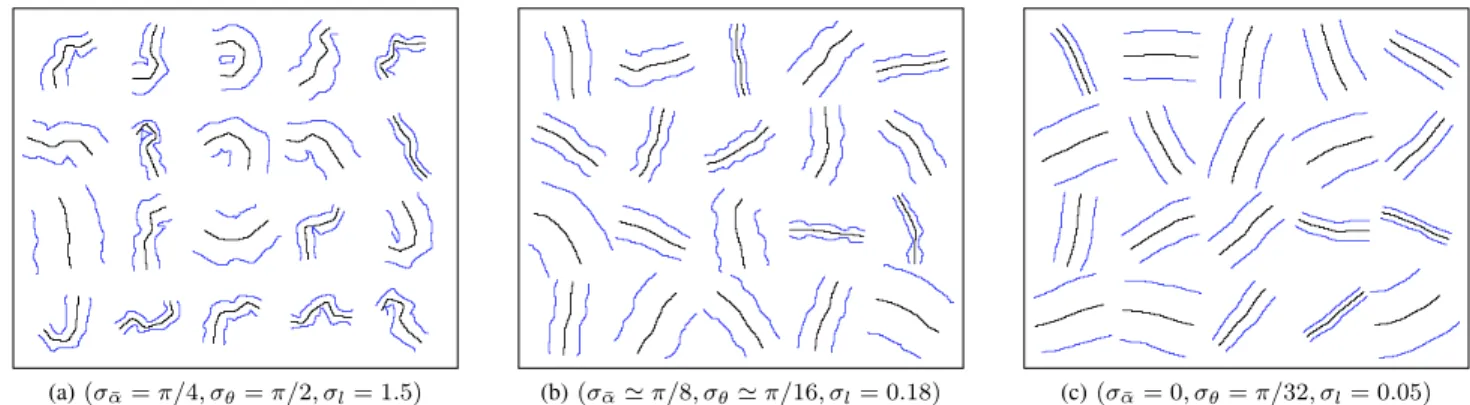
1As second author, my own contribution to this work was to help in defining the local geometric model of sequential and well-formed ribbons used in our Bayesian detection procedure based on a particle filtering algorithm. To this end, this contribution included an analysis of previous works proposed in the symmetry and medial axis detection literature before making an overview of the definition of the different types of ribbons (see Fig. 1) along with their inherent properties (see Section II). Finally, I help in defining a simple generative but yet expressive model of ribbons, which can be sequentially detected and generated with a Bayesian framework (in which the particle filtering is expressed) and which is based on the Brooks definition of ribbons combined with constraints (that the generator makes equal angles with the contours) similar to the ones formulated in the Brady ribbons. This model ensures a reliable and well-posed detection solution of smooth local symmetries in a Bayesian framework. My contribution was also to help in defining a strategy demonstrating the ability of the approach to only detect class-specific ribbons using local prior geometric information and also to participate to the revisions and corrections of the manuscript.
1
Local Symmetry Detection in Natural Images using
a Particle Filtering Approach
Nicolas Widynski, Antoine Moevus, and Max Mignotte
Abstract—In this work, we propose an algorithm to detect smooth local symmetries and contours of ribbon-like objects in natural images. The detection is formulated as a spatial tracking task using a particle filtering approach, extracting one part of a structure at a time. By using an adaptive local geometric model, the method can detect straight reflection symmetries in perfectly symmetrical objects as well as smooth local symmetries in curved elongated objects. Also, the proposed approach jointly estimates spine and contours, making it possible to generate back ribbon objects. Experiments for local symmetry detection have been conducted on a recent extension of the Berkeley Segmentation Datasets. We also show that it is possible to retrieve specific geometrical objects using intuitive prior structural information.
Index Terms—Particle filter, local symmetry detection, ribbon detection.
I. INTRODUCTION
I
N human perception, symmetry is a key element for object recognition as it is one of the fundamental law of the Gestalt theory. Its importance is easy to underline as it is ubiquitous in nature: plants, animals, humans; as well as in man-made objects, buildings, and art [1], [2].In computational science, reflection symmetry detection has received an increasing amount of attention in the last decade. In this paper, we focus on local symmetries, which locally approximate reflection symmetries. Two points form a local symmetry if the angles between their outward normal and the line joining the points are the same [3], [4]. This definition covers global as well as purely local symmetries. The former refers to a symmetry that holds a whole object, whereas the latter relies on a subset of an object. In other terms, although the definition is local, it does not mean that the detected symmetry cannot be global. While global reflection symmetries can be difficult to retrieve due to noise, occlusion and local deformations, purely local symmetries offer more flexibility and may be more suited for natural images.
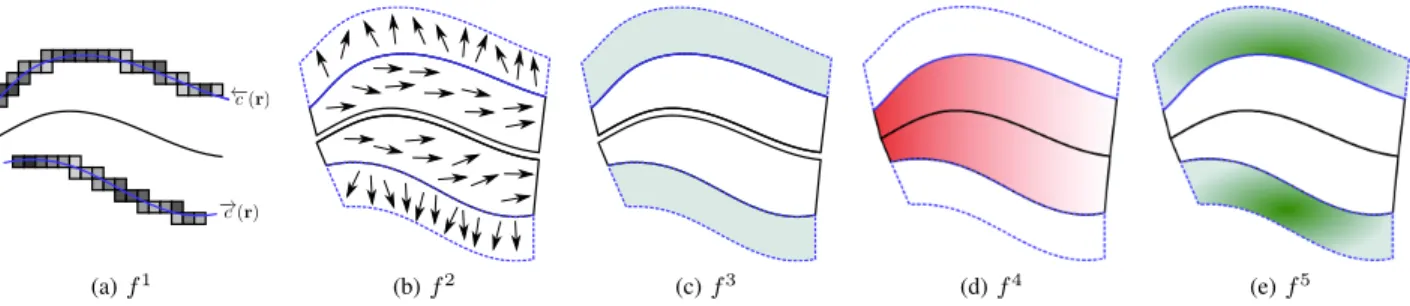
A symmetry axis is a spatial characteristic of the shape. However, the symmetry axis does not encode the scale and contours of the shape. On the other hand, contours only can hardly describe regional properties (e.g. symmetry) and descriptions (e.g. “elongated and curve”) [3]. Ribbon-like objects, or simply ribbons, are a representation of 2D plane shapes. A ribbon can be defined by a smooth local symmetry curve, called spine (the black plain curve in Figure 1), and
Copyright (c) 2013 IEEE. Personal use of this material is permitted. N. Widynski, Antoine Moevus, and Max Mignotte are with Department of Computer Science and Operations, University of Montreal, C.P. 6128, succ. Centre-Ville, Montreal (Quebec), Canada, H3C 3J7.
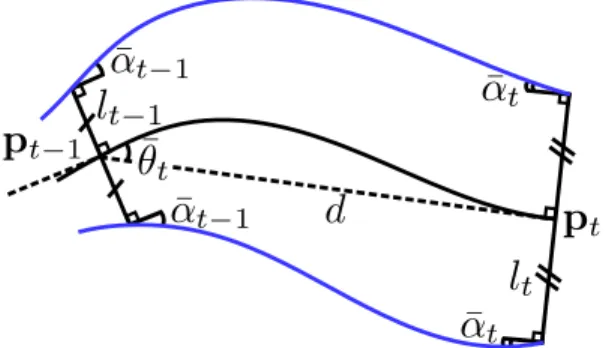
a geometric figure, such as a segment or a disk, called the
generator (the black dashed structure in Figure 1). Ribbon shapes benefit of a dual representation: a contour-based and a region-based representation.
In this article, we propose to detect both contour and symmetry curves of ribbon objects in natural images. Ribbons being strongly related to the notion of local symmetry, they are in fact common in natural images, as they can describe a large amount of objects [1]. They are also of interest for the detection of specific tubular structures, for example in medical image analysis (vessels, arteries, colon, . . . ) [5]–[9], and remote sensing (urban structures, road networks) [10], [11]. Ribbons being a basic element structure that represents well any local object part, their detection could also be employed to retrieve more sophisticated non-ribbon objects using a higher abstraction level detection framework: contours can be used for object segmentation [12], [13]; local symmetries can serve object recognition by providing candidates for structural-based graph matching techniques [14], [15]; and local contours and symmetries could be jointly exploited by a dedicated algo-rithm, as it has been done in [16] in the context of knowledge transfer between object classes, and in [17], [18] in the context of object detection using a hierarchical representation.
Our approach spatially tracks symmetries and contours using a local geometric model of ribbons. Local symmetries are assumed to form smooth 1D lines (spines). The use of an iterative algorithm for this task is particularly well-suited to ex-tract smooth local symmetries and to preserve local connexity properties. We propose to implement a sequential Monte Carlo method, namely a particle filter, to extract one piece of the structure at a time. The particle filter naturally embeds a prior and a spatial transition, which enable to geometrically control the structure of the shape to be extracted. The particle filter is also able to maintain several hypotheses during time, thus overcoming local ambiguities that may happen in occlusions and clutter, for example. The last component of the proposed recursive Bayesian approach is the likelihood function, which is adaptive to the image, in order to confer more importance on visually salient geometric patterns.
This paper is organized as follows. In SectionII, we present a brief analysis of previous works proposed in the symmetry and medial axis detection literature. In Section III, we de-scribe our model of ribbons. Applied sequentially, our model provides consistent and well-formed ribbons. We also define the ribbon prior and transition probability density functions. In Section IV, we detail the contour and object features. These features rely on the information of local gradient, oriented gradient, and textural color. Their purposes are twofold: to
This is the author's version of an article that has been published in this journal. Changes were made to this version by the publisher prior to publication. The final version of record is available at http://dx.doi.org/10.1109/TIP.2014.2365140
2
evaluate the accuracy of the localization of a contour pair candidate, and to ensure that the ribbon spine is inside an object. In Section V, we explain the ribbon detection algo-rithm. The detection framework originates from the recent work introduced by Widynski and Mignotte [19], [20], in which the authors proposed to detect contours using a particle filtering technique. We adapt this methodology to our purpose. In Section VI, we show the results obtained on the LS-BSDS300. We also illustrate examples of symmetrical object retrieval using a prior information on their structure. We finally conclude in Section VII.
II. RELATEDWORK
We focus on symmetry and medial axes detection algorithms in the recent literature, before making an overview of the definition of a ribbon.
A. Symmetry Detection
Reflection, rotation, and translation symmetries have been the subject of numerous detection methods these recent years. Among the three, reflection symmetry is definitely the most common, as it may be the most ubiquitous in the real world. Reflection symmetry detection methods can be separated into two groups: the first starts from segmented data, and aims at coherently gathering pieces in order to form symmetries with nice geometric properties. The second does not require any pre-processing step, and thus aims at extracting local symmetry features directly from the image, possibly using a shape model. In this section, we mainly focus on un-segmented reflection symmetry detection methods. The reader can find extended bibliography on these subjects in [1], [21].
Literature on shape representation methods has been par-ticularly prolific these recent years [22], [23]. Their scope of application is appealing: object detection, data compression, tracking, segmentation, . . . Among these methods, Trinh and Kimia addressed the object detection problem by extracting medial axis of specific objects in natural images [24]. The shape is learned from a dataset and is modeled using a graph representation. Since they rely on a structural prior rather than a potentially changing appearance model, such methods are very promising in object detection. But although skeletons contain local symmetries [23], [25], these methods are not intented to extract them all since the detections are driven by a specific shape model.
Detection of symmetries without integrating a model has notably been studied in [21], [26], [27]. These papers aim at finding major symmetry axes from extracted feature points. Thus, these methods are more adapted to recover global re-flection symmetries rather than multiple local symmetries from images [28]. In [29], Podolak et al. proposed a planar reflective symmetry transform to measure the degrees of symmetries of arbitrary 3D shapes. All the planes passing through the object bounding volume being evaluated, this representation creates an interesting bridge between local and global symmetries, yet it remains to be applied to the detection problem in natural images.
Recently, Tsogkas and Kokkinos proposed a soft local symmetry detector using a learning-based approach operating jointly on several scales [30]. The features are based on the well known gPb contour detection algorithm [12]. Although we compare our approach to theirs, the problems are not exactly the same. They focus on local symmetry detection, and not on ribbon detection, meaning that their approach cannot recover an object nor a scale information. The au-thors also proposed to use the Berkeley Segmentation Dataset (BSDS300) [31] to learn and evaluate their local symmetry detection algorithm. To create the symmetry ground truth dataset, they first manually selected elongated objects from the set of human-annotated segments available in the BSDS300. Then, they used a skeletonization algorithm to extract the medial structure of the objects. We further refer to this dataset as the LS-BSDS300, which stands for Local Symmetries in the Berkeley Segmentation Dataset 300. As in [30], we also compare our approach to the methods proposed by Linde-berg [32] and Levinshtein et al. [33]. The former defines a multi-scale ridge detector, hence yielding to a one-dimensional output of the structure. The latter approximates symmetrical regions using fitted ellipses from which it retrieves the major axes.
The problem of detecting symmetries and ribbons together has been previously addressed in the context of the detection of thin elongated structures such as roads, vessels or other tubular objects [5]–[8], [10], [34], but to our knowledge, not in natural images. The comparison with our approach is even more relevant in the case of [5]–[7], since the proposed methods employ a particle filtering technique to extract vessels and arteries in 3D computation tomography data. However, the aforementioned methods are often semi-automatic, thus making them designed for single extraction purposes, and/or are object-specific, which make their adaptation in natural images not trivial.
In this work, we stress that simultaneously retrieving the contours and their associated local symmetries into a single framework is an interesting challenge as it aims at representing objects by compact and consistent structures at different levels of abstraction. Our goal is also to propose a generic geometric model that could be easily exploited to extract specific ribbons from natural images. This prior could be based on many basic filtering criteria, such as the length of the symmetry, its minimal/maximal curvature, the object area, its perimeter, its thickness, . . .
B. Ribbon
The definition of a local symmetry is related to the notion of ribbon. Past literature [1], [3], [35], [36] reports several definitions of local symmetries, each one being associated with a different type of ribbon [4], [37]. According to the definition proposed in [4], a ribbon is a plane shape generated by translating a geometric figure, the generator, along a plane curve, the spine. To ensure that the generated shape is a proper ribbon, the generation process should respect the following rules [37]:
• the size and the orientation of generators should vary smoothly along the spine;
This is the author's version of an article that has been published in this journal. Changes were made to this version by the publisher prior to publication. The final version of record is available at http://dx.doi.org/10.1109/TIP.2014.2365140