Preprint accepted for publication in Journal Of Physical Chemistry C DOI: 10.1021/acs.jpcc.9b04856
An In-Situ EC-STM Study and DFT Modeling of
the Adsorption of Glycerol on Cu(111) in NaOH
Solution
Shoshan T. Abrahami 1*, Fatah Chiter 2, Lorena H. Klein 2, Vincent Maurice 2, Herman
Terryn 1, Dominique Costa 2 and Philippe Marcus 2*
1 Department of Materials and Chemistry, Research Group Electrochemical and Surface
Engineering, Vrije Universiteit Brussel, Pleinlaan 2, 1050 Brussels, Belgium
2 PSL Research University, CNRS – Chimie ParisTech, Institut de Recherche de Chimie
Paris/Physical Chemistry of Surfaces Group, 11 rue Pierre et Marie Curie, 75005 Paris, France
2
Abstract
Organic coatings are often required for the protection of metals against environmental degradation. Despite their extensive use, only limited information is available on the initial stages of adsorption and formation of protective films, especially at the molecular and atomic level. As a model system for coating formation, this study investigates the adsorption of glycerol molecules on the single-crystalline Cu(111) surface. A combined electrochemical and scanning tunneling microscopy (EC-STM) study in NaOH aqueous solution enabled following the adsorption process in detail, providing molecular information on the glycerol film structure. A potential-driven adsorption of glycerol was observed, suppressing the adsorption of hydroxyl molecules and copper oxidation. The adsorbed species assembled in a nearest neighbor arrangement fitting a (√3 × √3) R30° hexagonal structure with respect to the Cu(111) lattice. This experimentally observed configuration was confirmed by density functional theory (DFT) calculations. DFT modeling indicates that a mixed adsorption mode involving the two primary alcohol groups adsorbed at different z-positions relative to the surface is the most favorable. This mixed configuration enabled the formation of an extended network of hydrogen bonds that aids to stabilize the glycerol film. This implies that interactions between glycerol molecules play a non-negligible effect in the growth process of such an organic film, allowing the formation of organic layers in the absence of strong interfacial interactions.
3
1. Introduction
Many technological applications of metals rely on protection by organic layers, adhesives or hybrid coatings 1. In addition to possible functional or aesthetic requirements, these organic
coatings provide an essential barrier to slow down and even block the natural degradation processes caused by metal exposure to the atmosphere and to corrosive environments. However, despite their extensive use, the initial stages that lead to the development of a stable metal/organic interface are still not fully understood. Inevitably, the first step in the formation of any type of organic-based coatings on metals is the adsorption of coating and/or promoter species onto the surface. To a great extent, this initial state of interaction at the solid/liquid interface will affect subsequent reactions that lead to the build-up and growth of a protective overlayer. Hence, fundamental understanding of these initial steps is critical for the design of strong and durable organic coatings. Some key elements of interest are the type, density, and orientation of the molecules upon adsorption and the nature of bonding between the surface and the different molecules present in coatings. Numerous experimental studies (e.g. 2-7) have contributed in the past few decades to our understanding of these elements, utilizing a range of surface-sensitive spectroscopic techniques such as X-ray photoelectron spectroscopy (XPS), Infrared spectroscopy techniques, and time-of-flight secondary mass spectrometry (ToF-SIMS). Although these are extremely powerful tools, these techniques do not provide real-space information on the buildup of coatings.
Scanning tunneling microscopy (STM) was one the first method to provide a direct imaging of the surface features at submolecular resolution on extended flat surface 8. Soon after,
real-time imaging of surface interaction with liquids was made possible by performing STM measurements in an electrochemical cell (EC-STM). This combination was demonstrated successful for a range of surface-focused studies, such as the initial stages of passive film formation 9-11, metal corrosion 12, 13 and adsorption of various anions 14-16 and self-assembled molecules 17-22. Therefore, this approach is highly suitable to investigate the initial processes of organic coating formation on metal surfaces. Unfortunately, most of the industrially applied metals such as steel and aluminum alloys form a relatively thick oxide layer in the presence of electrolytes, thereby possibly blocking tunneling currents. Excluding noble metals, one of the most investigated electrodes using EC-STM is copper. The surface structure of copper in different electrolytes and potentials has been well-characterized 23. The choice of copper as a model system is motivated by the possibility to form various type of
4 surface sites (Cu0, Cu-OH, Cu1+, Cu2+) at convenient pH and potential window, and self-limiting oxide layers that are thin enough to allow for a tunneling current between the surface and the STM tip 10.
Because of the chemical complexity and the size of monomers in conventional coatings, this work addresses small organic molecules with common type of functional groups that are also present in many organic coatings. Glycerol was chosen as model molecule, containing three alcohol groups that can interact with the surface. In addition, it is readily dissolved in water and its small size permits imaging down to molecular resolution. The purpose of the present study was to probe the initial stages of interactions at the solid/liquid interface between copper and glycerol. This paper presents an EC-STM experimental investigation on the adsorption of glycerol on Cu(111) electrode in NaOH electrolyte combined with the Density Functional Theory (DFT) theoretical modeling of the atomic structure of the adsorbed organic layer. By studying the electrochemical and structural changes in situ, we aim to identify the important physical and chemical processes needed to facilitate interfacial bonding, and to advance our understanding of the fundamental processes that lead to the formation of a protective organic overlayer.
2. Experimental 2.1 EC-STM
The EC-STM experiments were performed with an Agilent Technologies 4500 system comprising PicoSPM base, STM S scanner, PicoScan 2100 controller, PicoStat bi-potentiostat and Picoscan software. High purity (6N) copper (111) single crystal was purchased from surface preparation laboratory (SPL) with an initial accuracy of < 0.5° of the crystallographic orientation. Before each experiment, the sample was mechanically polished using diamond paste down to a final 0.25 μm grade. The sample was subsequently electropolished in 60% H3PO4 for 4 min at 1.4 V vs. a Cu counter electrode and then annealed overnight at 730 °C
under a flow of ultrapure hydrogen at atmospheric pressure to heal out defects and to enlarge the terraces. After annealing, the sample was quenched to room temperature and rested for 1 h under the continuous flow of hydrogen before transfer to the EC-STM set up.
5 electrodes (counter electrode and a pseudo-reference) was cleaned in a 2:1 mixture of concentrated H2SO4 and H2O2 and in concentrated HNO3 to remove organic and metallic
contaminations, respectively, and thoroughly rinsed with Millipore water. Glycerol (99%) and NaOH were purchased from Sigma- Aldrich and used as received. 0.1M NaOH and a mixture of 0.1M NaOH and 0.1M Glycerol were prepared with Milli-Q purified water (resistivity > 18 MΩ cm). To minimize electrolyte evaporation during the long measurements time, the EC-STM head was placed in an environmental chamber that was saturated with water vapor.
The single crystal was then mounted in the cleaned EC-STM cell as working with an electrode surface area of 0.13 cm2 exposed to the electrolyte (of approx. volume 360 μL). After noting the open circuit potential (OCP), the air-formed native oxide film was immediately reduced by scanning the potential at 20 mV/s down to the onset of hydrogen evolution and then up -0.8 VSHE (approx. -1.0 V vs. Pt), which is in the range of metallic
copper. After this pretreatment, the potential was scanned to the value of interest. References of the potential values reported in this paper were converted to the standard hydrogen electrode (SHE). The tungsten STM tips were prepared from a 0.3 mm diameter wire by EC etching in 3 M NaOH and covered by apiezon wax. All images were obtained in the constant current topographic mode and later analyzed using WSxM software 24.
2.2 Computational details
All calculations were performed in the framework of Density Functional Theory (DFT), with the periodic plane-wave basis set code VASP (Vienna Ab initio Simulation Package) 25-27. All results reported have been obtained with projector-augmented-wave potentials 28, 29 using a 520 eV plane-wave cut-off. The Generalized Gradient Approximation (GGA) of Perdew-Burke-Ernzehof (PBE) function 30, 31 was used for the exchange-correlation term. The van der
Waals (vdW) interactions were carried out using the semi-empirical dispersion corrections developed by Grimme 32 (DFT-D2). A Methfessel-Paxton 33 smearing and Monkhorst-Pack 34
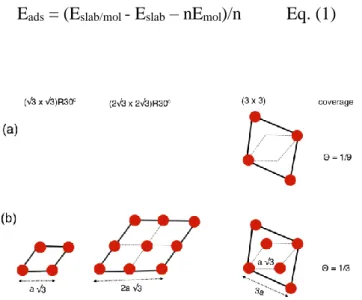
mesh of k-points was used in order to have the same energy precision in all calculations. We used a 3×3×1 or 5×5×1 k-point grid according to simulation cell size. Different sizes of supercells were used to represent the substrate in the aim to understand the interaction mechanism of the glycerol with the copper and to find a stable configuration of the network formed by the molecules. Schematic illustration of the different supercells is shown in Fig. 1. These supercells were constructed from four layers of Cu(111), with different lateral
6 dimensions of (a(111) √3), (2 × a(111) √3) and (3 × √2 2⁄ × a0 = 3 × a(111)) in both x and y
directions, where a(111) is the experimental lattice parameter of (111)-oriented copper (a(111) =
2.55 Å). The vacuum region between the 4-layer Cu slabs was set at more than 18 Å to minimize the interactions in the z direction between periodic images of the adsorbate/substrate system. The adsorbed glycerol molecules and the two uppermost layers of the copper substrate were allowed to move freely, while the copper atoms at the bottom two metal layers were fixed at their position in the bulk during all computations. Atomic positions were relaxed with the conjugate gradient (CG) algorithm until forces on each moving atom were less than 0.02 eVÅ-1 and using a total energy convergence of 10-5 eV. We optimized glycerol/Cu(111) systems without dipole corrections and after the convergence we restarted the calculations adding a dipole correction. The adsorption energy per molecule (in eV/molecule) of the glycerol on the Cu(111) surface was calculated using Eq. (1), where Eslab/mol is the total energy of the system with the molecules adsorbed on the Cu(111) surface,
Eslab is the energy of the bare relaxed Cu(111) substrate, Emol is the energy of one free glycerol
optimized in vacuum and n the number of glycerol molecules in the supercell. One free glycerol molecule optimized in vacuum was used as reference. The large supper-cell with dimensions of 15 Å, 15.5 Å and 16 Å in x, y and z directions was applied, respectively. In order to have the same energy precision in all calculations we kept the same calculations parameters as in the glycerol/Cu(111) systems. Because of the large unit cell used in calculations, the Brillouin-zone sampling was restricted to the Γ-point.
Eads = (Eslab/mol - Eslab – nEmol)/n Eq. (1)
7
(b) high coverages. The bold lines mark the unit cells and the red dots the glycerol molecules.
3.Results & Discussion
3.1 Electrochemical behavior
Fig. 2 (a) shows cyclic voltammetry (CV) curves of Cu(111) in 0.1M NaOH (grey line) and 0.1M NaOH + 0.1M glycerol (black line), measured with the EC-STM cell. The characteristic potential domains for the copper surface reactions in 0.1M NaOH and the associated surface species are indicated. At potentials lower than -0.75 V, the copper surface is in its metallic state, Cu. The first anodic reaction, A1, of copper oxidation to Cu2O occurs above -0.4 V. This
is followed by the second anodic process, A2, starting approx. at 0 V. This process exhibits
two peaks that are generally assigned to an initial formation of soluble Cu2+ species in the form of Cu(OH)42-, followed by deposition of a mixture of CuO and Cu(OH)2 35, resulting in a
duplex oxide layer 9, 11. Finally above +0.8 V, oxygen evolution starts and the curve exhibits high current densities. Upon sweeping back in the cathodic direction, the first cathodic peak, C2, appears at approx. -0.2 V, indicating reduction of CuO back to Cu2O. This is followed by
the reduction of Cu2O to Cu at peak C1. This peak correlates to the desorption of hydroxyls,
shifted to cathodic potential after reduction of the surface oxide (as discussed later in relation to Fig. (1 (b)). At potentials negative to -1.0 V hydrogen evolution is observed. This typical electrochemical response has been well documented, with minor shifts in the relative currents or peak areas depending on the hydroxide concentration, the potential scan rate and other variations in the experimental conditions.
8
Figure 2: Cyclic voltammetry of Cu(111) in 0.1M NaOH (grey line) and 0.1M NaOH + 0.1M glycerol (black line) in the EC-STM cell at 20mV/s: (a) full and (b) short CV. The two arrows in (b) indicate the potentials at which EC-STM images were recorded. There was a (-0.2V) shift of the Pt reference in the presence of glycerol, which is corrected for in
Fig. 2 (a) and (b).
Some distinct differences in the electrochemical response can be observed in the presence of glycerol. The first distinction concerns a 50 mV shift in the open circuit potential (OCP). In glycerol, the OCP shifts to a more positive value (-0.11 V in 0.1 NaOH + 0.1M C3H8O3 vs.
-0.16 ±0.1 V in 0.1M NaOH). The first oxidation peak, A1, is no longer observed, and instead
there is a gradual increase in the current density. This trend changes when the potential reaches values near the second oxidation peak, A2, which is broadened and exhibits much
higher oxidation currents. This enhanced current density was previously reported to result from electrooxidation of glycerol in this potential range 36, 37. Similar oxidative response at high potentials has been observed with other small carbohydrate molecules up to larger poly-compounds derived from sugar 38. This is accompanied by a new (third) anodic peak. This
peak has been previously assigned to the formation of soluble Cu3+ species that help to
mediate this catalytic oxidation process 35. The modification of the cathodic reduction peak,
9 species to the solution during glycerol oxidation and extensive surface roughening. Both CVs show hanging in the cathodic region, and this is more marked in the absence of glycerol. This hanging can be assigned to the increased reduction of O2 present in the non-deaerated
electrolyte with increased cathodic polarization.
It was previously shown by Maurice et al. 9 that hydroxyl adsorption precedes the oxidation of copper in NaOH, hence, occurring at potentials slightly negative with respect to the first anodic oxidation peak, A1. This peak of interest is not evident in the full CV, as it is much
smaller compared to the two oxidation peaks and its appearance is highly sensitive to sample preparation. In order to observe the OH adsorption and desorption peaks, a shorter CV was measured, with an anodic vertex lower than the first oxidation peak, A1. An example of such
CV is shown in Fig. 2 (b) for Cu(111) in NaOH with- and without the addition of 0.1M Glycerol. The short CV in 0.1 M NaOH is in good agreement with previous reports, which have done detailed investigations about hydroxyl adsorption on Cu(111) 9. In the presence of glycerol, however, the characteristic OH adsorption and desorption peaks appear to be suppressed and the current is slowly increasing without any specific end-point in this region. This linear current increment is a sign for a non-diffusive adsorption process at the copper surface that leads to a constant charging rather than a redox reaction, as with OH- adsorption. This is supported by the fact that an additionally overpotential of approx. 0.2 V was needed to initiate hydrogen evolution in the presence of glycerol.
These observations for glycerol are in accordance with numerous earlier studies that reported major reduction in the corrosion current densities of copper in the presence of glycerol, especially under alkaline conditions 39. This effect is clearly visible by the electrochemical response measured in the present case. However, earlier results often assigned this decrease to the high viscosity in the presence of high concentrations of glycerol and/or the presence of metal-copper complexes, creating a protective film 39, 40. As the viscosity is not significantly
affected in our study, this inhibition can be ascribed to the interactions of glycerol with the copper surface, which is our main objective in this study. Moreover, this is a typical electrochemical behavior for an inhibitor, such as of 5-mercapto-1-phenyl-tetrazole 41. The formation of an organic overlayer on the copper surface is most likely preventing hydroxide ions and water molecules to access surface sites and initiate oxidation. Similarly, previous work on γ-alumina powders have shown that its hydrolysis and conversion to boehemite was slowed down in the presence of glycerol, presumably due to the formation of carbonaceous deposits on the alumina surface 42.
10
3.2 Surface structure observed in situ with STM
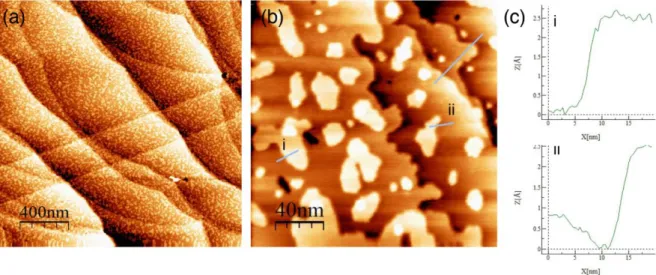
In order to understand the reactions at the solid/solution interface, EC-STM images were recorded at specific stages in the CV (indicated by the arrows in Fig. 2(b)). At -0.8 V, corresponding to the metallic state, the surface morphological features were similar in both electrolytes. As an example, larger scan images of Cu(111) in metallic state are shown in Fig. 3 (a, b). The surface revealed a succession of terraces ranging from narrow ones, 2 – 10 nm wide, to large ones, up to 500 nm wide (Fig. 3 (a)). In addition, copper islands, ranging from 2 to 50 nm in width, are visible on the entire surface. These adislands are expected to form during the initial reduction of the native oxide formed in air, as the pretreatment conditions of reduction of the native oxide do not allow for sufficiently long-range diffusion and full rearrangement of the surface. The steps separating the terraces and the adislands have heights consistent with monoatomic copper layers (reticular distance of 0.208 nm for (111-oriented copper), as measured by the profiles shown in Fig. 3(c).
Figure 3: EC-STM topographic images of the Cu(111) metallic surface in 0.1M NaOH + 0.1M glycerol (a,b) and height profile measurements across the steps edges and adislands
indicating monoatomic height (c). UCu = -0.8 V, Utip = -0.4V, Itip = 1.8 nA.
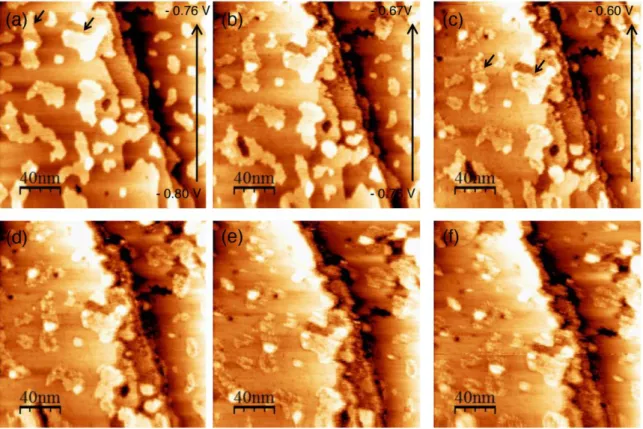
Fig. 4 presents a sequence of STM images that were recorded during a slow (1mV/s) potentiodynamic sweep of the sample potential in the anodic direction from -0.8 V to -0.6 V in 0.1 NaOH + 0.1M glycerol. At the start, the copper surface exhibits atomically flat terraces
11 that are typical for its metallic state (Fig. 4 (a)). Structural changes were observed starting from approx. -0.73 V, with darker spots covering the terraces and adislands as well as the step edges (Fig. 4(b), middle and top parts and 4(c)). These are characteristic signs for the adsorption of oxygen-containing species on the copper surface 9. Soon after adsorption started, the images exhibited significant loss of definition and most surface features became blurry (Fig. 4 (d-f)). This suggests increased mobility of atoms (or molecules) on the surface, which must be faster than the time resolution of the STM scan. Since there is no visible change in the morphology of the copper adislands (e.g. the adislands marked by the arrows in Fig. 4), we expect no significant copper mass transport during the formation of the adlayer. Hence, copper surface reconstruction is unlikely and this high mobility can be assigned to the adsorbed species. The EC-STM data in Fig. 4 clearly indicate of a potential-driven adsorption, with buildup of the adsorbed surface structure above -0.75 V.
Figure 4: Sequence of EC-STM topographic images recorded in 0.1 NaOH + 0.1M glycerol during a dynamic sweep at 1mV/s from UCu = -0.8V to -0.6V (a-c) and directly after the
sweep (d-f). A small drift is observed between images, however, similar features are visible for comparison. Utip = -0.4 V, Itip = 1.40 nA.
After several hours at -0.6 V we obtained high-resolution images of the surface species. Some examples are shown in Fig. 5 and Fig. 6. The structure was reproducible in over 100 STM
12 images. The surface appeared to be covered by regularly spaced molecular protrusions (appearing as bright dots) arranged in a hexagonal structure (Fig. 5) that covered the whole surface, the terraces as well as the ad-islands, (Fig. 6). No different rotational or mirror domains were found, which is in accordance with the expectations for an adsorbed structure of symmetry identical to that of the substrate. The apparent boundary between the upper part and lower part of the image in Fig. 5 (a) may correspond to different domains (i.e. grains) of the superstructure adopting the same local orientation. The hexagonal structure looks distorted, especially in the slow scanning direction (y-axis), due to the drift of the field of view. To evaluate the lattice parameter, multi intermolecular distances were measured along the three directional symmetry axes (Fig. 5 (c)). The average measured spacing was in the order of 0.39±0.2 nm, with values ranging between 0.36 to 0.48 nm. These relatively large variations in the measured lattice parameters can be largely attributed to the limited precision in the STM images due to visible scanning drift. Similarly, this drift could be the cause for seemingly deviations from a perfect hexagonal arrangement. Deviation of the measured parameter was large because averaged from areas that appear compressed or elongated in each image. This average lattice parameter corresponds best to a (√3𝑥√3) R30° supercell (lattice parameter of 0.44 nm) with respect to the unreconstructed lattice of the (111)-oriented substrate. Following cathodic reduction, the EC-STM images of the copper surface exhibited the original metallic structure, indicative ofa reversible desorption reaction of glycerol. While STM cannot distinguish between different chemical species, structural information on the atomic configuration can generally assist in the assignment of the type of species. A 0.44 nm distance is significantly larger than the Cu-Cu nearest neighbor distance of 0.256 nm, but also significantly smaller than the reported cell size of OH adsorbed on Cu(111), which is 0.6 nm 9, 43. Hence, OH can be excluded based on these EC-STM findings and the CVs in Fig. 2,
which show that the superstructure forms in the potential range where glycerol inhibits OH adsorption. Oxygen adsorption is also decreasing in this potential range according to the decreasing residual cathodic background current with increasing potential (Fig. 2), excluding this possibility. The remaining options are either glycerol or fragments of it. Under the applied imaging conditions, we can exclude glycerol decompositions for two reasons: (1) the experimental alkaline conditions do not support dehydrogenation of glycerol, and (2) the potential in which this initial adsorption occurs is very low, providing insufficient energy to decompose the molecule, something that was reported in the literature at higher (oxidation) potentials36,37. Considering the dimensions of the glycerol molecule, a relative small unit cell
13 can be expected upon adsorption on Cu(111). Surveying EC-STM literature, it appears that a (√3𝑥√3) R30° structure is a common unit cell for adsorption of different anions, such as iodide andphosphate anions on Cu(111) surfaces 44, 45. Earlier, other anions such as chloride and sulfate were also thought to form this unit cell. Only later, upon obtaining better images or additional diffraction data, it appeared that some axial disproportionation were missed in the EC-STM or AFM due to imaging artifacts 46. In the present case, a (√3𝑥√3) R30° model on the unreconstructed Cu(111) lattice best fits the experimental results for glycerol adsorption. Each molecular protrusions in the STM images would correspond to an adsorbed glycerol molecule. The associated surface coverage is 1 molecule for 3 Cu atoms corresponding to an areal density of 5.9 molecules/nm2.
Figure 5: High resolution EC-STM topographic images of Cu(111) in 0.1M NaOH + 0.1M
14
Figure 6: (a) High resolution EC- STM topographic image of Cu(111) in 0.1M NaOH +
0.1M glycerol at UCu = -0.6V Utip = -0.5 V, Itip = 1.80 nA. (b) Derivate of the image in (a)
and two enlargments, showing the atomic lattice on a terrace and an adisland.
3.3 DFT calculations
In the absence of further direct chemical information from STM, combination with theoretical modeling was needed to better understand the adsorption mechanism of glycerol and its assembly on the copper surface. Using the experimental input that includes the super cell of the adsorbed layer and the fact that there is no visible manifestation of surface reconstruction of the copper substrate, DFT calculations were performed to confirm the adsorption model and bring further insight in the detailed structure of the adsorbed molecular assembly.
3.3.1 Adsorption site of glycerol on Cu(111) at low coverage
A glycerol molecule has great flexibility, as it can rise to different conformers and isomers. Six backbone conformers have been classified according to the dihedral angles involving the carbon and oxygen atoms 47, 48. From these conformers, Chelli et al. 49, 50 have identified 126
isomers, according to the intramolecular hydrogen bonds and other conformations related to intermolecular H-bonding in the crystal, glass and liquid phases. The opening backbone conformation, typical of crystalline glycerol was investigated to favor the interaction with the surface and/or the formation of the intermolecular hydrogen bonds at high coverage 51-53.
15 In order to determine the adsorption configuration of glycerol, an initial DFT study was performed to identify the most favorable adsorption sites and molecule orientation at low coverage. To this end, we used the (3 × 3) supercell defined in Fig. 1 (a) and adsorb one glycerol molecule per cell. The areal density is 1.9 glycerol molecules/nm2 and the coverage 1/9. At this low coverage, the interaction between glycerol and its lateral images is nearly negligible (3a(111) = 7.6 Å, Fig. 1 (a)). A wide range of configurations considering the
different possible adsorption sites present on the topmost surface plane, e.g on-top, fcc and hcp hollow and bridge sites were initially considered (see supporting information). In these different adsorption sites, the orientation of the molecule was also taken into account. Under the applied alkaline conditions of the experiments, glycerol in the solution is expected in its hydrated form (pKa > 14). Hence, there are three kinds of hydroxyl groups present in one
molecule, one hydroxyl group is attached to the middle carbon atom and the two others to the two terminal carbon atoms with slightly different orientation relative to the carbon backbone (Fig. 7). These two end-groups are hereafter noted OH group 1 and OH group 2. According to first principle calculations on closed-packed precious metal surfaces like Pt, Pd, Rh and Au, glycerol binds via its terminal oxygen lone pair. Hence, only the two OH end-groups were further analyzed.
The most favorable optimized structures are shown in Fig. 7 with their calculated adsorption energies. For this hydrogenated form of glycerol, all obtained structures were found physisorbed, i.e. with relatively weak adsorption energy and without the formation of covalent bonds, due to the position of the molecule relative to the copper surface at a distance of more than 2.35 Å. The adsorption of the glycerol via OH group 1 presented different final geometries after relaxation. In one configuration, the molecule adsorbed perpendicularly to the Cu(111) surface with the OH group 1 near the bridge adsorption site, resulting in an adsorption energy of -0.51 eV. In another configuration, the molecule was also perpendicular but on top site, with a competing adsorption energy of -0.65 eV. A relaxation of the glycerol occurred during optimization, giving rise to a change in the orientation of the OH group 1 to OH group 2. Other configurations such as fcc and hcp sites are less stable with energy differences of about 0.20 eV. The results demonstrate that the adsorption sites play an important role in the determination of the most stable structure and adsorption topology. Considering the glycerol adsorbed via OH group 2, whatever the starting adsorption sites, the final state (after relaxation) exhibited similar final adsorption structures, with an adsorption energy of -0.78 eV with the contribution of the vdW interaction of about -0.60 eV.
16 In this configuration, the molecule was also adsorbed perpendicularly on top site. So far, we can conclude that the perpendicular adsorption of glycerol on Cu(111) at low coverage is controlled by the orientation of the hydroxyl group near the surface and the lowest adsorption energy was found for OH group 2.
Starting from the most stable perpendicular adsorption, we also studied the effect of a molecule tilt with respect to the Cu(111) surface on the adsorption topology. The most stable configuration, also shown in Figure 7, has an adsorption energy value of -1.13 eV with energy dispersion of -1.02 eV, which demonstrate the physisorption mode of the glycerol. This lower adsorption energy of the tilted molecule (the C-C-C skeleton has a tilt angle of 85° toward the surface normal) is related to the vicinity of the remaining OH groups to the surface. The total energy difference at the relaxed state is closely related to the position of the OH group from the surface and the contribution of the vdW forces between the glycerol and the substrate surface. This result is in agreement with previous DFT studies for glycerol adsorption on Pt(111) and Au(111) 54, 55, indicating a much lower affinity towards glycerol compared with copper. For example the corresponding adsorption energy of glycerol on Au(111) surface is -0.78 eV 55 using the optB86b-vdW, which is the lowest value obtained by different functional and dispersion correction methods.
17
Figure 7: Most favorable DFT simulated glycerol adsorption configurations on different
surface sites at low surface coverage of 1/9 (areal density of 1.9 molecules/nm2) and associated adsorption energies.
3.3.2 Adsorption of glycerol on Cu(111) at high coverage and formation of the hexagonal network according to the STM experimental data
In this section, we examined the adsorption of glycerol on the Cu(111) surface and its energetics at the coverage of 1/3 associated with the (√3 × √3) R30° supercell deduced from the experimental data. Several simulation supercells, shown in Fig. 1 (b), and adsorption topologies were investigated, all with the same coverage of 1/3. In this approach, the system can evolve to a more stable structure, if there is any, without much bias. The starting adsorption topologies of the glycerol were made taking into account the low coverage results. However, in the case of (3×3) supercell, we tested other adsorption sites such as fcc hcp and bridge and also tilt configuration. We discussed here the most stable final structures. The
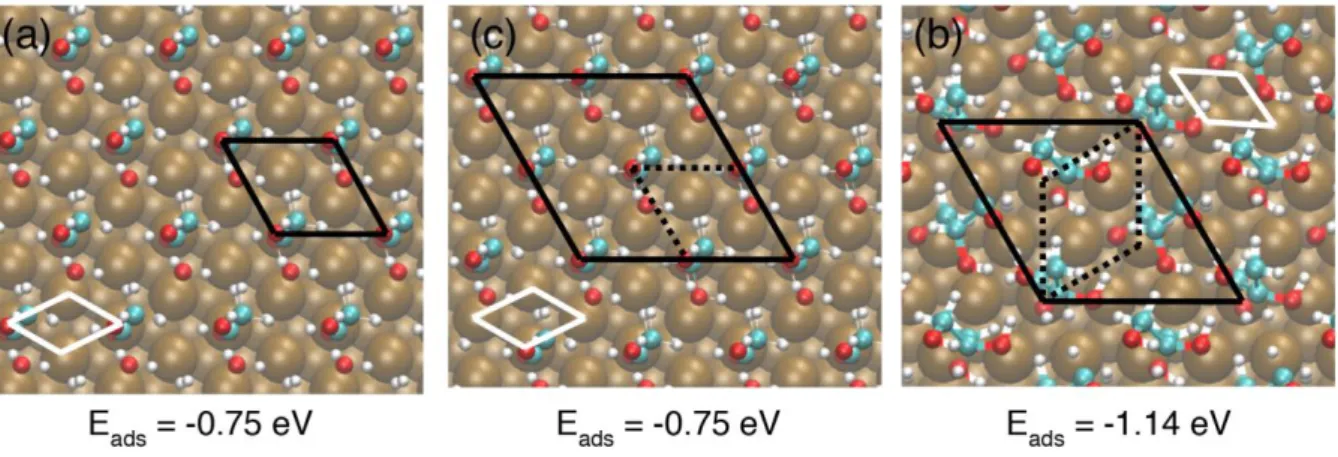
18 results are presented in Fig. 8, with the supercells and the Cu(111) unit cell indicated on the images by bold black lines. Calculations showed that even though the coverage is identical in all three cases, the adsorption energies vary upon relaxation of the final structure. The models using the (√3 × √3) R30° (Fig. 8 (a)) and (2√3 × 2√3) R30° (Fig. 8 (c)) supercells and containing one and four glycerol molecules per cell, respectively, present similar adsorption topology, where the glycerol molecules stand almost perpendicularly to the copper surface and occupy top sites. As discussed above, the glycerol molecules physisorb via OH group 2, without any significant change in the orientation of the hydroxyl groups compared to the gas phase. We calculated adsorption energies of -0.75 eV/molecule in both cases. This value is similar to that found for the perpendicular adsorption of glycerol via OH group 2 at low coverage. The network formed by the nearest neighbor adsorbed molecules perfectly matches the hexagonal (√3 × √3) R30° arrangement even when simulated with the larger (2√3 × 2√3) R30° supercell. However, the most favorable adsorption, shown in Fig. 8 (b), was found with the (3 × 3) supercell containing three glycerol molecules per cell. The calculated adsorption energy for this configuration, -1.14 eV/molecule, is significantly lower as compared to the other two structures. This higher adsorption energy can be attributed to the formation of intermolecular hydrogen bonds, as described here under. The contribution of the vdW interaction is about -0.88 eV/molecule. Close inspection of this optimized structure shows that the adsorption topology consists of a mix of the two favorable adsorption configurations via the two primary OH groups (group 1 and group 2), despite the molecules were initially adsorbed via OH group 2 on top sites.
Figure 8: The three different supercells of increasing size used for DFT simulation of
glycerol adsorption at the surface coverage of 1/3 (areal density of 5.9 molecules/nm2) and associated adsorption energies. (a) (√3 × √3) R30°, (b) (3 × 3) and (c) (2√3 × 2√3) R30°
19
supercell. Substrate unit cell is marked in white and supercells are marked with plain black lines. In (b) and (c), the (√3 × √3) R30° cell is marked with dotted lines.
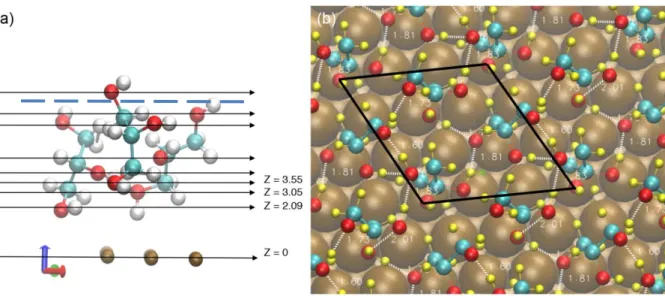
Fig. 9 (a) shows a side view of this final structure. Note that the oxygen atoms (red) near the surface are found in different z planes. The initial configuration consisted of three molecules bond to a Cu atom, in the same geometry as that found for the isolated molecule (Cu-O = 2.35Å). In this initial configuration, the glycerol layer density is 9.5 mol/nm3, a value superior
to the glycerol density in solid and liquid phases (respectively 9.1 mol/nm3 and 8.1 mol/nm3). Not surprisingly, during the geometry optimization, the organic layer relaxes to a less dense layer, with a final density of the calculated density of the optimized layer that can be estimated at 8.5 mol/nm3 (taking as the thickness of the layer the average of the top O of the glycerol molecules distances to the surface), a value in between the liquid and the solid state. This layer relaxation induces in addition the creation of lateral hydrogen bonds between the molecules, as described below.
In this structure, one of the three molecules has a stronger bond with the surface, with a Cu-O bond length of 2.12 Å (type 1). This molecule is nearly perpendicular to the surface, deviating by 18° from the normal. A second molecule (type 2) is farther from the surface with O-surface distance of 3.08 Å. This molecule has a tilt of 36° with respect to the normal to the surface. A ring is formed between the upper and middle OH group from the second molecule and the upper OH group from the first molecule. The third molecule (type 3) is still farther from the surface, the bottom O being at 3.54 Å from the surface, and has tilt angle of skeleton of 26° along surface normal. Each OH shares one H bond with neighboring molecules of type 1 and 2. As a consequence, the second and third OH groups on each molecule are positioned in such a way that they can readily form hydrogen bonds with neighboring glycerol molecules, while the first OH groups still binds to a surface Cu atom. This results in a network of intermolecular hydrogen bonds. This is visible by the top view shown in Fig. 9 (b), displaying a network of hydrogen bonds ranging in distance from 1.6 – 2.0 Å (H atoms in yellow, H-bonds presented in dashed white lines). This mixed adsorption mode indicates that the interaction between molecules play a non-negligible effect in the assembly of the organic film at higher coverage. Hydrogen bonds between adjacent glycerol molecules play essential role in stabilizing this ordered structure, as implied by the lower adsorption energy. Among these molecules, the type 2 and 3 molecules adsorbed via OH group 1 are localized nearly in the bridge sites and those adsorbed via OH group 2 (type 1) is localized on top sites. The
20 positioning of the molecules relative to the surface sites is in good agreement with results at low coverage. However, this mixed adsorption mode leads to slight distortion of the hexagonal network formed by the nearest neighbor adsorbed molecules, compared to the perfect (√3 × √3) R30° arrangement, which is further discussed below on the basis of simulated STM images.
To summarize, glycerol physisorbs on the Cu surface in forming, at low coverage, in majority van der Waals interactions, in almost a parallel orientation towards the surface which allows the maximization of weak bonds, with an energy of adsorption of -1.13 eV. At full coverage, similar adsorption energy is found, in an arrangement in which the molecules are less tilted towards the surface, which allows maximizing the surface coverage, and in turn, lateral Hydrogen bonds network between adjacent molecules is formed, which accounts for the layer cohesion.
Figure 9: DFT simulated mixed adsorption mode. (a) Side view of the glycerol molecules
position with respect to topmost copper plane; the oxygen atoms (red) that are bonded to the surface can be found in different z planes. (b) Top view of the formed network of hydrogen bonds formed (dotted white lines). The (√3 × √3) R30° cell is marked by a dotted line. The references to the molecules (type 1 to 3) is indicated, as well as the estimated thickness of the
organic layer, taken as the average top Oxygen-Surface distance.
21 STM images were simulated in order to compare the theoretical models with the experimental results. The Theoretical DFT-STM images were obtained by Tersoff-Hamann approximation, where the tunneling current is proportional to the local density of state (LDOS) of the surface at the tip position integrated from the applied voltage bias to the Fermi level 56,57. We used
p4vasp software package 58 to generate the virtual STM images. We choose low and high
isodensity of 10-3 and 102 electrons/ Å3 respectively, to obtain the best images in comparison
to experiment. Analysis of the density of states (DOS) was first performed to obtain a better understanding of the electronic properties that are probed during STM imaging. The DOS analysis of the glycerol/copper system presented in Figs. 8 (b) and 9 is shown in Fig. 10 (a) for an energy window of ±10 eV with respect to the Fermi level. The total density of states DOS (red line) is dominated by the projected DOS of copper (green line), with small contributions from glycerol (blue line). However, considering that the tunneling current exponentially decreases with increasing tip-surface distance, it can be reasonably assumed that the copper atoms will not significantly contribute to the tunneling current in presence of the adsorbed layer of glycerol. This assumption is supported by previous STM results for co-adsorbed Cu/SO42- adlayer on Au(111) 59. The nonmetallic (sulfate) (√3 × √3) R30° adlayer
structure was imaged by STM rather than the metallic (copper) adlayer. This effect was attributed to the fact that sulfate protruded further from the surface than Cu, thereby decreasing the distance with the tip. Hence, only the projected density of states PDOS of glycerol has been further considered. It is shown in Fig. 10 (b) for an energy window of ±1.5 eV with respect to the Fermi level. There are several C, O and H atoms in glycerol, and hence, we averaged the DOS for every type of atom. Figure 10 (b) shows that both the occupied and unoccupied states near the Fermi level are dominated by the contribution of the oxygen orbitals (pink line), with smaller contributions of the carbon atoms (turquoise line).
22
Figure 10: Density of states (DOS) analysis for the adsorbed configuration shown in Fig. 8
(c) and Fig. 9.
The calculated virtual STM images are presented in Fig. 11. They were produced for the two different adsorption configurations discussed in the previous section. Figs. 11 (a) and (c) correspond to the perfect hexagonal network of nearest neighbor adsorbed molecules shown in Figure 8 (a) and described by the (√3 × √3) R30° supercell, while Figs. 11 (b) and (d) correspond to the most energetically stable but distorted network, the mixed adsorption mode shown in Figure 8 (b) and described by the (3 × 3) supercell. In order to accurately mimic the experimental data, the images were obtained at constant current density, while changing the cross-section in the DOS that is projected on the plane. The highest occupied states near the Fermi level were considered, as the experimental images were obtained at negative sample bias. More precisely, Fig. 11 (a) and (b) were obtained by projecting an occupied DOS at negative bias near to the Fermi level edge and at a high iso-surface density, which takes into account only the dominating molecular orbitals while Fig. 11 (c) and (d) were obtained at low iso-surface density, which takes into account all contributing atomic orbitals in the potential range. At high iso-surface density, there is a strong contribution of oxygen atoms near the Fermi level, particularly oxygen via which the molecule adsorbs on the Cu(111) surface. Hence, the oxygen atoms near the copper surface in the adsorbed glycerol molecules are
23 responsible for the tunneling maxima (white spots) in Fig. 11 (a) and (b). Conversely, at low isodensity, the contributions of orbitals from different atoms of the glycerol molecules are included. In the case of the perfect hexagonal network of nearest neighbor adsorbed molecules, the √3𝑥√3) R30° arrangement is reproduced by the simulated images independently of the isodensity considered (Figs. 11 (a) and (c)). In the case of the distorted network, the image simulated at high isodensity (Fig. 11 (b)) reproduces the distortion from a perfect nearest neighbor arrangement owing to the different positions of the O atoms via which the molecules are adsorbed. However, the image simulated at low isodensity (Fig. 11 (d)) shows nearly no distortion from the √3𝑥√3) R30° arrangement owing to the contributions of several atoms to the tunneling maxima. Hence, although the STM images simulated at low isodensity somewhat differ, both provide support for the formation of a glycerol overlayer on the Cu(111) surface with a near perfect (√3𝑥√3) R30° network of the nearest neighbor adsorbed molecules, in accordance with the experimental data. The DFT simulations point to a more stable adsorbed molecular assembly combining adsorption by different OH end-groups and stabilized by vdW intermolecular interactions.
24
Figure 11: DFT simulated STM images for the perfect (a, c) and distorted (b,d) (√3 ×
√3) R30° hexagonal arrangement corresponding to the adsorbed configurations in Fig. 8
(a,b) and Fig. 8 (c), respectively. The intensity of the DOS, as measured by the tip above the surface increases from dark to light bands. The blue circles mark the tunneling centers yielding intensity maxima at high (a,b) and low (c,d) isodensity of 102 and 10-3, respectively. The orange skeletons delimit the perfect and distorted hexagonal arrangements of adsorbed
25
CONCLUSIONS
Glycerol on the Cu(111) single-crystal surface was used as a model system to study the adsorption behavior of coating-based organic molecules on metal surfaces. Electrochemical measurements in 0.1M NaOH indicate that a potential-driven adsorption of glycerol is suppressing the adsorption of hydroxyls. On the basis of molecularly-resolved STM images and the corresponding DFT modeling, the formation of an organized adsorption film of glycerol nearest neighbor molecules adopting a (√3𝑥√3) R30° structure on the surface of the copper is concluded. At the surface coverage of 1 molecule for 3 Cu atoms, DFT calculations indicate that a mixed mode of adsorption is favored, with the two primary alcohol end-groups adsorbed at different distances relative to the copper surface. This variation in the hydroxyl group orientation and position enabled the formation of a 3D network of hydrogen bonds between adjacent glycerol molecules perpendicular to the surface. This mixed mode of adsorption, combining the two most stable configurations found at lower, sub-monolayer converge, indicates that the interactions between molecules play an essential role in stabilizing this ordered structure and, therefore, in the assembly process of the organic film.
Corresponding Authors
* philippe.marcus@chimieparistech.psl.eu and * Shoshan.Abrahami@vub.be
Acknowledgments
S.A acknowledges funding from the Fonds Wetenschappelijk Onderzoek in Flanders (FWO, postdoctoral grant 12Z2418N).
REFERENCES
1. Hughes, A. E.; Mol, J. M.; Zheludkevich, M. L.; Buchheit, R. G., Active Protective Coatings: New-Generation Coatings for Metals. Springer: 2016.
2. Abrahami, S. T.; Hauffman, T.; de Kok, J. M. M.; Mol, J. M. C.; Terryn, H. Effect of Anodic Aluminum Oxide Chemistry on Adhesive Bonding of Epoxy, J. Phys. Chem. C 2016, 120, 19670-19677.
26 3. Ballerini, G.; Ogle, K.; Barthés-Labrousse; M. G. The acid–base properties of the surface of native zinc oxide layers: An XPS study of adsorption of 1,2-diaminoethane, Appl. Surf. Sci.
2007, 253, 6860-6867.
4. Pletincx, S.; Fockaert, L.-L.I.; Meeusen, M.; Mol, J.M. C.; Terryn, H.; Hauffman, T. In Situ Methanol Adsorption on Aluminum Oxide Monitored by a Combined ORP-EIS and ATR-FTIR Kretschmann Setup, J. Phys. Chem. C 2018, 122, 21963-21973.
5. Totani, R.; Méthivier, C.; Cruguel, H.; Pradier, C.-M.; Humblot, V. Deciphering the Adsorption Mechanisms of RGD Subunits: l-Aspartic Acid on Cu(110), J. Phys. Chem. C
2017, 121, 15842-15850.
6. Abrahami S T,; Hauffman T,; de Kok J M M,; Terryn H,; Mol J M C. The role of acid-base properties in the interactions across the oxideprimer interface in aerospace applications,
Surf. Interface Anal. 2016, 48, 712–720.
7. Abel, M.-L.; Watts, J. F.; Digby, R. P.; The adsorption of alkoxysilanes on oxidised aluminium substrates, Int. J. Adhes. Adhes. 1998, 18, 179-192.
8. Nowicki, M.; Wandelt, K., Electrochemical Scanning Tunneling Microscopy. In
Encyclopedia of Interfacial Chemistry, Elsevier: Oxford, 2018; 108-128.
9. Maurice, V.; Strehblow, H. H.; Marcus, P., In Situ Stm Study of the Initial Stages of Oxidation of Cu(111) in Aqueous Solution. Surf. Sci. 2000, 458, 185-194.
10. Kunze, J.; Maurice, V.; Klein, L. H.; Strehblow, H.-H.; Marcus, P., In Situ Scanning Tunneling Microscopy Study of the Anodic Oxidation of Cu(111) in 0.1 M Naoh. J. Phys.
Chem. B 2001, 105, 4263-4269.
11. Kunze, J.; Maurice, V.; Klein, L. H.; Strehblow, H.-H.; Marcus, P., In Situ Stm Study of the Duplex Passive Films Formed on Cu(1 1 1) and Cu(0 0 1) in 0.1 M Naoh. Corros. Sci.
2004, 46, 245-264.
12. Suggs, D. W.; Bard, A. J., Scanning Tunneling Microscopic Study with Atomic Resolution of the Dissolution of Cu(111) in Aqueous Chloride Solutions. J. Am. Chem. Soc.
1994, 116, 10725-10733.
13. Kunze, J.; Maurice, V.; Klein, L. H.; Strehblow, H.-H.; Marcus, P., In Situ Stm Study of the Effect of Chlorides on the Initial Stages of Anodic Oxidation of Cu(111) in Alkaline Solutions. Electrochim. Acta 2003, 48, 1157-1167.
14. Wilms, M.; Broekmann, P.; Stuhlmann, C.; Wandelt, K., In-Situ Stm Investigation of Adsorbate Structures on Cu(111) in Sulfuric Acid Electrolyte. Surf. Sci. 1998, 416, 121-140. 15. Inukai, J.; Osawa, Y.; Itaya, K., Adlayer Structures of Chlorine, Bromine, and Iodine on Cu(111) Electrode in Solution: In-Situ Stm and Ex-Situ Leed Studies. J. Phys. Chem. B
1998, 102, 10034-10040.
16. Li, W. H.; Wang, Y.; Ye, J. H.; Li, S. F. Y., In Situ Stm Study of Chloride Adsorption on Cu(110) Electrode in Hydrochloric Acid Aqueous Solution. J. Phys. Chem. B 2001, 105, 1829-1833.
17. Mei-Juan, H.; Qing-Dao, Z.; Li-Jun, W.; Chun-Li, B., Adlayer Structures of Binaphthyl Derivatives on Cu(111). Chem. Lett. 2003, 32, 702-703.
27 18. Soichiro, Y., Molecular Assemblies of Functional Molecules on Gold Electrode Surfaces Studied by Electrochemical Scanning Tunneling Microscopy: Relationship between Function and Adlayer Structures. Bull. Chem. Soc. Jpn. 2006, 79, 1167-1190.
19. Stephan, B.; Duc, T. P.; Sascha, H.; Knud, G.; Caroline, Z.; Ralf, H.; Klaus, W.; Peter, B., Organic Layers at Metal/Electrolyte Interfaces: Molecular Structure and Reactivity of Viologen Monolayers. New J. Phys. 2008, 10, 125033.
20. Hai, N. T. M.; Furukawa, S.; Vosch, T.; De Feyter, S.; Broekmann, P.; Wandelt, K., Electrochemical Reactions at a Porphyrin-Copper Interface. PCCP 2009, 11, 5422-5430. 21. Garcia, J. L.; Tongol, B. J. V.; Yau, S.-L., Dynamic Self-Assembly and Electropolymerization Processes of 3,4-Ethylenedioxythiophene on Au(1 0 0) Single Crystal Electrode as Probed by in Situ Scanning Tunneling Microscopy. Electrochim. Acta 2012, 71, 302-309.
22. Vaz-Domínguez, C.; Escudero-Escribano, M.; Cuesta, A.; Prieto-Dapena, F.; Cerrillos, C.; Rueda, M., Electrochemical Stm Study of the Adsorption of Adenine on Au(111) Electrodes. Electrochem. Commun. 2013, 35, 61-64.
23. Kunze-Liebhäuser J.; Electrochemical Scanning Tunneling Microscopy Studies of Copper Oxide Formation—A Review, Reference Module in Chemistry, Molecular Sciences and Chemical Engineering, Elsevier 2017.
24. Horcas, I.; Fernández, R.; Gómez-Rodríguez, J.M.; Colchero, J.; Gómez-Herrero, J.; Baro, A.M.; WSXM: A software for scanning probe microscopy and a tool for nanotechnology, Rev. Sci. Instrum. 2007, 78, 013705.
25. Kresse, G; Hafner, J.; Ab initio molecular dynamics for liquid metals, Phys. Rev. B
1993, 47 558-561.
26. Kresse, G.; Furthmüller, J.; Efficient iterative schemes for ab initio total-energy calculations using a plane-wave basis set, Phys. Rev. B 1996, 54, 11169-11186.
27. Kresse, G.; Furthmüller, J.; Efficiency of ab-initio total energy calculations for metals and semiconductors using a plane-wave basis set, Comput. Mater. Sci. 1996, 6, 15-50.
28. Blöchl, P.E.; Projector augmented-wave method, Phys. Rev. B 1994, 50, 17953-17979. 29. Kresse, G.; Joubert, D.; From ultrasoft pseudopotentials to the projector augmented-wave method, Phys. Rev. B 1999, 59, 1758-1775.
30. Perdew, J.P.; Burke, K.; Ernzerhof, M.; Generalized Gradient Approximation Made Simple, Phys. Rev. Lett. 1996, 77, 3865-3868.
31. Perdew, J.P.; Burke, K.; Ernzerhof, M.; Generalized Gradient Approximation Made Simple [Phys. Rev. Lett. 77, 3865 (1996)], Phys. Rev. Lett. 1997, 78, 1396-1396.
32. Grimme, S.; Semiempirical GGA-type density functional constructed with a long-range dispersion correction, J. Comput. Chem. 2006, 27, 1787-1799.
33. Methfessel, M.; Paxton, A.T.; High-precision sampling for Brillouin-zone integration in metals, Phys. Rev. B 1989, 40, 3616-3621.
28 34. Monkhorst, H.J.; Pack, J.D.; Special points for Brillouin-zone integrations, Phys.
Rev. B 1976, 13, 5188-5192.
35. Paixão, T.R.L.C.; Ponzio, E.A.; Torresi, R.M.; Bertotti, M.; EQCM Behavior of Copper Anodes in Alkaline Medium and Characterization of the Electrocatalysis of Ethanol Oxidation by Cu(III), J. Braz. Chem. Soc. 2006, 17, 374-381.
36. Maruta, A.H.; Paixão, T.R.L.C.; Flow injection analysis of free glycerol in biodiesel using a copper electrode as an amperometric detector, Fuel 2012, 91, 187-191.
37. Habibi, B.; Delnavaz, N.; Electrooxidation of glycerol on nickel and nickel alloy (Ni-Cu and Ni-Co) nanoparticles in alkaline media, RSC Adv. 2016, 6, 31797-31806.
38. Luo, M.Z.; Baldwin, R.P.; Characterization of carbohydrate oxidation at copper electrodes, J. Electroanal. Chem. 1995, 387, 87-94.
39. Chi-Ucan, S.L.; Castillo-Atoche, A.; Castro Borges, P.; Manzanilla-Cano, J.A.; Gonzalez-Garcia, G.; Patino, R.; Diaz-Ballote, L.; Inhibition Effect of Glycerol on the Corrosion of Copper in NaCl Solutions at Different pH Values, J. of Chem. 2014, 10.
40. Shaker, M.; Abdel-Rah, H. H.; Corrosion of Copper Metal in Presence of Binary Mixtures, Am. j. appl. sci. 2007, 4, 554-564.
41. Szőcs, E.; Bakó, I.; Kosztolányi, T.; Bertóti, I.; Kálmán, E.; EC-STM study of 5-mercapto-1-phenyl-tetrazole adsorption on Cu(1 1 1), Electrochim. Acta, 2004, 49, 1371-1378.
42. Copeland, J.R.; Shi, X.-R.; Sholl, D.S.; Sievers, C.; Surface Interactions of C2 and C3 Polyols with γ-Al2O3 and the Role of Coadsorbed Water, Langmuir 2013, 29, 581-593. 43. Strehblow, H.-H.; Maurice, V.; Marcus, P.; Initial and later stages of anodic oxide formation on Cu, chemical aspects, structure and electronic properties, Electrochim. Acta,
2001, 46, 3755-3766.
44. Phan, T.H.; Kosmala, T.; Wandelt, K.; Potential dependence of self-assembled porphyrin layers on a Cu(111) electrode surface: In-situ STM study, Surf. Sci. 2015, 631, 207-212.
45. Schlaup, C.; Horch, S.; In-situ STM study of phosphate adsorption on Cu(111), Au(111) and Cu/Au(111) electrodes, Surf. Sci. 2013, 608, 44-54.
46. Magnussen, O.M.; Ordered Anion Adlayers on Metal Electrode Surfaces, Chem. Rev.
2002, 102, 679-726.
47. Callam, C. S.; Singer, S. J.; Lowary, T. L.; Hadad, C. M., Computational Analysis of the Potential Energy Surfaces of Glycerol in the Gas and Aqueous Phases: Effects of Level of Theory, Basis Set, and Solvation on Strongly Intramolecularly Hydrogen-Bonded Systems. J.
Am. Chem. Soc. 2001, 123, 11743-11754.
48. Tereshchuk, P.; Chaves, A. S.; Da Silva, J. L. F., Glycerol Adsorption on Platinum Surfaces: A Density Functional Theory Investigation with Van Der Waals Corrections. J.
29 49. Chelli, R.; Procacci, P.; Cardini, G.; G. Della Valle, R.; Califano, S., Glycerol Condensed Phases Part I. A Molecular Dynamics Study. PCCP 1999, 1, 871-877.
50. Chelli, R.; Procacci, P.; Cardini, G.; Califano, S., Glycerol Condensed Phases Part I.A Molecular Dynamics Study of the Conformational Structure and Hydrogen Bonding. PCCP
1999, 1, 879-885.
51. H. van Koningsveld The crystal structure of glycerol and its conformation, Recl. Trav. Chim. Pays-Bas, 1968, 87, 243-254.
52. Champeney, D. C.; Joarder, R. N.; Dore, J. C., Structural Studies of Liquid D-Glycerol by Neutron Diffraction. Mol. Phys. 1986, 58, 337-347.
53. Garawi, M.; Dore, J. C.; Champeney, D. C., Structural Studies of Liquid D-Glycerol.
Mol. Phys. 1987, 62, 475-487.
54. Liu, B.; Greeley, J.; Decomposition Pathways of Glycerol via C–H, O–H, and C–C Bond Scission on Pt(111): A Density Functional Theory Study, J. Phys. Chem. C 2011, 115, 19702-19709.
55. Baltrusaitis, J.; Valter, M.; Hellman, A.; Geometry and Electronic Properties of Glycerol Adsorbed on Bare and Transition-Metal Surface-Alloyed Au(111): A Density Functional Theory Study, J. Phys. Chem. C 2016, 120, 1749-1757.
56. Tersoff, J.; Hamann, D. R. D.; Theory of the scanning tunneling microscope, Phys. Rev. B
1985, 31, 805.
57. Steven J. Tjung; Qiang Zhang; Jacob J. Repicky; Simuck F. Yuk; Xiaowa Nie; Nancy M. Santagata; Aravind Asthagiri; Jay A. Gupta; STM and DFT studies of CO2 adsorption on O-Cu(100) surface; Surface Science 2019, 679, 50–55.
58. p4vasp, the VASP Visualization Tool, http://www.P4vasp.at (accessed Oct 10, 2018). 59. Weaver, M.J.; Electrochemical Interfaces: Some Structural Perspectives, J. Phys.
30 TOC Graphic