Application Of A Particle Swarm Optimization In An Optimal Power Flow
13
0
0
Texte intégral
(2) D. Ben Attous et al.. J Fundam Appl Sci. 2010, 2(2), 241-253. 242. Solving the static ED problem is subject to the power balance constraints and generator operating limits. For the dynamic ED, it is an extension of the static ED problem. The dynamic ED takes the ramp rate limits and prohibited operating zone of the generating units into consideration [1]. The methods for solving this kind of problem include traditional operational research algorithms (such as linear programming, quadratic programming, dynamic programming, gradient methods and Lagrange relaxation approaches) and modern heuristic methods (such as artificial neural networks, simulated annealing and evolutionary algorithms). Some of these methods are successful in locating the optimal solution, but they are usually slow in convergence and require heavy computational cost. Some other methods may risk being trapped to a local optimum, which is the problem of premature convergence. Recently, intelligence heuristic algorithms, such as genetic algorithm, evolutionary programming, and meta-heuristic algorithms have been proposed for solving the OPF problem[2] Like other meta-heuristic algorithms, particle swarm optimization (PSO) algorithm was developed through simulation of a simplified social system such as bird flocking and fishing school. PSO is an optimization method based on population [3], and it can be used to solve many complex optimization problems, which are nonlinear, non-differentiable and multi-modal. The most prominent merit of PSO is its fast convergence speed. In addition, PSO algorithm can be realized simply for less parameters need adjusting. PSO has been applied to various power system optimization problems with impressive success [4]. The main objective of this study is to introduce the use of Particle Swarm Optimization (PSO) technique to the subject of power system economic load dispatch. In this paper, the PSO method has been employed to solve economic dispatch problem. This feature led to the reduction of total execution time of the algorithm when compared to other reported methods. In this paper, the PSO-POF method is presented and used to solve the ELD problem under some equality and inequality constraints. An application was performed on the IEEE 30 bus, 6 generators test system. Simulation results confirm the advantage of computation rapidity and solution accuracy. The feasibility of the proposed method is to demonstrated and compared to those reported in the literature. The results are promising and show the effectiveness of the proposed method..
(3) D. Ben Attous et al.. J Fundam Appl Sci. 2010, 2(2), 241-253. 243. The results for a test system show that PSO is an effective method to solve OPF problem.. 2. PROBLEM FORMULATION The optimal power flow problem is concerned with optimization of steady state power system performance with respect an objective F while subject to numerous constraints. For optimal active power dispatch, the objective function F is total generation cost as expressed follows: N. min F (a i bi PGi ci PGi2 ). (1). i 1. Where: N: total number of generation units ai, bi, and ci: cost coefficients of generating unit. Pgi: real power generation of ith unit. i= 1, 2 … to N. Subject to: Equality constraints as: N. Pgi Pdi Vi Vj Yji cos(i j ij ) 0 j 1. and. (2) N. Q gi Qdi Vi Vj Yji sin(i j ij ) 0 j 1. Inequality constraints as: Branch flow limits:. Si S imax. i 1,...nl. (3). Where: nl: number of lines. Voltage at load buses. SD. min. Si S D. max. i 1,...nd. (4). Where: nd: number of load buses. Generator MVAR QGimin QGi QGimax. i 1,...N. (5). Slack bus MW PGmin PG PGmax. (6).
(4) D. Ben Attous et al.. J Fundam Appl Sci. 2010, 2(2), 241-253. 244. Transformer tap setting t kmin t k t kmax. (7). Upper and lower bounds with bus voltage phase angles: imin i imax. (8). 3. PARTICLE SWARM OPTIMIZATION Particle swarm optimization (PSO) is a population-based optimization method first proposed by Kennedy and Eberhart in 1995, inspired by social behavior of bird flocking or fish schooling. The PSO as an optimization tool provides a population-based search procedure in which individuals called particles change their position (state) with time. In a PSO system ,particles fly around in a multidimensional search space . During flight, each particle adjusts its position according to its own experience (This value is called pbest), and according to the experience of a neighboring particle (This value is called gbest), made use of the best position encountered by itself and its neighbor (Figure 1). Xk+1. Vk+1 Vk. Gbestk. VGbest Xk VPbest. Pbestk. Fig.1. Concept of a searching point by PSO.. This modification can be represented by the concept of velocity. Velocity of each agent can be modified by the following equation:. vk 1 w.vk c1rand* ( pbest xk ) c2rand* ( gbest xk ). (9). Using the above equation, a certain velocity, which gradually gets close to pbest and gbest can be calculated. The current position (searching point in the solution space) can be modified by the following equation:.
(5) D. Ben Attous et al.. J Fundam Appl Sci. 2010, 2(2), 241-253. x k 1 x k v k 1 , k 1, 2 ,..., n. 245. (10). Where:. x k is current searching point, x k 1 is modified searching point, v k is current velocity , v k 1 is modified velocity of agent Vpbest is velocity based on pbest ,Vgbest is velocity. based on gbest, n is number of particles in a group, m is number of members in a particle, pbesti is pbest of agent k, gbesti is gbest of the group, w is weight function for velocity of agent k , ci is weight coefficients for each term . -. c1 and c2 are two positive constants.. -. r1 and r2 are two randomly generated numbers with a range of [0,1].. -. w is the inertia weight and it is defined as a function of iteration index k as follows:. w(k ) wmax (. wmax wmin ) * k. Max.Iter.. (11). Where Max.Iter , k is maximum number of iterations and the current number of iterations, respectively. To insure uniform velocity through all dimensions, the maximum velocity is as.. v max ( x max x min ) / N .. (12). Where N is a chosen number of iterations. 3.1.. Applied to optimal power flow. The cost function is defined as: N. F (ai bi PGi ci PGi2 ).. (13). i 1. To minimize F is equivalent to getting a minimum fitness value in the searching process. The particle that has lower cost function should be assigned a fitness value. The objective of OPF has to be changed to the maximization of fitness to be used as follows: F / f max ; fitness 0 ;. if. f max F otherwise. (14). The PSO-based approach for solving the OPF problem to minimize the cost takes the following steps:.
(6) D. Ben Attous et al.. J Fundam Appl Sci. 2010, 2(2), 241-253. 246. Step 1: randomly generated initial population. Step 2: For each particle, the construction operators are applied. Step 3: the Newton Raphson routine is applied to each particle. Step 4: fitness function evaluation. Step 5: compare particles fitness function and determine pbest and gbest. Step 6: change of particles velocity and position according to (9) and (10) respectively. Step 7: If the iteration number reaches the maximum limit, go to Step 8. Otherwise, set iteration index k = k + 1, and go back to Step 2. Step 8: Print out the optimal solution to the target problem. Start Initialization Gen=1 Random Initial Population. Initialize particle population Load flow Fitness Function evaluation Gen=Gen+1. Record Pbest, Gbest Update particle position and velocity Yes Gen ≤ maxGen. Plot fitness Vs generation graph End Fig.2. PSO-OPF computational procedure..
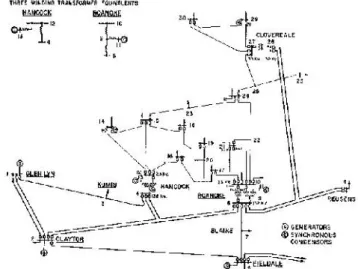
(7) D. Ben Attous et al.. 3.2.. J Fundam Appl Sci. 2010, 2(2), 241-253. 247. Load flow calculation. Once the reconstruction operators have been applied and the control variables values are determined for each particle a load flow run is performed. Such flows run allows evaluating the branches active power flow, the total losses and voltage magnitude this will provide updated voltages angles and total transmission losses. All these require a fast and robust load flow program with best convergence properties; the developed load flow process is upon the full Newton Raphson algorithm. 3.3.. Simulation results and discussion. The proposed PSO algorithm is tested on standard IEEE 30 bus system shown in Fig. 3. The test system consists of 6 thermal units (Table1), 24 load buses and 41 transmission lines of which four of the branches (6-9), (6-10), (4-12) and (28-27) are with the tap setting transformer. The total system demand is 283.4 MW. The program was written and executed on Pentium 4 having 2.4 GHZ 1GB DDR RAM. The optimal setting of the PSO control parameters are: c1=0.5, c2=0.5, numbers of particles is 50 and number of generations is 30. The Inertia weight was kept between 0.4 and 0.9.. Fig.3. IEEE 30-BUS Electrical Network.. Figure 4 shows the cost convergence of PSO based OPF algorithm for various numbers of generations. It was clearly shown that there is no rapid change in the fuel cost function value after 30 generations. Hence it is clears that the solution is converged to a high quality solution at the early iterations (13 iterations)..
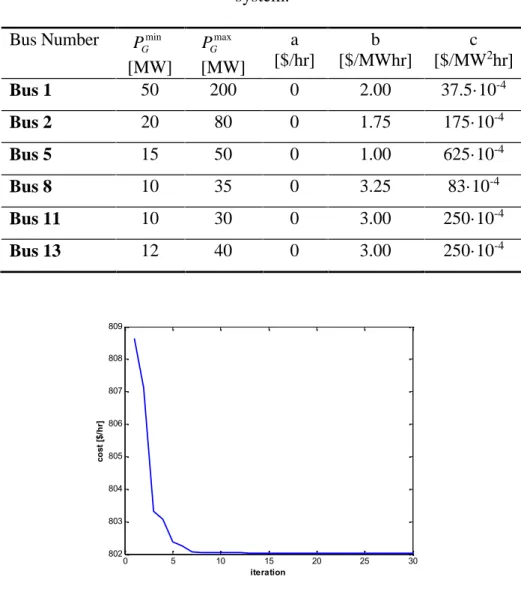
(8) D. Ben Attous et al.. J Fundam Appl Sci. 2010, 2(2), 241-253. 248. Tableau 1. Power generation limits and generator cost parameters of IEEE 30 bus system. PGmax [MW] 200. a [$/hr]. b [$/MWhr]. c [$/MW2hr]. Bus 1. PGmin [MW] 50. 0. 2.00. 37.5·10-4. Bus 2. 20. 80. 0. 1.75. 175·10-4. Bus 5. 15. 50. 0. 1.00. 625·10-4. Bus 8. 10. 35. 0. 3.25. 83·10-4. Bus 11. 10. 30. 0. 3.00. 250·10-4. Bus 13. 12. 40. 0. 3.00. 250·10-4. Bus Number. 809 808. cost [$/hr]. 807 806 805 804 803 802. 0. 5. 10. 15 iteration. 20. 25. 30. Fig.4. Convergence characteristic of the IEEE 30 bus system. The algorithm reaches a minimize cost of 802.0136 $/hr and a minimize loss of 9.3301 MW..
(9) D. Ben Attous et al.. J Fundam Appl Sci. 2010, 2(2), 241-253. genration N°1. cost [$/hr]. 950. 803.2. 802.55. 802.8 850. 802.6 0. 802.4 200 170. 100 Pg1 [MW]. genration N°1. 950. 803.2. 800. 802.5. 803 802.5. 802.4 100 45. 50. 802 801.5. 802.55. 802.6 0. 802.4 802.35. generation N°5. 802.8 850. 803.5. 802.3 190 176. 180. 803. 900. generation N°10. 802.45. 803. 900. 800. cost [$/hr]. generation N°5. generation N°15. 801 180 175.6 175.8 176. 178. generation N°10. 803.5. 802.5. 803. 802.45. 802.5. 802.4. 802. 802.35. 801.5. 802.3 55 46. 50. 249. generation N°15. 801 50 48. 48. 48.5. 49. Pg2 [MW]. generation N°1. cost [$/hr]. 950. 802.55. 802.8 850. 802.6 802.4 50 15. 0 Pg3 [MW]. generation N°1. 950. 803.2. 850 800. 803 802.5. 802.4. 802. 802.35. 801.5. 802.3 25 21. 20. generation N°10. 802.55. 802.8 802.6 0. 20. 802.4 40 15. 803.5. 802.5. 22. generation N°10. 803.5 803. 802.45. 802.5. 802.4. 802. 802.35. 801.5. 802.3 25 19. 20. 20. generation N°15. 801 23 20.5 21 21.5 22. 802.5. 803. 900. generation N°10. 802.45. 803. 900. 800. cost [$/hr]. generation N°5. 803.2. generation N°15. 801 21 22. 22.5. 23. Pg4 [MW]. generation N°1. cost [$/hr]. 950. 803.2. generation N°5. 802.8 850. 802.6 20. 802.4 30 10. Pg5 [MW]. generation N°1. 950. 803.2. 800. 803 802.5. 0. 20. 802 801.5. 802.3 14 11.5 802.55. 802.6 802.4 40 12. 802.4 802.35. genration N°5. 802.8 850. 14. 803.5. 802.5. 12. 803. 900. generation N°10. 802.45. 803. 900. 800 10. cost [$/hr]. 802.55. 12. 801 12.5 12. generation N°10. 803.5. 802.5. 803. 802.45. 802.5. 802.4. 802. 802.35. 801.5. 802.3 16 12. 13. generation N°15. 12.5. generation N°15. 801 14 11.5. 12. 12.5. Pg6 [MW]. Fig.5. Evolution of the people of the power generated optimal function iterations. The minimize cost and power loss obtained by the proposed algorithm is less than value reported in [7, 8, 9, 10, 11] using the evolutionary copulation techniques, genetic algorithm, Ant colony optimization for the some test systems. The results gotten.
(10) D. Ben Attous et al.. J Fundam Appl Sci. 2010, 2(2), 241-253. 250. including cost and power losses are compare with those acquired by others methods and present on tables 2 and 3.. Tableau 2. Results PSO-OPF compared with N.R. and QN-OPF methods for the IEEE 30 bus electrical network N-R. QN-OPF. PSO-OPF. Pg1 [MW]. 99.211. 170.237. 175.6915. Pg2 [MW]. 80.00. 44.947. 48.6390. Pg5 [MW]. 50.00. 28.903. 21.4494. Pg8 [MW]. 20.00. 17.474. 22.7200. Pg11 [MW]. 20.00. 12.174. 12.2302. Pg13 [MW]. 20.00. 18.468. 12.0000. Power Loss [MW]. 5.812. 8.805. 9.3301. 901.918. 807.782. 802.0136. Generation cost [$/hr]. The results show that PSO algorithm gives much better results than the classical method. The difference in generation cost between these methods and in Real power loss clearly shows the advantage of this method. In addition, it is important to point out that this simple PSO algorithm OPF converge in an acceptable time. For this system was converged to highly optimal solutions set after 8 generations.. Tableau 3. Comparison of the PSO-OPF with different methods EP-OPF [8] 173.8262. ACO-OPF [9] 177.8635. IEP [10] 176.2358. SADE_ALM [11] 176.1522. PSO-OPF. Pg1 [MW]. GA-OPF [7] 178.0872. Pg2 [MW]. 48.722. 49.998. 43.8366. 49.0093. 48.8391. 48.6390. Pg5 [MW]. 21.454. 21.386. 20.8930. 21.5023. 21.5144. 21.4494. Pg8 [MW]. 20.954. 22.63. 23.1231. 21.8115. 22.1299. 22.7200. Pg11 [MW]. 11.768. 12.928. 14.0255. 12.3387. 12.2435. 12.2302. Pg13 [MW]. 12.052. 12.00. 13.1199. 12.0129. 12.0000. 12.0000. Power Loss [MW] Generation cost [$/hr] Time [Sec]. 9.6372. 9.3683. 9.4616. 9.5105. 9.4791. 9.3301. 802.4484. 802.5557. 803.123. 802.465. 802.404. 802.0136. 315. 51.4. 20. -. -. 47.67. 175.6915.
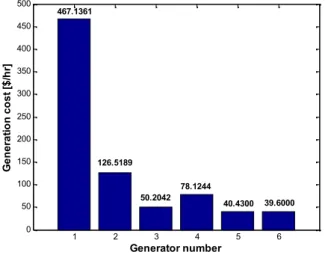
(11) D. Ben Attous et al.. J Fundam Appl Sci. 2010, 2(2), 241-253. 251. The best solutions, which are shown in Table 3, clearly, the PSO–OPF algorithm method has always better solutions than those of the other methods. This signifies the higher quality solution obtained by the proposed algorithm. Figure 9 shows distribution the generation cost of the best solution for 283.4 MW load demand. The simulation results in the IEEE 30 bus system demonstrate the feasibility and effectiveness of the proposed method PSO–OPF in minimizing cost of the generator. It is useful for obtaining high quality solution in a very less time compared to other methods GA-OPF [7], EP-OPF [8], ACO-OPF [9], IEP [10] and SADE_ALM [11]. The comparisons of computational time of the five methods are shown in Figure 11. clearly the computational time of the PSO–OPF algorithm method is lowest in comparison to those of the other methods. The security constraints are also checked for voltage magnitudes and angles. Simulation results give the voltage magnitudes are from the minimum of 1.0040 p.u. to maximum of 1.06 p.u (Figure 5), and the angles are from the minimum of -14.0652° to the maximum of 0.0° (Figure 7). 1.07. Voltage magnitude (p.u). 1.06 1.05 1.04 1.03 1.02 1.01 1. 0. 5. 10. 15 bus number. 20. 25. 30. Fig.6. The Voltages after optimization for the IEEE 30 bus system. 0. Voltage angle (°). -5. -10. -15. 0. 5. 10. 15 bus number. 20. 25. 30. Fig.7. The voltage angles after optimization for the IEEE 30 bus system..
(12) D. Ben Attous et al.. J Fundam Appl Sci. 2010, 2(2), 241-253. 500. 252. 467.1361. 450. Generation cost [$/hr]. 400 350 300 250 200 150. 126.5189. 100 50.2042. 50 0. 1. 2. 3. 78.1244. 4. Generator number. 40.4300. 39.6000. 5. 6. Fig.8. Generating operating states. Figure 8 shows operating states of generating obtained by PSO based OPF algorithm for the minimum solution of the PSO algorithm.. 4. CONCLUSION In this study PSO algorithm has been developed for determination of global optimum solution for economic dispatch. The performance of the proposed algorithm demonstrated through its evolution on IEEE 30 bus power system. To demonstrate the superiority of PSO optimal results have been compared with varies techniques available in literature namely, genetic algorithm, ant colony optimized. The results show that the optimal dispatch solutions determined by PSO lead to lower active power loss then that found by other methods, which confirms that the PSO is well capable of determining the global or near global optimum dispatch solution.. 5. REFERENCES [1] Pothiya S., Ngamroo I., Kongprawechnon W. Energy Conversion and Management. 2008, 49(4), 506-516. [2] Gao H., Zhou C., Gao L. Progress in Intelligence Computation & Applications. 2005, 594-599. [3] Kennedy J. and Eberhart R.1995, Particle swarm optimization, IEEE Int. Conf on Neural Networks, Perth, Australia, 1942-1948 p. [4] Kwang Y. L., Jong-Bae P. IEEE, 2006, 188-192 p. [5] Ajay P., Vimal Raj D., Palanivelu T. G. J. Electrical Systems. 2007, 3(1), 13-25..
(13) D. Ben Attous et al.. J Fundam Appl Sci. 2010, 2(2), 241-253. 253. [6] Roa–Sepulveda C. A. and Pavez–Lazo B. J. 2001, A solution to the optimal power flow using simulated annealing, IEEE Porto Power Tech Conference, Porto, Portugal, 10-13p. [7] Lai L. L., Ma J. T., Yokoma R., Zhao M. Electrical Power & Energy System. 1997, 19(5), 287-292. [8] Yuryevich J., Wong K. P. IEEE Transaction on power Systems. 1999,14(4), 12451250. [9] Allaoua B., and Laoufi A. Leonardo Electronic Journal of Practices and Technologies. 2008, 88-105. [10] Ongsakul W. and Tantimaporn T. Elect. Power Comp. and Syst. 2006,34, 79-95. [11] Thitithamrongchai C., Eua-arporn B. J. Electrical Systems. 2007, 3(2), 88-99. [12] Alrashidi M. R., and El-Hawary M. E. engineering and technology. 2008, 29, 184151. [13] Yan H. and Ma R. Multiobjective electricity power dispatch using Multiobjective Particle Swarm Optimization, proceedings of the 5th WSEAS International Conference on Applied Computer Science, china, 2008, 336-340p.. How to cite this article Ben Attous D and Labbi Y. Application of a particle swarm optimization in an optimal power flow. J Fundam Appl Sci. 2010, 2(2), 241-253..
(14)
Figure
![Tableau 3. Comparison of the PSO-OPF with different methods GA-OPF ]7[ EP-OPF]8[ ACO-OPF[9] IEP[10] SADE_ALM]11[ PSO-OPF Pg1 [MW] 178.0872 173.8262 177.8635 176.2358 176.1522 175.6915 Pg2 [MW] 48.722 49.998 43.8366 49.0093 48.8391 48.6390 Pg5 [MW] 21.454 2](https://thumb-eu.123doks.com/thumbv2/123doknet/7805106.260960/10.892.120.819.818.1150/tableau-comparison-pso-opf-different-methods-opf-sade.webp)
Documents relatifs
The application of the PSO method to adjust parameters of deep neural networks used for the machine learning process would be based on the fact that the PSO algo- rithm would
GravPSO2D: A Matlab package for 2D gravity inversion in sedimentary basins using the Particle Swarm Optimization algorithm...
A Novel Distributed Particle Swarm Optimization Algorithm for the Optimal Power Flow ProblemN. Nicolo Gionfra, Guillaume Sandou, Houria Siguerdidjane, Philippe Loevenbruck,
This rounding heuristic consists in fixing to 1 all binary variables greater or equal to 0.5 (the k great- est ones if there are more than k for the ROPF problem with
Optimal Reactive Power Dispatch (ORPD) is a special case of OPF problem in which, control parameters are the variables which have a close rela- tionship with the reactive power
In this paper, a swarm algorithm called the Social Spider Optimization (SSO) has been proposed for the optimization of two microwave filters (Rectangular waveguide H-plane three-
In this work, we havepresented the principles of the genetic algorithm functioning , itsapplication to the laminated composites and to the originaltechnique of coding which
In fact, the best solution found by the GA, here called H-GA, uses only 31% of the dimensions from the canonical version of the descriptor and still achieves a similar performance.
