International Journal of
Molecular Sciences
Article
Enrichment of Secondary Wastewater Sludge for
Production of Hydrogen from Crude Glycerol and
Comparative Evaluation of Mono-, Co- and
Mixed-Culture Systems
Vinayak Laxman Pachapur1, Prianka Kutty2, Satinder Kaur Brar1,* and Antonio Avalos Ramirez3
Received: 11 November 2015; Accepted: 6 January 2016; Published: 13 January 2016 Academic Editor: Marianne Su-Ling Brooks
1 Centre-Eau Terre Environnement, 490, Institut National de la Recherche Scientifique, Rue de la Couronne, Québec, QC G1K 9A9, Canada; vinayak.pachapur@ete.inrs.ca
2 Department of Biotechnology, National Institute of Technology Warangal, Warangal, Telangana 506004, India; priankag1994@gmail.com
3 Centre National en Électrochimie et en Technologies Environnementales, 2263, Avenue du Collège, Shawinigan, QC G9N 6V8, Canada; aaramirez@cnete.qc.ca
* Correspondence: satinder.brar@ete.inrs.ca; Tel.: +1-418-654-3116; Fax: +1-418-654-2600
Abstract:Anaerobic digestion using mixed-culture with broader choice of pretreatments for hydrogen (H2) production was investigated. Pretreatment of wastewater sludge by five methods, such as
heat, acid, base, microwave and chloroform was conducted using crude glycerol (CG) as substrate. Results for heat treatment (100 ˝C for 15 min) showed the highest H
2 production across the
pretreatment methods with 15.18 ˘ 0.26 mmol/L of medium at 30˝C in absence of complex media
and nutrient solution. The heat-pretreated inoculum eliminated H2consuming bacteria and produced
twice as much as H2as compared to other pretreatment methods. The fermentation conditions, such
as CG concentration (1.23 to 24 g/L), percentage of inoculum size (InS) (1.23% to 24% v/v) along with initial pH (2.98 to 8.02) was tested using central composite design (CCD) with H2production as
response parameter. The maximum H2production of 29.43 ˘ 0.71 mmol/L obtained at optimum
conditions of 20 g/L CG, 20% InS and pH 7. Symbiotic correlation of pH over CG and InS had a significant (p-value: 0.0011) contribution to H2production. The mixed-culture possessed better
natural acclimatization activity for degrading CG, at substrate inhibition concentration and provided efficient inoculum conditions in comparison to mono- and co-culture systems. The heat pretreatment step used across mixed-culture system is simple, cheap and industrially applicable in comparison to mono-/co-culture systems for H2production.
Keywords:crude glycerol; hydrogen; mixed-culture; secondary wastewater sludge; 1,3-propanediol
1. Introduction
Biodiesel and biohydrogen are considered as renewable, efficient and carbon dioxide (CO2)-free
fuel of choice for the future [1,2]. Biodiesel production across the world is increasing rapidly and estimated to reach 20 billion liters in 2020 due to strong government policies and incentives across the world [3,4]. About 100 kg of crude glycerol (CG) is generated as waste by-product with every ton of biodiesel produced [5]. Sustainable production and commercialization of biodiesel depends on the demand and increased utilization of CG [3]. With presence of various impurities across CG, refining for glycerin is no longer cost-effective with decreasing market value for glycerin [4,6]. Value added utilization (valorization) of waste CG into biofuels or biochemical for additional market
value represents a promising route with several advantages [7–9]. New valorization methods for the CG are exploited as a low cost, abundant feedstock, with increased substrate conversion efficiency and decreased operating costs in comparison to other organic wastes [1,6,7].
The present hydrogen (H2) production techniques by physico-chemical routes are fossil fuel
dependent, expensive and release CO2 [10]. Microbial conversion of CG to H2 production is
an attractive approach [6,11] and has gained advantage for high energy recovery potential [8,12]. H2production with utilization of waste by-product will credit CG to reduce total production costs
(by 13%–14%) of biodiesel fuels [3]. The presence of various impurities in CG is the major bottleneck for the production and recovery of value-added products [13]. However, the produced H2can be
easily separated from the fermentation media, requiring no additional purification steps and can be directly used as fuel [14], thus reducing the downstream processing cost in comparison to value-added products, such as 1,3-propanediol (1,3-PD) and ethanol requiring production at higher concentrations to minimize costly purification steps [10].
Microbial H2production using organic wastes can be divided into two steps; dark fermentation
and the photo-fermentation process [15]. Dark fermentation in absence of light has advantages in terms of a simple reactor set-up, and economical increased H2 production rate in comparison to
photo-fermentation requiring complex set-up in the presence of a light source [15–17]. Conversion of complex organic wastes into simple low molecular weight volatile fatty acids, H2 and CO2
during acidogenesis/acidification step of conventional anaerobic digestion is known as dark fermentation [18,19].
Anaerobic digestion has been considered economical during treatment of complex organic wastes [18], and researchers are focused on developing the acidogenesis stage of H2production using
mixed-culture that could be affordable and accessible [20,21]. Anaerobic digestion in the presence of mixed-culture have broader choice of organic waste feedstocks, and are easy to operate and control the growth of cultures during H2production [22].
Pretreatment steps to remove H2consuming bacteria that coexist in mixed-culture is a necessary
step and carried out using media enrichment, heat-shock, acid, alkali, chloroform and ultrasonication techniques [21–24]. Five pretreatment methods across acid, chemical, wet heat-, dry heat-shock, freezing and thawing were carried out for cattle manure sludge [25]. A comparative study across acid, heat and chloroform treatment on sewage sludge was carried out to enrich H2producing bacteria and
to eliminate methane production permanently [26]. Media enrichment is the only technique explored to date for activated sludge for H2production by mixed-culture using CG [1,8,12]. Highest H2yield
by mixed-culture using vinasse (waste of sugarcane ethanol distillation columns) resulted in 3.66 mol H2/mol sucrose [15] and using CG resulted in around 0.90–0.96 mol H2/mol glycerol [1,8]. In this
study the top five commonly appearing enrichment methods, such as heat, acid, base, microwave and chloroform were conducted to increase H2yield using CG.
The cattle manure sludge, reactor waste, soil types etc. are commonly used as seed inoculum across mixed-culture studies; in this study wastewater sludge was selected for H2 production.
The temperature of the wastewater sludge (30 ˝C) at the time of collection favors the growth
of microorganisms. However, the optimum temperature for H2 producing microorganisms is
around 37˝C and around 55˝C inhibits H
2consuming bacteria [8]. Initial experiments at different
temperatures were evaluated in this study. Optimization of fermentation parameters using statistical tools such as Central Composite Design (CCD) narrow down experimental runs, suggest the optimum parameter range and identify the dominant parameter responsible for H2 production
in fewer runs [4,15]. The parameters needed for optimization are the substrate concentration, media supplements, endo-nutrients, inoculum size and the fermentation pH [8,12,27]. Each of these input parameters are considered as important and play a dominant effect in determining the H2production [8,12]. In this study, costly media supplements and endo-nutrients concentration
was omitted to decrease the process cost by eliminating the use of expensive media components. H2production was carried out using minimal medium in presence of CG as substrate.
The impurities in CG derived from restaurant and meat processing waste have increased inhibition effect on pure-/co-cultures in comparison to impurities in CG derived from pure substrates [28]. The mixed-culture nullifies the inhibition effect of impurity to utilize complex CG with synergistic effects that appears advantageous over pure and co-culture system during glycerol fermentation [1,22]. Utilization of CG as substrate during glycerol fermentation for increased H2yield across pure-,
co-and mixed-culture system was evaluated in this study.
Glycerol fermentation follows two possible pathways (oxidative and reductive) [10]. During the oxidative pathway glycerol is converted to H2and various organic acids/alcohols. In the case of the
reductive pathway, glycerol is reduced into 1,3-PD production [10,29]. A complete shift of glycerol fermentation from a reductive to oxidative pathway with decreased 1,3-PD production will increase H2
production [5,10]. Analysis of 1,3-PD as a response factor in the central composite design (CCD) will determine the behaviour of the mixed-culture for the possible pathway during glycerol fermentation.
To date, there is disagreement on the best pretreatment methods of sludge for enriching hydrogen-producing bacteria for maximum H2 yield [30]. In this study, enrichment of secondary
wastewater sludge using different pretreatment techniques was carried out to obtain stable consortia of mixed-culture to use CG as sole substrate for H2production. To optimize the fermentation parameters,
such as CG concentration, inoculum size and fermentation pH, central composite design was used along with H2as response factor. The present study also deals with a comparative platform for H2
production using pure-, co- and mixed-culture system with CG as substrate. 2. Results and Discussion
2.1. Hydrogen Production Using Different Pretreatment Methods
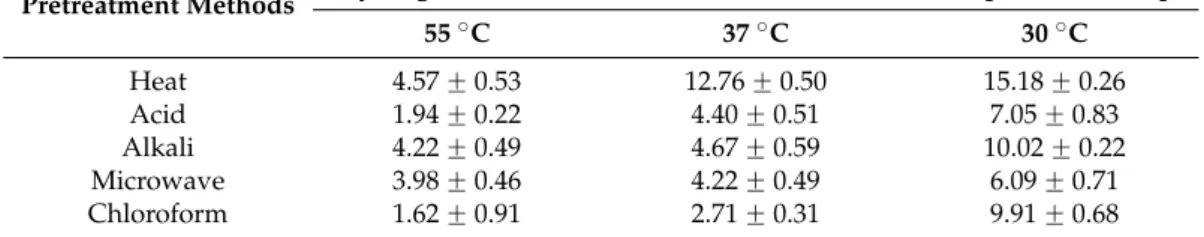
The pretreatment methods tested in this study for wastewater sludge for the inoculum enrichment for H2production are presented in the Table1. The heat treatment resulted in increased production
(15.18 ˘ 0.26 mmol/L) in comparison to other methods using CG as substrate. The production using heat treatment at 30 ˝C (15.18 ˘ 0.26 mmol/L) was highest in comparison to 55 ˝C
(4.57 ˘ 0.53 mmol/L) and 37 ˝C (12.76 ˘ 0.50 mmol/L). The same set-up of heat treatment was
tested at 25˝C, however there was no increase in H
2production in comparison to 30˝C (data not
shown). The fermentation temperature optimum for H2production using pretreated wastewater
sludge was highest at 30˝C in comparison to other temperatures as seen in Table1. The highest H 2
production of 15.18 ˘ 0.26 mmol/L-of medium was obtained for the heat pretreatment method at 30˝C.
The lowest H2production of 1.62 ˘ 0.91 mmol/L was observed in the case of chloroform treatment.
H2production increased with a decrease in the incubation temperature across all the pretreatment
methods. The highest production of 15.18 ˘ 0.26 mmol/L in case of heat pretreatment of wastewater sludge at 30˝C was shortlisted for further optimization experiments using CCD.
Table 1. Hydrogen production (mmol/L) for different pretreatment methods across different fermentation temperature conditions.
Pretreatment Methods Hydrogen Production (mmol/L) across Different Temperature Set-up 55˝C 37˝C 30˝C Heat 4.57 ˘ 0.53 12.76 ˘ 0.50 15.18 ˘ 0.26 Acid 1.94 ˘ 0.22 4.40 ˘ 0.51 7.05 ˘ 0.83 Alkali 4.22 ˘ 0.49 4.67 ˘ 0.59 10.02 ˘ 0.22 Microwave 3.98 ˘ 0.46 4.22 ˘ 0.49 6.09 ˘ 0.71 Chloroform 1.62 ˘ 0.91 2.71 ˘ 0.31 9.91 ˘ 0.68
2.2. Hydrogen Production during Optimization Studies
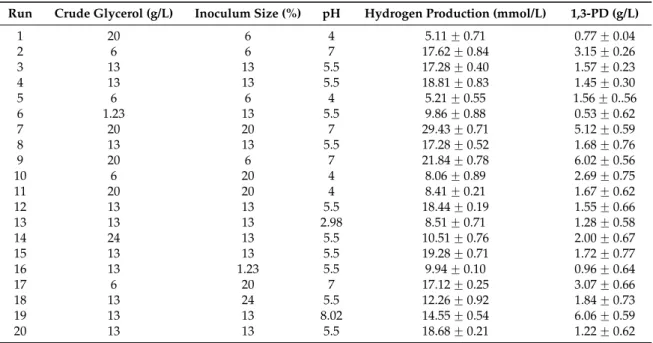
The H2 production across different CG concentrations, inoculum sizes and varying pH is
represented in the Table 2. H2 production ranged from 5.11 ˘ 0.71 (obtained at CG: 20, InS: 6,
pH: 4) to a maximum of 29.43 ˘ 0.71 mmol/L (obtained at CG: 20, InS: 20, pH: 7).
Table 2.The experimental runs of central composite design across crude glycerol concentration (g/L), different inoculum size (%), varying pH and experimental runs in terms of hydrogen production (mmol/L) and 1,3-PD concentration (g/L).
Run Crude Glycerol (g/L) Inoculum Size (%) pH Hydrogen Production (mmol/L) 1,3-PD (g/L)
1 20 6 4 5.11 ˘ 0.71 0.77 ˘ 0.04 2 6 6 7 17.62 ˘ 0.84 3.15 ˘ 0.26 3 13 13 5.5 17.28 ˘ 0.40 1.57 ˘ 0.23 4 13 13 5.5 18.81 ˘ 0.83 1.45 ˘ 0.30 5 6 6 4 5.21 ˘ 0.55 1.56 ˘ 0..56 6 1.23 13 5.5 9.86 ˘ 0.88 0.53 ˘ 0.62 7 20 20 7 29.43 ˘ 0.71 5.12 ˘ 0.59 8 13 13 5.5 17.28 ˘ 0.52 1.68 ˘ 0.76 9 20 6 7 21.84 ˘ 0.78 6.02 ˘ 0.56 10 6 20 4 8.06 ˘ 0.89 2.69 ˘ 0.75 11 20 20 4 8.41 ˘ 0.21 1.67 ˘ 0.62 12 13 13 5.5 18.44 ˘ 0.19 1.55 ˘ 0.66 13 13 13 2.98 8.51 ˘ 0.71 1.28 ˘ 0.58 14 24 13 5.5 10.51 ˘ 0.76 2.00 ˘ 0.67 15 13 13 5.5 19.28 ˘ 0.71 1.72 ˘ 0.77 16 13 1.23 5.5 9.94 ˘ 0.10 0.96 ˘ 0.64 17 6 20 7 17.12 ˘ 0.25 3.07 ˘ 0.66 18 13 24 5.5 12.26 ˘ 0.92 1.84 ˘ 0.73 19 13 13 8.02 14.55 ˘ 0.54 6.06 ˘ 0.59 20 13 13 5.5 18.68 ˘ 0.21 1.22 ˘ 0.62
The response surface quadratic model with p-value of 0.028 was significant, and pH with p-value of 0.0011 had a significant effect on H2production. The model ANOVA results for H2production are
represented in the Table3. The significant p-value of 0.0011 indicated the linear dominance of pH parameter on H2production in comparison to CG and inoculum size.
Table 3.The model ANOVA results for hydrogen production and 1,3-PD concentration.
Source p-Value Hydrogen 1,3-Propanediol Model significant 0.028 <0.0001 A-crude glycerol 0.2701 0.0147 B-inoculum size 0.289 0.2138 C-pH 0.0011 <0.0001 AB 0.4828 0.4875 AC 0.1949 0.0009 BC 0.9376 0.064 A2 0.0824 0.5269 B2 0.1334 0.3378 C2 0.166 <0.0001
The model equation that best represented the fitting data is shown below in (Equation (1)): Hydrogen “ `18.18 ` 1.31 ˆ CG ` 1.26 ˆ InS ` 5.08 ˆ pH ` 1.07 ˆ CG ˆ InS ` 2.04 ˆ
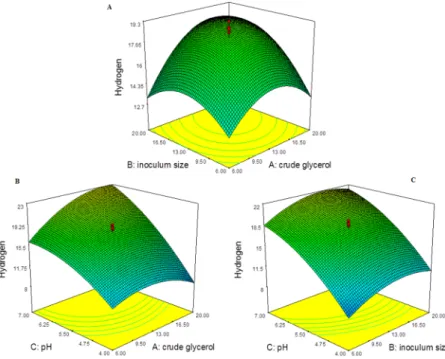
Across Equation (1), pH (5.08) had a positive value and was higher in comparison to other input parameters, indicating the influence of pH to be greater at higher value with dominating effect on H2 production. The H2production response across the input parameters: CG, inoculum size and
pH using response surface curve are represented in the Figure1. At minimum concentration of CG with increasing inoculum size, the H2production increased and decreased as seen in Figure1A.
The H2production at minimum concentration of CG (6 g/L) and InS (6%) for run:2 and 5, varied
from 5.21 ˘ 0.55 to 17.62 ˘ 0.84 mmol/L. In case of increased inoculum size of 20% at minimum concentration of CG (6 g/L), the H2varied from 8.06 ˘ 0.89 to 17.12 ˘ 0.25 mmol/L. At maximum
concentration of CG with increasing inoculum size, the H2production increased. This is seen upon
run:1 (CG: 20, InS: 6) with 5.11 ˘ 0.71 mmol/L increased to 29.43 ˘ 0.71 mmol/L of H2production for
run:7 at (CG: 20, InS: 20). The effect of increase in InS at maximum CG concentration had increasing effect on H2production as seen in the Figure1A. The H2production at minimum concentration of
CG (6 g/L) increased with increase in the pH as seen in the Figure1B. This is seen in run:5 (CG: 6, pH: 4) with 5.21 ˘ 0.55 mmol/L increased to 17.12 ˘ 0.25 mmol/L of H2production for run:17
at (CG: 6, pH: 7). This was even true at maximum concentration of CG for run:11 (CG: 20, pH: 4) with 8.41 ˘ 0.21 mmol/L increased to 29.43 ˘ 0.71 mmol/L for the run:7 (CG: 20, pH: 7). The effect of increase in pH across CG concentrations had a similar effect with increase in H2production till
pH nearing to optimum (pH 7.0) as seen in the Figure1B. The relation of H2 production between
CG and pH was also similar with pH and InS as seen with the response curve in the Figure1C. For run:1 (InS: 6, pH: 4) with 5.11 ˘ 0.71 mmol/L increased to 21.84 ˘ 0.78 mmol/L of H2production
for run:9 at (InS: 6, pH: 7). Similar increase was true at maximum concentration of CG for run:11 (InS: 20, pH: 4) with 8.41 ˘ 0.21 mmol/L increased to 29.43 ˘ 0.71 mmol/L for the run:7 (InS: 20, pH: 7). The effect of increase in pH across inoculum size had similar effect with increase in H2
production till pH nearing to optimum (pH 7.0) as seen in the Figure1C. The optimum fermentation conditions are dependent on substrate concentration, working pH and inoculum size for increased H2
production [2,5]. The fermentation pH had the dominant effect across the other input parameters and at neutral pH resulted in maximum H2production at maximum CG (20 g/L) with 20% inoculum size.
Int. J. Mol. Sci. 2016, 17, 92 5 of 14
Across Equation (1), pH (5.08) had a positive value and was higher in comparison to other input parameters, indicating the influence of pH to be greater at higher value with dominating effect on H2 production. The H2 production response across the input parameters: CG, inoculum
size and pH using response surface curve are represented in the Figure 1. At minimum concentration of CG with increasing inoculum size, the H2 production increased and decreased as
seen in Figure 1A. The H2 production at minimum concentration of CG (6 g/L) and InS (6%) for
run:2 and 5, varied from 5.21 ± 0.55 to 17.62 ± 0.84 mmol/L. In case of increased inoculum size of 20% at minimum concentration of CG (6 g/L), the H2 varied from 8.06 ± 0.89 to 17.12 ± 0.25 mmol/L.
At maximum concentration of CG with increasing inoculum size, the H2 production increased. This
is seen upon run:1 (CG: 20, InS: 6) with 5.11 ± 0.71 mmol/L increased to 29.43 ± 0.71 mmol/L of H2
production for run:7 at (CG: 20, InS: 20). The effect of increase in InS at maximum CG concentration had increasing effect on H2 production as seen in the Figure 1A. The H2 production at minimum
concentration of CG (6 g/L) increased with increase in the pH as seen in the Figure 1B. This is seen in run:5 (CG: 6, pH: 4) with 5.21 ± 0.55 mmol/L increased to 17.12 ± 0.25 mmol/L of H2 production
for run:17 at (CG: 6, pH: 7). This was even true at maximum concentration of CG for run:11 (CG: 20, pH: 4) with 8.41 ± 0.21 mmol/L increased to 29.43 ± 0.71 mmol/L for the run:7 (CG: 20, pH: 7). The effect of increase in pH across CG concentrations had a similar effect with increase in H2 production
till pH nearing to optimum (pH 7.0) as seen in the Figure 1B. The relation of H2 production between
CG and pH was also similar with pH and InS as seen with the response curve in the Figure 1C. For run:1 (InS: 6, pH: 4) with 5.11 ± 0.71 mmol/L increased to 21.84 ± 0.78 mmol/L of H2 production for
run:9 at (InS: 6, pH: 7). Similar increase was true at maximum concentration of CG for run:11 (InS: 20, pH: 4) with 8.41 ± 0.21 mmol/L increased to 29.43 ± 0.71 mmol/L for the run:7 (InS: 20, pH: 7). The effect of increase in pH across inoculum size had similar effect with increase in H2 production
till pH nearing to optimum (pH 7.0) as seen in the Figure 1C. The optimum fermentation conditions are dependent on substrate concentration, working pH and inoculum size for increased H2 production
[2,5]. The fermentation pH had the dominant effect across the other input parameters and at neutral pH resulted in maximum H2 production at maximum CG (20 g/L) with 20% inoculum size.
Figure 1. Hydrogen production (mmol/L) response across the input parameters: (A) across crude glycerol
(g/L) and inoculum size (%); (B) across crude glycerol (g/L) and (C) inoculum size (%) and pH.
2.3. 1,3-Propanediol Production during Optimization Studies
The response of 1,3-PD production across different CG concentrations, inoculum sizes and varying pH is represented in Table 2. 1,3-PD production ranged from minimum of 0.53 ± 0.62
Figure 1. Hydrogen production (mmol/L) response across the input parameters: (A) across crude glycerol (g/L) and inoculum size (%); (B) across crude glycerol (g/L) and (C) inoculum size (%) and pH.
2.3. 1,3-Propanediol Production during Optimization Studies
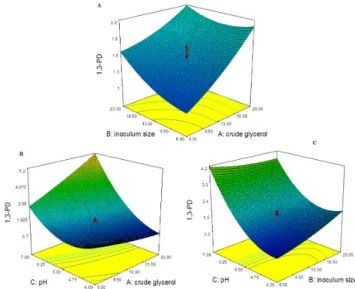
The response of 1,3-PD production across different CG concentrations, inoculum sizes and varying pH is represented in Table2. 1,3-PD production ranged from minimum of 0.53 ˘ 0.62 (run:6, CG: 1.23, InS: 13, pH: 5.5) to a maximum of 6.06 ˘ 0.59 g/L (run:19, CG: 13, InS: 13, pH: 8.02). The response surface quadratic model with p-value of <0.0001 was significant. The p-value of CG (0.0147) and pH (<0.0001) both had a significant effect on 1,3-PD production. The model equation that best represented the fitting data has been shown below in Equation (2):
1,3-Propanedion “ `1.50 ` 0.41 ˆ CG ` 0.18 ˆ InS ` 1.37 ˆ pH ´ 0.13 ˆ CG ˆ InS
`0.84 ˆ CG ˆ pH ´ 0.38 ˆ InS ˆ pH ` 0.08 ˆ CG ˆ CG ` 0.14 ˆ InS ˆ InS ` 0.94 ˆ pH ˆ pH (2) Across Equation (2), akin to H2production, the coefficient of pH (1.37) had a positive value and
was higher in comparison to other input parameters. The significant p-value of <0.0011 indicated the linear dominance of pH along with CG (0.0147) parameter on 1,3-PD production as seen in Table3.
The 1,3-PD production response across the input parameters: CG, inoculum size and pH using response surface curve are represented in Figure2. At maximum concentration of CG with increasing inoculum size, 1,3-PD production was less than maximum response (6.06 g/L) as seen in Figure2A. The 1,3-PD production at maximum concentration of CG (20 g/L) with increasing InS from 6%–20% for run:1 and 11, ranged between 0.77 ˘ 0.04 to 1.67 ˘ 0.62 g/L. The response of 1,3-PD increased with increase in CG concentration at every interval of InS as seen in the Figure2A. The 1,3-PD production at maximum concentration of CG (20 g/L) increased with increase in the fermentation pH as seen in the Figure2B. This is seen in run:1 (CG: 6, pH: 4) with 0.77 ˘ 0.04 g/L increased to 5.12 ˘ 0.59 and 6.02 ˘ 0.56 g/L for run:7 and 9 at (CG: 20, pH: 7). The production of 1,3-PD reached maximum in the pH range (7–8), which was also dependent on the CG concentration. The relation of 1,3-PD production between CG and pH was also similar with pH and InS as seen with the response curve in the Figure2C. In the case of run:10 and 11 (InS: 20, pH: 4) the range was from 1.67 ˘ 0.62 to 2.69 ˘ 0.75 g/L and increased in a range from 3.07 ˘ 0.66 to 5.12 ˘ 0.59 g/L of 1,3-PD production for run:7 and 17 at (InS: 20, pH: 7). The production of 1,3-PD reached maximum in the pH range (7–8), which was also dependent on the InS. The decreased production of 1,3-PD during glycerol fermentation increased the H2production [2,10]. The maximum H2production of 29.43 ˘ 0.71 mmol/L was observed at
5.12 ˘ 0.59 g/L of 1,3-PD production, which was lower in comparison to maximum production of 1,3-PD (6.06 ˘ 0.59 g/L) resulting in decreased H2production with 14.55 ˘ 0.54 mmol/L.
Int. J. Mol. Sci. 2016, 17, 92 6 of 14
(run:6, CG: 1.23, InS: 13, pH: 5.5) to a maximum of 6.06 ± 0.59 g/L (run:19, CG: 13, InS: 13, pH: 8.02). The response surface quadratic model with p-value of <0.0001 was significant. The p-value of CG (0.0147) and pH (<0.0001) both had a significant effect on 1,3-PD production. The model equation that best represented the fitting data has been shown below in Equation (2):
1,3-Propanedion = +1.50 + 0.41 × CG + 0.18 × InS + 1.37 × pH − 0.13 × CG × InS + 0.84 × CG × pH − 0.38 × InS × pH + 0.08 × CG × CG + 0.14 × InS × InS +
0.94 × pH × pH
(2) Across Equation (2), akin to H2 production, the coefficient of pH (1.37) had a positive value and
was higher in comparison to other input parameters. The significant p-value of <0.0011 indicated the linear dominance of pH along with CG (0.0147) parameter on 1,3-PD production as seen in Table 3.
The 1,3-PD production response across the input parameters: CG, inoculum size and pH using response surface curve are represented in Figure 2. At maximum concentration of CG with increasing inoculum size, 1,3-PD production was less than maximum response (6.06 g/L) as seen in Figure 2A. The 1,3-PD production at maximum concentration of CG (20 g/L) with increasing InS from 6%–20% for run:1 and 11, ranged between 0.77 ± 0.04 to 1.67 ± 0.62 g/L. The response of 1,3-PD increased with increase in CG concentration at every interval of InS as seen in the Figure 2A. The 1,3-PD production at maximum concentration of CG (20 g/L) increased with increase in the fermentation pH as seen in the Figure 2B. This is seen in run:1 (CG: 6, pH: 4) with 0.77 ± 0.04 g/L increased to 5.12 ± 0.59 and 6.02 ± 0.56 g/L for run:7 and 9 at (CG: 20, pH: 7). The production of 1,3-PD reached maximum in the pH range (7–8), which was also dependent on the CG concentration. The relation of 1,3-PD production between CG and pH was also similar with pH and InS as seen with the response curve in the Figure 2C. In the case of run:10 and 11 (InS: 20, pH: 4) the range was from 1.67 ± 0.62 to 2.69 ± 0.75 g/L and increased in a range from 3.07 ± 0.66 to 5.12 ± 0.59 g/L of 1,3-PD production for run:7 and 17 at (InS: 20, pH: 7). The production of 1,3-PD reached maximum in the pH range (7–8), which was also dependent on the InS. The decreased production of 1,3-PD during glycerol fermentation increased the H2 production [2,10]. The
maximum H2 production of 29.43 ± 0.71 mmol/L was observed at 5.12 ± 0.59 g/L of 1,3-PD
production, which was lower in comparison to maximum production of 1,3-PD (6.06 ± 0.59 g/L) resulting in decreased H2 production with 14.55 ± 0.54 mmol/L.
Figure 2. 1,3-PD production (g/L) response across the input parameters: (A) crude glycerol (g/L) and inoculum size (%); (B) across crude glycerol (g/L) and (C) inoculum size (%) and pH.
Enrichment methods using acid, chemical, wet heat-, dry heat-shock, freezing and thawing was carried out for cattle manure sludge, and increased H2 production using acid pretreatment was
Figure 2.1,3-PD production (g/L) response across the input parameters: (A) crude glycerol (g/L) and inoculum size (%); (B) across crude glycerol (g/L) and (C) inoculum size (%) and pH.
Enrichment methods using acid, chemical, wet heat-, dry heat-shock, freezing and thawing was carried out for cattle manure sludge, and increased H2production using acid pretreatment was
1.9–9.8 times greater compared to control sludge [25]. A comparative study was made across acid, heat and chloroform treatment on sewage sludge during immobilized H2production in a mixed-culture
under anaerobic conditions. Chloroform treatment inhibited hydrogen consuming bacteria, avoided fast conversion of H2 to acetic acid and repeated culture showed H2 production till 15 days [26].
Heat pretreatment was the best among other pretreatments (acid and base) for enriching H2producing
bacteria from anaerobic sludge [31]. The increased H2production depends on the source of the seed
sludge and the pretreatment method. Heat treatment is a simple, effective and practical method in comparison to other methods for enriching H2-producing bacteria from different seed source [30–33].
The effect of heat pretreatment depends on the seed inoculum to eliminate H2consumers and also
on the kind of substrate used during fermentation [32]. In this study, the heat-pretreated inoculum possessed higher natural acclimatization activity for degrading CG and produced twice as much as H2
in comparison to other pretreatment methods.
The results obtained across pretreatment methods over different fermentation temperatures, helped to narrow down the input parameters for the CCD model. The input parameters using CG concentration ranged from 1.23 to 24 g/L, inoculum size from 1.23% to 24% and pH from 2.98 to 8.02, respectively along with responses of H2and 1,3-PD production represented in the Table2. The central
point from CCD model at CG (13 g/L), InS (13%) and pH (5.5) resulted in the production of H2
reaching only 18.81 ˘ 0.83 mmol/L in comparison to 15.18 ˘ 0.26 at CG (10 g/L). The increase in concentration of CG with increasing inoculum size increased H2production, however the effect of
initial pH was dominant and had a significant effect (p-value: 0.0011) in increasing H2production.
At maximum concentration of CG (20 g/L) for run:1 and 11, with increase in inoculum size from six to 20% resulted in marginal H2production from 5.11 ˘ 0.71 to 8.41 ˘ 0.21 mmol/L. However, at
the same values of CG and InS, when the pH was adjusted from 4 to 7, the H2production increased
with 29.43 ˘ 0.71 mmol/L. Further increase in the initial pH to 8.02 at CG (13 g/L) and InS (13%) resulted in decreased H2production reaching only 14.55 ˘ 0.54 mmol/L. Anaerobic digestion for
H2production depends on growth limitation of methanogens, performance of H2production and
shift from acidogenesis to solventogenesis depends on the pH condition [8]. The optimum pH for H2production is effective, when the methanogenic bacteria get repressed at pH 5.5–6 and also with
heat-shock pretreatment (100˝C) [33]. The conditions of initial pH: 7 in presence of CG (20 g/L) and
InS (20%) was optimum for the growth of H2producers in mixed-culture, which resulted in increased
H2production reaching 29.43 ˘ 0.71 mmol/L.
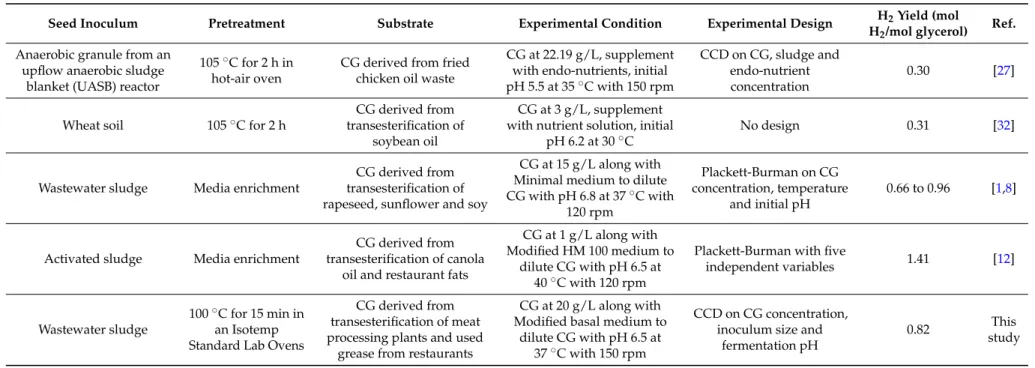
The H2yield comparison along with seed inoculum, experimental condition, and type of design
used across mixed-culture studies is represented in Table 4. The results obtained with hot air oven pretreatment for anaerobic granule sludge using CG (22.19 g/L) in presence of endo-nutrient (2.89 mL/L) resulted in H2production of 1.37 mmol/L h [27]. The conversion of CG into H2with
heat-treated mixed-culture at substrate concentration of 3 g/L in presence of nutrient solutions resulted in 0.31 mol H2/mol glycerol [32]. Enrichment of activated sludge using minimal medium in presence of
CG (15 g/L) resulted in an H2yield ranging from 0.66 to 0.96 mol H2/mol of glycerol [1,8]. The highest
H2yield of 1.41 mol/mol of glycerol was obtained from enrichment of activated sludge using complex
modified HM 100 medium using CG (1 g/L) [12]. The optimal condition in this study resulted in H2 production rate of around 1.23 mmol/L h and with 72% of substrate utilization at H2yield of
0.82 mol/mol of glycerol. The results obtained in this study are slightly higher in presence of minimal medium at 20 g/L, and is comparable to studies (as seen in Table4) using complex medium, nutrient solutions, and working at very low CG concentrations. The heat treatment method used in this study is simple, low cost and industrially applicable in comparison to using costly medium enrichment pretreatment methods. This study provides dual environment benefits with wastewater treatment along with utilization of CG into generation of H2for possible domestic renewable energy source for
Table 4.Hydrogen yield comparison across mixed-culture studies using crude glycerol as substrate.
Seed Inoculum Pretreatment Substrate Experimental Condition Experimental Design H2Yield (mol
H2/mol glycerol) Ref. Anaerobic granule from an
upflow anaerobic sludge blanket (UASB) reactor
105˝C for 2 h in hot-air oven
CG derived from fried chicken oil waste
CG at 22.19 g/L, supplement with endo-nutrients, initial pH 5.5 at 35˝C with 150 rpm
CCD on CG, sludge and endo-nutrient concentration
0.30 [27]
Wheat soil 105˝C for 2 h
CG derived from transesterification of
soybean oil
CG at 3 g/L, supplement with nutrient solution, initial
pH 6.2 at 30˝C
No design 0.31 [32]
Wastewater sludge Media enrichment
CG derived from transesterification of rapeseed, sunflower and soy
CG at 15 g/L along with Minimal medium to dilute CG with pH 6.8 at 37˝C with 120 rpm Plackett-Burman on CG concentration, temperature and initial pH 0.66 to 0.96 [1,8]
Activated sludge Media enrichment
CG derived from transesterification of canola
oil and restaurant fats
CG at 1 g/L along with Modified HM 100 medium to
dilute CG with pH 6.5 at 40˝C with 120 rpm
Plackett-Burman with five
independent variables 1.41 [12]
Wastewater sludge
100˝C for 15 min in an Isotemp Standard Lab Ovens
CG derived from transesterification of meat processing plants and used
grease from restaurants
CG at 20 g/L along with Modified basal medium to
dilute CG with pH 6.5 at 37˝C with 150 rpm
CCD on CG concentration, inoculum size and
fermentation pH
0.82 This
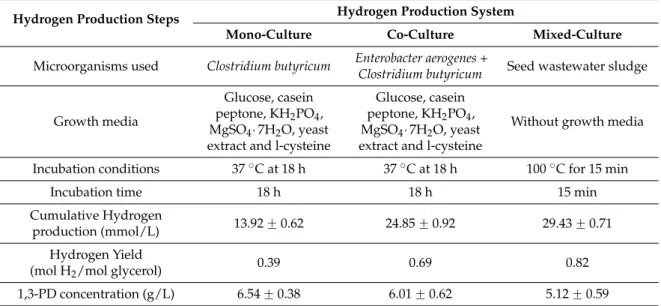
2.4. Hydrogen Production across Pure-, Co- and Mixed-Culture System
To determine CG substrate inhibition effect at higher concentration, H2production across the
mono-/co- and mixed-culture systems was carried out. The co-culture system of two defined microorganisms possesses increased substrate inhibition effect in comparison to single pure culture [4,11]. Two strains Enterobacter aerogenes and Clostridium butyricum, commonly used for H2production using CG [13] were selected along with mixed-culture. The optimum condition for
mixed-culture (CG: 20 g/L, InS: 20%) was carried out using mono- (C. butyricum) and co-culture system comprising (E. aerogenes and C. butyricum) for H2production. The comparison across mono-, co- and
mixed-culture system for the microorganisms used, growth media, incubation condition, incubation time along with cumulative H2production and yield is presented in Table5.
Table 5. Comparison of pure-, co- and mixed-culture hydrogen production processes in terms of inoculum development, hydrogen yield and by-product (1,3-PD) concentration.
Hydrogen Production Steps Hydrogen Production System
Mono-Culture Co-Culture Mixed-Culture
Microorganisms used Clostridium butyricum Enterobacter aerogenes +
Clostridium butyricum Seed wastewater sludge
Growth media
Glucose, casein peptone, KH2PO4, MgSO4¨7H2O, yeast extract and l-cysteine
Glucose, casein peptone, KH2PO4, MgSO4¨7H2O, yeast extract and l-cysteine
Without growth media
Incubation conditions 37˝C at 18 h 37˝C at 18 h 100˝C for 15 min
Incubation time 18 h 18 h 15 min
Cumulative Hydrogen
production (mmol/L) 13.92 ˘ 0.62 24.85 ˘ 0.92 29.43 ˘ 0.71 Hydrogen Yield
(mol H2/mol glycerol) 0.39 0.69 0.82
1,3-PD concentration (g/L) 6.54 ˘ 0.38 6.01 ˘ 0.62 5.12 ˘ 0.59
The media pH conditions for mono- and co-culture was around 6.5, which is optimum for H2
production [2]. The cumulative H2 production (mmol/L) for mono- (13.92 ˘ 0.62) and co-culture
system (24.85 ˘ 0.92) was lower in comparison to mixed-culture system (29.43 ˘ 0.71) and was also true in case of H2yield (as seen in Table5). Cost distribution in case of pure culture with techno-economic
analysis using CG by Saurabh et al., suggested alternative options for reduction of process cost [14]. One such alternative option can be use of mixed-culture system over pure- and co-culture systems to minimize the process cost in terms of growth media and incubation conditions. The complex growth media components in case of pure culture require glucose, casein peptone, KH2PO4, MgSO4¨7H2O,
yeast extract and l-cysteine. However, using a heat pretreatment approach for selecting H2producing
organisms requires no growth media components in comparison to enrichment techniques with complex modified HM 100 medium used [12]. The incubation time for pure-/co-culture system varies from 12–18 h depending upon the microorganism selected and is also similar to time required during enrichment technique. However, in the case of the mixed-culture, the heat pretreatment option can be carried out in only 15 min. The mixed-culture system in comparison to mono- and co-culture system in terms of growth media, incubation condition and time holds an additional advantage along with increased H2 production. In addition to increased H2 production, the mixed-culture
also possesses the ability to work at substrate inhibitor concentration, which determines glycerol degrading syntrophic H2producing microorganisms. The consortium of mixed-culture obtained from
the wastewater sludge was able to produce maximum H2, even at substrate inhibition concentration
mono- and co-culture studies resulted in decreased H2production, indicating substrate inhibition
concentration at 20 g/L [2,5,10]. The wastewater sludge is the largest depositor of different kinds of microorganisms, possessing increased substrate inhibition along with increased glycerol degrading ability. The pure- and co-culture at substrate inhibition concentration (20 g/L) tends to produce 1,3-PD at higher concentration (6.54 ˘ 0.38 and 6.01 ˘ 0.62 g/L) with decreased H2production (as
seen in Table5). The substrate inhibition concentration on pure- and co-culture shifts the metabolic pathway towards reductive pathway for 1,3-PD production instead of H2production through the
oxidative pathway. The higher the concentration of CG in the fermentation media, the higher is the production of 1,3-PD using pure- and co-culture systems (as seen in Table5) [2,10]. The mixed-culture overcomes the substrate inhibition concentration of CG with increased H2yield in comparison to
pure- and co-culture system as seen from the Table5. The microbial community analysis after the heat pretreatment belonged mostly to Clostridium family, and showed dominance over non-hydrogen producing microorganism [32]. However, to understand the population dynamics of mixed-culture system and its ability to work at higher CG concentration in the absence of complex media components are investigations for the future.
3. Materials and Methods 3.1. Crude Glycerol as Substrate
CG was supplied by Rothsay®(Winnipeg, MB, Canada) that uses inedible fat containing waste from meat processing plants and used grease from restaurants for biodiesel production [5]. The CG contained (w/w): up to 23.6% of glycerol, 35.9% carbon and 3.2% nitrogen, 3.06% ash, 5.75% moisture and 67.56% matter organic non-glycerol [2]. This is the first time that CG derived from the processing of animal fat and restaurant waste was used for anaerobic digestion for H2production
using mixed-culture. 3.2. Seed Inoculum
The wastewater sludge was collected from Quebec Urban Community (QUC) wastewater treatment plant (WWTP) (Quebec, QC, Canada). The secondary sludge sample was collected in pre-cleaned high-density polyethylene (HDPE) containers and stored at 4 ˘ 1˝C, until further use.
The characteristics of secondary sludge comprised in (g/L): total solids (TS) (9.15 ˘ 0.13), suspended solids (SS) (7.22 ˘ 0.35), total chemical oxygen demand (TCOD) (6.11 ˘ 1.4), total organic carbon (TOC) (411.82 ˘ 0.66), ammonia-nitrogen (0.21 ˘ 0.01) and pH (6.14 ˘ 0.41) as analyzed by [34].
3.3. Evaluation of Different Pretreatment Methods for Preparation of Seed Inoculum
Different pretreatment techniques for wastewater sludge to enhance and optimize the H2
production efficiency using CG as substrate were investigated. The top five pretreatment techniques, such as heat, acid, alkali, microwave, and chloroform use on wastewater to inhibit the H2consuming
bacteria and screen H2producing mixed-culture were selected.
The pretreatment conditions employed were as follows: (a) Heat pretreatment (heat-shock): 50 mL of wastewater sludge was transferred into a 150 mL serum bottle, sparged with N2 gas for 4 min
to create anaerobic condition, sealed with pre-inserted septa (Headspace 20 mm Crimp Seals with Septa, Thermo Scientific™, Pittsburgh, PA, USA) kept at 100˝C for 15 min in an Isotemp Standard
Lab Ovens (Fisher Scientific™, Pittsburgh, PA, USA) and later cooled prior to inoculation for H2
production [35]; (b) Acid pretreatment: The pH of wastewater sludge (50 mL) was adjusted to 3.0 using 0.1 M HCl, kept at room temperature for 24 h, later pH was re-adjusted to 6.5 (working pH) using 0.1 M NaOH, transferred to serum bottle, sealed and sparged with N2gas, prior to use [35]; (c) Alkali
pretreatment: Similar to preparation steps of acid treatment, pH of wastewater sludge was adjusted to 12 using 0.1 M NaOH at room temperature 24 h and re-adjusted to working pH 6.5 [35]; (d) Microwave pretreatment: The wastewater sludge of around 50 mL (2 ˆ 25 mL) was put in the microwave (MARS
microwave extractor, CEM Corporation, Matthews, NC, USA) at conditions pressure (120 psi) for 2 min at 560–600 W maintained at 90˝C, the treated wastewater was collected, sparged and sealed
prior to use [36]; (e) Chloroform pretreatment: The wastewater sludge (50 mL) was mixed with chloroform (0.05% v/v), transferred to serum bottle, incubated for 24 h, sparged and sealed prior to inoculation [37].
3.4. Hydrogen Production Using Modified Basal Media
A fermentation media containing 1% (w/v) CG, 2% casein peptone, 0.2% KH2PO4, 0.05%
MgSO4¨7H2O and 0.05% yeast extract was maintained at a pH = 6.5 and transferred to serum bottles
with a working volume of 50 mL. The headspace of the bottles was purged with pure N2gas for 4 min
to create anaerobic conditions and later sealed with pre-inserted septa (headspace 20 mm crimp seals with septa, Thermo Scientific™) followed by sterilization in an autoclave (Tuttnauer 3870-Heidolph) [5]. The pretreated sludge with 5% (v/v) inoculum size was transferred into the culture broth using a sterile syringe (All-Plastic Norm-Ject™ Syringes, Thermo Scientific™) along with control experiments without any pretreatment of sludge were performed simultaneously. The serum bottles were incubated in an orbital incubator shaker (INFORS HT-multitron standard) at 150 rpm at different temperatures (30, 37 and 55˝C) for five days. All batch experiments in the study were performed in triplicates, presented
values are the average of triplicates and error bars represent the standard deviation (˘) values. 3.5. Investigating Process Parameters Using Statistical Model
The best pretreatment method resulting in increased H2 production was later selected for
optimization experiments. Central composite design (CCD) was used to investigate the effects of substrate (CG) concentration (g/L), inoculum size (InS) (%) and fermentation pH using Design-Expert 7 software (Stat-Ease Inc., Minneapolis, MN, USA), which resulted in 20 set of experiments. The central composite design matrix comprising of varied CG concentration along with different inoculum size and pH is given in Table2. Across the 20 experiments, the central point of the model with CG (13 g/L), InS (13%) and pH (5.5) appeared 6 times.
Each set of experiment was performed at exact CG concentration along with media supplement (casein polypeptone, KH2PO4, yeast extract and MgSO4¨7H2O) was mixed in distilled water to
make-up the required volume (final volume (50 mL) minus inoculum size). The required volume was pH adjusted, transferred to serum bottle, purged, sealed and sterilized. After inoculation, serum bottles were incubated in an orbital shaker at 150 rpm for 5 days at 30˝C. Each experimental run was carried
out in triplicates. The gas sample (1 mL) for every 24 h was collected from the headspace using a gas tight syringe in vacuumed sample vials for H2analysis by gas chromatography (GC). The aqueous
sample at the end of fermentation was analyzed for glycerol and end 1,3-PD concentration by GC, as described later.
In the response surface methodology (RSM), the H2production (mmol/L) and 1,3-propanediol
(g/L) was chosen as the response variable. The interaction and relation between the input and the responses variables was determined by design matrix evaluation considering the significance p-value, R2values for the models tested and final model equation in terms of factors was obtained from the analysis of variance (ANOVA) [2,38].
3.6. Comparative Study of Hydrogen Production across Pure-, Co- and Mixed-Culture
The optimized conditions of mixed-culture obtained from CCD model were used for a comparative study across pure culture of Enterobacter aerogenes, Clostridium butyricum and co-culture of these two bacteria with mixed-culture for H2production. The anaerobic growth of E. aerogenes and C. butyricum
were carried out in presence of basal media (minimal media) containing glucose (10 g/L), peptone (20 g/L), KH2PO4(2 g/L), yeast extract (0.5 g/L), MgSO4¨7H2O (0.5 g/L) andL-cysteine-HCl¨H2O
(1 g/L) included in case of C. butyricum [2,5,10]. The media preparation, sterilization and incubation were the same as explained in the previous section (H2production using modified basal media).
3.7. Analytical Techniques
3.7.1. Analysis of Hydrogen by GC
The collected gas sample using gas tight syringe in vacuumed sample vials at the end of fermentation was analyzed by gas chromatography (Agilent technology, Santa Clara, CA, USA) fitted with a 3 m PoraPLOT Q®column (Agilent technology, Santa Clara, CA, USA) and equipped with a thermal conductivity detector (TCD). The GC set-up with injector, column temperature and detector temperature set at 100˝C and carrier gas nitrogen was used at a flow rate of 3.5 mL/min [10].
The volume of gas produced was calculated and converted to mmol, considering the temperature and atmospheric pressure during the experimental runs [38].
3.7.2. Analysis of End-Metabolites/by-Products by GC-FID
The concentrations of 1,3-propanediol and glycerol were analysed on ZB-WAX plus column fitted with flame ionization detector (FID) detector in a gas chromatography (GC) (7890B GC-Agilent, Santa Clara, CA, USA) set-up. The GC condition at a flow rate of 1 mL/min using helium carrier gas at a temperature profile of 80–240˝C under 8.4 min method run time was developed [5].
4. Conclusions
The enrichment of H2producing bacteria using five pretreatment methods (by acid, base, heat,
chloroform and microwave respectively) were evaluated for H2production from wastewater sludge
using CG as substrate. The heat treatment resulted in eliminating H2 consuming bacteria with
highest hydrogen production (15.18 ˘ 0.26 mmol/L) at 30 ˝C across the pretreatment methods.
The CCD model was significant with (p-value: 0.028 and <0.0001) to identify the optimal CG concentration (20 g/L), inoculum size (20%) and pH (7) that positively influenced for increased H2production (29.43 ˘ 0.71 mmol/L) with decreased by-product (1,3-PD: 5.12 ˘ 0.59 g/L) production.
High correlation of pH, CG and InS resulted with model significant p-value of 0.028. The pH (p-value: 0.0011) had the highest impact on the H2production in comparison to other parameters (InS and CG
conc.). In the present study, under optimized conditions, the mixed-culture reported maximum H2
production and also provided efficient inoculum conditions in comparison to mono- and co-culture system. The heat pretreatment step used in this mixed-culture system is simple, cheap and industrially applicable in comparison to pure-/co-culture system for H2production.
Acknowledgments: Financial support from NSERC (No. 284111, Discovery; No. 476649-14, Collaborative Research and Development Grant) and INRS-ETE has been acknowledged.
Author Contributions: Vinayak Laxman Pachapur planned the experiments, carried out data analysis and prepared the manuscript; Prianka Kutty performed the experiments and analysed the samples; Satinder Kaur Brar and Antonio Avalos Ramirez corrected the manuscript and supervised the research work.
Conflicts of Interest:The authors declare no conflict of interest. References
1. Varrone, C.; Rosa, S.; Fiocchetti, F.; Giussani, B.; Izzo, G.; Massini, G.; Marone, A.; Signorini, A.; Wang, A. Enrichment of activated sludge for enhanced hydrogen production from crude glycerol. Int. J. Hydrog. Energy
2013, 38, 1319–1331. [CrossRef]
2. Pachapur, V.L.; Sarma, S.J.; Brar, S.K.; Le Bihan, Y.; Buelna, G.; Verma, M. Biohydrogen production by co-fermentation of crude glycerol and apple pomace hydrolysate using co-culture of Enterobacter aerogenes and Clostridium butyricum. Bioresour. Technol. 2015, 193, 297–306. [CrossRef] [PubMed]
3. Ayoub, M.; Abdullah, A.Z. Critical review on the current scenario and significance of crude glycerol resulting from biodiesel industry towards more sustainable renewable energy industry. Renew. Sustain. Energy Rev.
2012, 16, 2671–2686. [CrossRef]
4. Pachapur, V.L.; Sarma, S.J.; Brar, S.K.; Le Bihan, Y.; Buelna, G.; Verma, M. Biological hydrogen production using co-culture versus mono-culture system. Environ. Technol. Rev. 2015, 4, 55–70. [CrossRef]
5. Pachapur, V.; Sarma, S.; Brar, S.; Bihan, Y.; Buelna, G.; Verma, M. Hydrogen production from biodiesel industry waste by using a co-culture of Enterobacter aerogenes and Clostridium butyricum. Biofuels 2015. [CrossRef]
6. Jitrwung, R.; Yargeau, V. Biohydrogen and bioethanol production from biodiesel-based glycerol by Enterobacter aerogenes in a continuous stir tank reactor. Int. J. Mol. Sci. 2015, 16, 10650–10664. [CrossRef] [PubMed]
7. Amaral, P.F.F.; Ferreira, T.F.; Fontes, G.C.; Coelho, M.A.Z. Glycerol valorization: New biotechnological routes. Food Bioprod. Process. 2009, 87, 179–186. [CrossRef]
8. Varrone, C.; Giussani, B.; Izzo, G.; Massini, G.; Marone, A.; Signorini, A.; Wang, A. Statistical optimization of biohydrogen and ethanol production from crude glycerol by microbial mixed culture. Int. J. Hydrog. Energy
2012, 37, 16479–16488. [CrossRef]
9. Varrone, C.; Heggeset, T.; Le, S.; Haugen, T.; Markussen, S.; Skiadas, I.; Gavala, H. Comparison of different strategies for selection/adaptation of mixed microbial cultures able to ferment crude glycerol derived from second-generation biodiesel. Biomed Res. Int. 2015. [CrossRef] [PubMed]
10. Pachapur, V.L.; Sarma, S.J.; Brar, S.K.; Le Bihan, Y.; Buelna, G.; Soccol, C.R. Evidence of metabolic shift on hydrogen, ethanol and 1,3-propanediol production from crude glycerol by nitrogen sparging under micro-aerobic conditions using co-culture of Enterobacter aerogenes and Clostridium butyricum. Int. J. Hydrog. Energy 2015, 40, 8669–8676. [CrossRef]
11. Laxman Pachapur, V.; Jyoti Sarma, S.; Kaur Brar, S.; Le Bihan, Y.; Ricardo Soccol, C.; Buelna, G.; Verma, M. Co-culture strategies for increased biohydrogen production. Int. J. Energy Res. 2015, 39, 1479–1504. [CrossRef] 12. Mangayil, R.; Aho, T.; Karp, M.; Santala, V. Improved bioconversion of crude glycerol to hydrogen by
statistical optimization of media components. Renew. Energy 2015, 75, 583–589. [CrossRef]
13. Sarma, S.J.; Brar, S.K.; Sydney, E.B.; Le Bihan, Y.; Buelna, G.; Soccol, C.R. Microbial hydrogen production by bioconversion of crude glycerol: A review. Int. J. Hydrog. Energy 2012, 37, 6473–6490. [CrossRef]
14. Sarma, S.J.; Brar, S.K.; Le Bihan, Y.; Buelna, G. Bio-hydrogen production by biodiesel-derived crude glycerol bioconversion: A techno-economic evaluation. Bioprocess. Biosyst. Eng. 2013, 36, 1–10. [CrossRef] [PubMed] 15. Sydney, E.B.; Larroche, C.; Novak, A.C.; Nouaille, R.; Sarma, S.J.; Brar, S.K.; Letti, L.A.J.; Soccol, V.T.;
Soccol, C.R. Economic process to produce biohydrogen and volatile fatty acids by a mixed culture using vinasse from sugarcane ethanol industry as nutrient source. Bioresour. Technol. 2014, 159, 380–386. [CrossRef] [PubMed]
16. Romão, B.; Batista, F.; Ferreira, J.; Costa, H.; Resende, M.; Cardoso, V. Biohydrogen production through dark fermentation by a microbial consortium using whey permeate as substrate. Appl. Biochem. Biotechnol.
2014, 172, 3670–3685. [CrossRef] [PubMed]
17. Phowan, P.; Danvirutai, P. Hydrogen production from cassava pulp hydrolysate by mixed seed cultures: Effects of initial pH, substrate and biomass concentrations. Biomass Bioenergy 2014, 64, 1–10. [CrossRef] 18. Jürgensen, L.; Ehimen, E.A.; Born, J.; Holm-Nielsen, J.B. Hydrogen production using an anaerobic baffled
reactor–mass balances for pathway analysis and gas composition profiles. Int. J. Hydrog. Energy 2015, 40, 12154–12161. [CrossRef]
19. Ali Shah, F.; Mahmood, Q.; Maroof Shah, M.; Pervez, A.; Ahmad Asad, S. Microbial ecology of anaerobic digesters: The key players of anaerobiosis. Sci. World J. 2014, 21. [CrossRef] [PubMed]
20. Yang, Z.; Xu, X.; Guo, R.; Fan, X.; Zhao, X. Accelerated methanogenesis from effluents of hydrogen-producing stage in anaerobic digestion by mixed cultures enriched with acetate and nano-sized magnetite particles. Bioresour. Technol. 2015, 190, 132–139. [CrossRef] [PubMed]
21. Chandrasekhar, K.; Lee, Y.-J.; Lee, D.-W. Biohydrogen production: Strategies to improve process efficiency through microbial routes. Int. J. Mol. Sci. 2015, 16, 8266–8293. [CrossRef] [PubMed]
22. Yin, Y.; Hu, J.; Wang, J. Gamma irradiation as a pretreatment method for enriching hydrogen-producing bacteria from digested sludge. Int. J. Hydrog. Energy 2014, 39, 13543–13549. [CrossRef]
23. Pradhan, N.; Dipasquale, L.; d'Ippolito, G.; Panico, A.; Lens, P.N.; Esposito, G.; Fontana, A. Hydrogen production by the thermophilic bacterium Thermotoga neapolitana. Int. J. Mol. Sci. 2015, 16, 12578–12600. [CrossRef] [PubMed]
24. Chandra, R.; Nikhil, G.; Mohan, S.V. Single-stage operation of hybrid dark-photo fermentation to enhance biohydrogen production through regulation of system redox condition: Evaluation with real-field wastewater. Int. J. Mol. Sci. 2015, 16, 9540–9556. [CrossRef] [PubMed]
25. Cheong, D.-Y.; Hansen, C.L. Bacterial stress enrichment enhances anaerobic hydrogen production in cattle manure sludge. Appl. Microbiol. Biotechnol. 2006, 72, 635–643. [CrossRef] [PubMed]
26. Hu, B.; Chen, S. Pretreatment of methanogenic granules for immobilized hydrogen fermentation. Int. J. Hydrog. Energy 2007, 32, 3266–3273. [CrossRef]
27. Sittijunda, S.; Reungsang, A. Biohydrogen production from waste glycerol and sludge by anaerobic mixed cultures. Int. J. Hydrog. Energy 2012, 37, 13789–13796. [CrossRef]
28. Sarma, S.J.; Brar, S.K.; Le Bihan, Y.; Buelna, G.; Soccol, C.R. Hydrogen production from meat processing and restaurant waste derived crude glycerol by anaerobic fermentation and utilization of the spent broth. J. Chem. Technol. Biotechnol. 2013, 88, 2264–2271. [CrossRef]
29. Wilkens, E.; Ringel, A.K.; Hortig, D.; Willke, T.; Vorlop, K.-D. High-level production of 1,3-propanediol from crude glycerol by Clostridium butyricum akr102a. Appl. Microbiol. Biotechnol. 2012, 93, 1057–1063. [CrossRef] [PubMed]
30. Wang, J.; Wan, W. Comparison of different pretreatment methods for enriching hydrogen-producing bacteria from digested sludge. Int. J. Hydrog. Energy 2008, 33, 2934–2941. [CrossRef]
31. Mu, Y.; Yu, H.-Q.; Wang, G. Evaluation of three methods for enriching h 2-producing cultures from anaerobic sludge. Enzym. Microb. Technol. 2007, 40, 947–953. [CrossRef]
32. Selembo, P.A.; Perez, J.M.; Lloyd, W.A.; Logan, B.E. Enhanced hydrogen and 1,3-propanediol production from glycerol by fermentation using mixed cultures. Biotechnol. Bioeng. 2009, 104, 1098–1106. [CrossRef] [PubMed]
33. Rossi, D.M.; Da Costa, J.B.; de Souza, E.A.; Peralba, M.D.C.R.; Samios, D.; Ayub, M.A.Z. Comparison of different pretreatment methods for hydrogen production using environmental microbial consortia on residual glycerol from biodiesel. Int. J. Hydrog. Energy 2011, 36, 4814–4819. [CrossRef]
34. Puicharla, R.; Mohapatra, D.; Brar, S.; Drogui, P.; Auger, S.; Surampalli, R. A persistent antibiotic partitioning and co-relation with metals in wastewater treatment plant—chlortetracycline. J. Environ. Chem. Eng. 2014, 2, 1596–1603. [CrossRef]
35. Chen, C.C.; Lin, C.Y.; Lin, M.C. Acid–base enrichment enhances anaerobic hydrogen production process. Appl. Microbiol. Biotechnol. 2002, 58, 224–228. [PubMed]
36. Guo, L.; Li, X.M.; Bo, X.; Yang, Q.; Zeng, G.M.; Liao, D.X.; Liu, J.J. Impacts of sterilization, microwave and ultrasonication pretreatment on hydrogen producing using waste sludge. Bioresour. Technol. 2008, 99, 3651–3658. [CrossRef] [PubMed]
37. Hu, B.; Chen, S. Biological hydrogen production using chloroform-treated methanogenic granules. Appl. Biochem. Biotechnol. 2008, 148, 83–95. [CrossRef] [PubMed]
38. Sarma, S.J.; Dhillon, G.S.; Brar, S.K.; Le Bihan, Y.; Buelna, G.; Verma, M. Investigation of the effect of different crude glycerol components on hydrogen production by Enterobacter aerogenes nrrl b-407. Renew. Energy
2013, 60, 566–571. [CrossRef]
© 2016 by the authors; licensee MDPI, Basel, Switzerland. This article is an open access article distributed under the terms and conditions of the Creative Commons by Attribution (CC-BY) license (http://creativecommons.org/licenses/by/4.0/).