rrn rarrvERSSTf BE
m SHERBROOKE
Faculte de genie Departement de genie civil
EVALUATION OF ALKALI-SILICA REACTION EVOLUTION IN CONCRETE USING ULTRASONIC TESTS
EVALUATION DE L'EVOLUTION DE LA REACTION ALCALI-SILICE DANS LE BETON PAR LES METHODES ULTRASONIQUES
These de doctorat en science appliquees Specialite: genie civil
Jury :
Gerard Ballivy : Rapporteur Richard Gagne: Examinateur Kaveh Saleh : Examinateur Patrice Rivard : Directeur Jamal Rhazi: Codirecteur
Maryafti SARGOLZAHI
1*1
Library and Archives
Canada
Published Heritage
Branch
395 Wellington Street
Ottawa ON K1A 0N4
Canada
Bibliotheque et
Archives Canada
Direction du
Patrimoine de I'edition
395, rue Wellington
Ottawa ON K1A 0N4
Canada
Your file Votre reference ISBN: 978-0-494-64196-5 Our file Notre reference ISBN: 978-0-494-64196-5
NOTICE:
AVIS:
The author has granted a
non-exclusive license allowing Library and
Archives Canada to reproduce,
publish, archive, preserve, conserve,
communicate to the public by
telecommunication or on the Internet,
loan, distribute and sell theses
worldwide, for commercial or
non-commercial purposes, in microform,
paper, electronic and/or any other
formats.
L'auteur a accorde une licence non exclusive
permettant a la Bibliotheque et Archives
Canada de reproduce, publier, archiver,
sauvegarder, conserver, transmettre au public
par telecommunication ou par I'lnternet, preter,
distribuer et vendre des theses partout dans le
monde, a des fins commerciales ou autres, sur
support microforme, papier, electronique et/ou
autres formats.
The author retains copyright
ownership and moral rights in this
thesis. Neither the thesis nor
substantial extracts from it may be
printed or otherwise reproduced
without the author's permission.
L'auteur conserve la propriete du droit d'auteur
et des droits moraux qui protege cette these. Ni
la these ni des extraits substantiels de celle-ci
ne doivent etre imprimes ou autrement
reproduits sans son autorisation.
In compliance with the Canadian
Privacy Act some supporting forms
may have been removed from this
thesis.
Conformement a la loi canadienne sur la
protection de la vie privee, quelques
formulaires secondaires ont ete enleves de
cette these.
While these forms may be included
in the document page count, their
removal does not represent any loss
of content from the thesis.
Bien que ces formulaires aient inclus dans
la pagination, il n'y aura aucun contenu
manquant.
• • I
Canada
ABSTRACT
Concrete structures may be at risk to deteriorate by alkali-silica reaction (ASR), when they are maintained under the conditions supporting the reaction. This reaction causes the expansion of concrete and generates microcracking in the interior part and macrocracking on the surface of concrete. This transformation can lead to serious durability problems in concrete structures, which decrease their technical and economical management. The aim of this study is to monitor the damage due to ASR progression using mechanical and non-destructive tests on specimens of various scales: mortars, laboratory concrete and cores collected from a large hydraulic structure.
Two Canadian crushed aggregates were used: Spratt limestone as a reactive aggregate and Limeridge limestone as a non-reactive aggregate. Two mortars and two concretes were made from these aggregates. Mortars were made according to Canadian standard CSA A23.2-25A and stored at 38 °C in 1 molar NaOH solution and concretes were made and stored at 38 °C in humid air (R.H>90%) according to Canadian standard CSA
A23.2-14A. Also two types of concrete cores containing reactive aggregates (siliceous clayey limestone and Potsdam sandstone) from two concrete locks affected by ASR were kept at 38°C in 1 molar NaOH solution. Expansion and mass variation of all specimens were measured regularly during the reaction evolution.
In a first step, the properties of aggregates were characterized and their reactive silica content was measured. Non-destructive test methods were based on measurement of ultrasonic pulse velocity and resonant frequencies (longitudinal and transversal) of mortar, concrete and concrete cores. Also some other investigations were performed on the specimens: compressive and tensile strength, modulus of elasticity, non linear acoustic test, petrographic analysis by SEM and Damage Rating Index measurement.
The main observations and recommendations are:
• Measurement of elastic modulus of elasticity is the best mechanical test to assessing ASR damage in concrete.
• The relation was observed between the expansion of mortars and the variation in its petrography features.
• There was a good relationship between expansion and the degree of damage, associated by ASR in concrete and concrete cores assessed by Damage Rating Index method.
• Measurement of non linear parameters and resonant frequencies are the best non-destructive techniques for assessing ASR progression. A direct correlation was shown between the expansion of concrete cores and the reduction of dynamic modulus and increasing the nonlinear parameters.
RESUME
Les structures en beton peuvent etre endommagees par la reaction alcali-silice (RAS), quand elles sont maintenues dans les conditions soutenant la reaction. Cette reaction provoque l'expansion du beton et genere les micro fissures dans la partie interieure et macrofissures sur la surface du beton. Cette transformation peut diminuer la durability des structures en beton, ce qui diminue ses competences techniques et augmente des frais de gestion des ouvrage. L'objectif de cette etude est revaluation des dommages provoques par revolution de la RAS en utilisant des essais mecaniques et non-destructifs sur des echantillons de differentes compositions : mortiers, beton de laboratoire et carottes de forage.
Deux granulats canadiens ont ete utilises: Le calcaire Spratt comme un granulat reactif et le calcaire Limeridge comme un granulat non-reactif. Deux melanges de mortier et de beton ont ete prepares avec ces granulats. Les mortiers ont ete prepares selon la norme canadienne CSA A23.2-25A et entreposes a 38° C dans la solution NaOH 1 molar et les betons ont ete fabriques et entreposes a 38° C en air humide (H.R.> 90%) selon la norme canadienne CSA A23.2 - 14A. Des carottes de forage contenant les granulats reactifs (Calcaire siliceux et gres de Potsdam) provenant de deux ecluses atteint de RAS ont egalement ete conservees a 38° C dans la solution NaOH 1 molar. L'expansion et la variation de masse de toutes les eprouvettes ont ete mesurees a intervalle regulier.
Plusieurs etudes ont ete considerees: Dans la premiere etape, les granulats ont ete caracterises et leur teneur en silice reactive a ete mesuree. Les essais non destructifs (la mesure de la vitesse ultrasonores et la frequence des resonances et essais non lineaires), essais mecaniques, examen petrographique quantitatif et examen petrographique par MEB ont ete effectues sur ces eprouvettes. Les principales conclusions sont les suivantes:
• Une relation a ete observee entre l'expansion des barres des mortiers et de la variation des microstructures observees par MEB.
• II y a eu une bonne correlation entre l'expansion et le dommage cause par la RAS, pour le beton de laboratoire et les carottes de beton evalues par la methode DRI. • L'etude de la frequence de resonance et acoustique non lineaire sont les
meilleures techniques non-destructives pour 1'evaluation de la progression de la RAS. Une correlation directe a ete etablie entre l'expansion des carottes de beton et la reduction de module dynamique et augmentation des proprietes non lineaires.
Mots-cles : reaction alcalis-silice, essais non destructifs, expansion residuelle, acoustique non lineaire, petrographie, caracterisation, beton, mortier
ACKNOWLEDGEMENT
I am very grateful and I would like to express my thanks to:
Professor Gerard Ballivy for accepting me to his group {Group de recherche en
auscultation et instrumentation, GRAI).
Professor Patrice Rivard, my thesis advisor, for providing the opportunity for me to explore the scope of this research, for his constant patience, financial support and for his excellent supervision during my PhD study.
Professor Jamal Rhazi my thesis co-advisor, for his advice, useful criticism and helpful conversations in the development of the project.
With great thanks, I want to acknowledge the financial support of Fonds Quebecoise de
recherche sur la nature et les technologies (FQRNT)
And last but absolutely not least, I thank to my husband, Reza and my son, Mobin. Their love for me is really what made this Ph.D happen. This thesis is thus dedicated to them.
GLOSSARY
ACR: Alkali-carbonate reaction ASR: Alkali-silica reaction AAR: Alkali-aggregate reaction
BLG: Concrete containing Limeridge limestone BSP: Concrete containing Spratt limestone
BB: Concrete core extracted from Beauharnois lock
BCSC: Concrete core extracted from C6te-St-Catherine lock DRI: Damage Rating Index
EL : Dynamic modulus of elasticity calculated from longitudinal resonant frequency Ex: Dynamic modulus of elasticity calculated from transversal resonant frequency MLG: Mortar containing Limeridge limestone
MSP: Mortar containing Spratt limestone SEM: Scanning electron microscopy UPV: Ultrasonic pulse velocity XRD: X-Ray diffraction
TABLE OF CONTENT
1. Introduction 1
1.1 Context 1 1.2 Objectives 5 1.3 Thesis structure 6
2. Literature review on alkali-silica reaction ... 7
2.1 Different type of alkali-silica reaction 7 2.2 Principal methods of reaction mechanism 9
2.2.1 Topochemical process 9 2.2.2 Dissolution-precipitation process 14
2.2.3 Model of quantification the reaction degree (Bulteel and al, 2000).... 15
2.3 Signals of ASR 17 2.3.1 Cracking.. 17 2.3.2 Reaction rim 19 2.4 The concept of the pessimum proportion 20
2.5 Composition and other characteristics of alkali-silica gel 22 2.6 The principal factors influencing on alkali-silica reaction. 24
2.6.1 Reactive silica 24 2.6.2 High-alkali pore solution .26
2.6.3 Sufficient moisture 30 2.6.4 Environmental conditions 32
2.6.5 Temperature 32 2.6.6 Concrete permeability and water-cement ratio 33
2.6.7 Air entrainment 34 2.6.8 Size of aggregate 35 2.7 Laboratory test methods for assessing 37
2.8 Destructive and non-destructive test method for evaluating the damage
of concrete affected by ASR 40 2.8.1 Destructive test methods 40
2.8.3 Effect of concrete characteristics and environmental condition on
the results of non-destructive tests 49 2.9 Effects of ASR on engineering properties of concrete 50
2.9.1 Compressive strength. 50 2.9.2 Tensile strength 51 2.9.3 Flexural strength and modulus of elasticity 51
3. Objective and experimental program 53
3.1 Objective 53 3.2 Experimental program 54
3.2.1 Characterization of aggregates 57
3.2.2 Tests on mortar 58 3.2.3 Tests on concrete 63 3.2.4 Tests on concrete core 69
4. Materials and their characteristics 71
4.1 Cement : 71
4.2 Aggregates ..'. 71 4.2.1 Spratt limestone (reactive limestone) 72 4.2.2 Limeridge limestone (non-reactive limestone) 72
4.2.3 Fine aggregate. 73 4.3 Mixture characteristic, fabrication and storage of the test specimens ...73
4.3.1 Mortar .'. ...73
4.3.2 Concrete 74 4.3.3 Concrete core 75
5. Characterization of aggregates 81 5.1 Chemical composition of aggregates 81
5.2 X-Ray diffraction 81 5.3 Microstructural analysis by scanning electron microscopy (SEM) 82
6. Tests on mortars ...87
6.1 Expansion measurement and mass variation 87
6.1.1 Expansion measurement 87
6.1.2 Masse variations 89 6.2 Compressive strength of mortars 91
6.3 Non-destructive tests. 94 6.3.1 Pulse velocity 95 6.3.2 Dynamic modulus of elasticity. 98
6.3.4 Conclusion on the results of non-destructive tests on mortars 100
6.4 Microscopic properties of mortars 100
6.4.1 MLG observation 101 6.4.2 MSP observation 104 6.4.3 Conclusion on the results of SEM 109
6.5 Chemical test 110
7. Tests on concretes 113
7.1 Expansion measurement and mass variations 113
7.1.1 Expansion measurement 113 7.1.2 Mass variations measurement 115 7.1.3 Relation between Expansion and mass variation of concretes 117
7.2 Mechanical tests 118 7.2.1 Compressive strength 118
7.2.2 Tensile strength 120 7.2.3 Static modulus of elasticity 122
7.2.4 Conclusion on the results of mechanical tests 124
7.3 Non-destructive tests 124 7.3.1 Ultrasonic pulse velocity 125
7.3.2 Dynamic modulus of elasticity calculated from resonant
frequencies 127 7.3.3 Nonlinear acoustic tests 120
7.3.5 Comparing the results of non destructive tests on mortar and concrete..132
7.4 Petrographic examination by Damage Rating Index method 133
8 Tests on concrete cores 137
8.1 The initial characterization of concrete cores 137 8.1.1 The initial characterization of BB 138 8.1.2 The initial characterization of BCSC 142 8.2 Expansion measurement and mass variations 147
8.2.1 Expansion measurement 147 8.2.2 Mass variations measurement 150 8.2.3 Relation between Expansion and mass variations of concrete cores 151
8.3 Petrographic examination by Damage Rating Index method 153
8.4 Non-destructive tests 157 8.4.1 Ultrasonic pulse velocity 158
8.4.2 Dynamic modulus calculated form resonant frequencies 160
8.4.3 Nonlinear frequency shift 162 8.4.4 Discussion on the results of non-destructive tests on concrete cores....165
9 Discussion 167
9.1 Comparison between the results of mortars, laboratory concretes and
concrete cores 167 9.1.1 Expansion measurement and mass variation 167
9.1.2 Non-destructive test methods 168 9.2 Reliable methods for assessing ASR in concrete cores 173
9.3 Assessment of ASR in field structure 173
10 Conclusions and recommendation 177
LIST OF FIGURES
Chapter 1
Figure 1.1: Map of Canada showing locations of structures affected by ASR
alkali aggregate reaction or sources of known reactive aggregate 2
Figure 1.2: ASR deterioration of granite coarse aggregate 3 Figure 1.3: Map-pattern cracking and extrusion of joint filling material due to
expansion of concrete affected by alkali-carbonate reactivity in a
sidewalk in Kingston, Ontario 4
Chapter 2
Figure 2.1: Cracking in different type of aggregates (Idorn, 1997) 8 Figure 2.2: Reaction described by Dent-Glasser and Kataoka (1981a) 10 Figure 2.3: Solubility of CaO in alkaline solution (Wang and Gillot, 1991) 13
Figure 2.4: A schematic presentation of model of Bulteel 15 Figure 2.5: Reaction rim surrounding Potsdam particles (Rivard, 1998) 19
Figure 2.6: Graphical model of pessimum, Water/Cement = 0.4, Aggregate/Cement
= 2.75andNa2Oe ? = 6kg/m3(Hobbs, 1988) 21
Figure 2.7: Detail of the-chert particle in the previous image and adjacent cement paste, showing alkali-silica gel extruded into cracks within
the concrete .22 Figure 2.8: Representation of a siloxane bond between two silica tetrahedron
defining angle a and length of silica-oxygen liaison
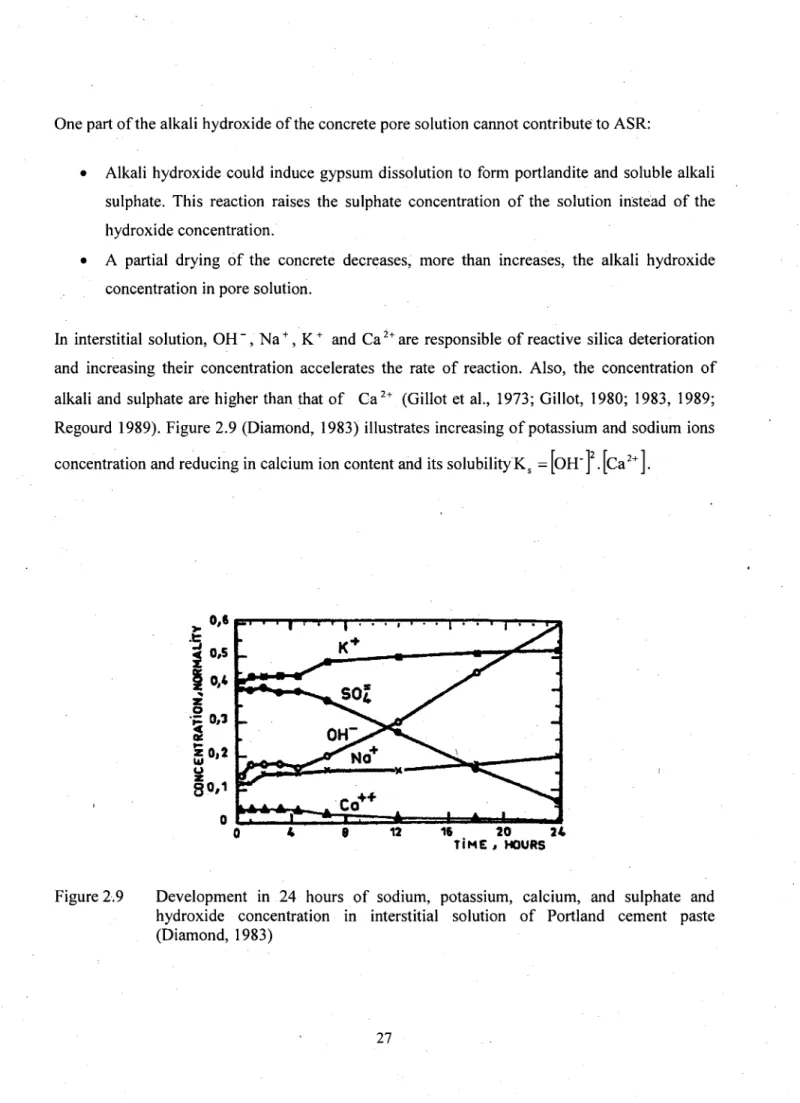
(Bulteel, 2000) 25 Figure 2.9: Development in 24 hours of sodium, potassium, calcium, and sulphate
Figure 2.10: Effect of Alkali Content on expansion using ASTM C 1293
(Thomas, 2002) 29 Figure 2.11: Effect of relative humidity on expansion using ASTM C 1293
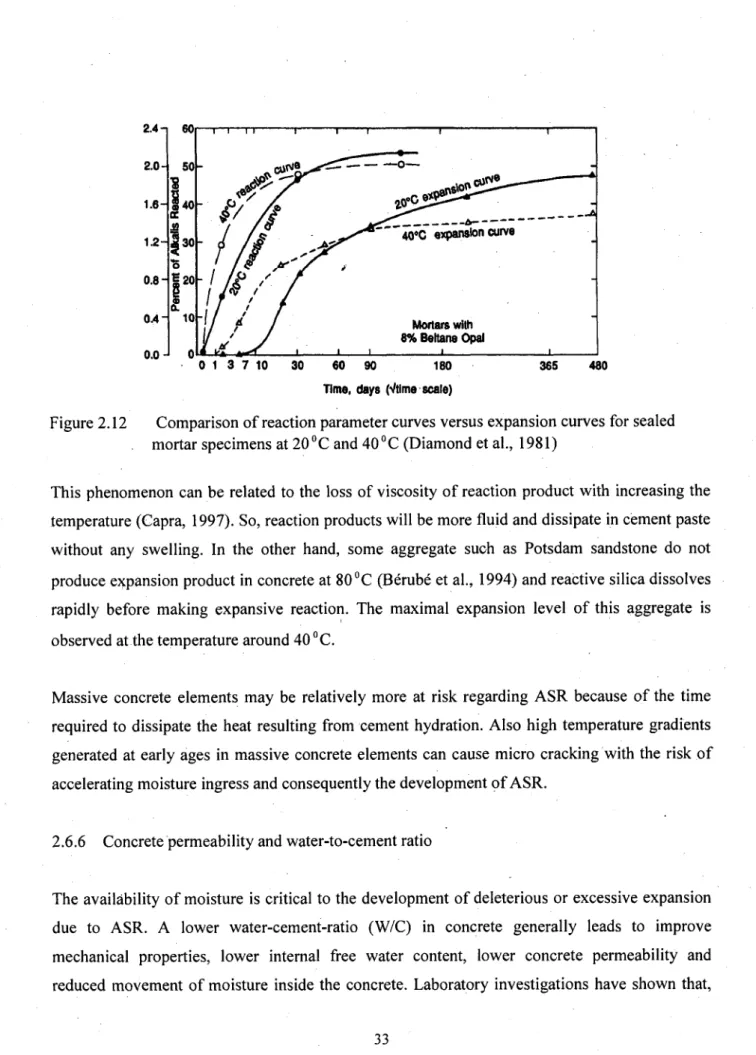
(Pedneault, 1996) 31 Figure 2.12: Comparison of reaction parameter curves versus expansion curves
for sealed mortar specimens at 20°C and 40°C (Diamond, 33 Figure 2.13: Influence of air content in hardened concrete on the relationship
of expansion and age: W/C = 0.41 and Na2 O = 5 kg/m 3
(Hobbs, 1988) 35 Figure 2.14: Expansion versus aggregate size 36
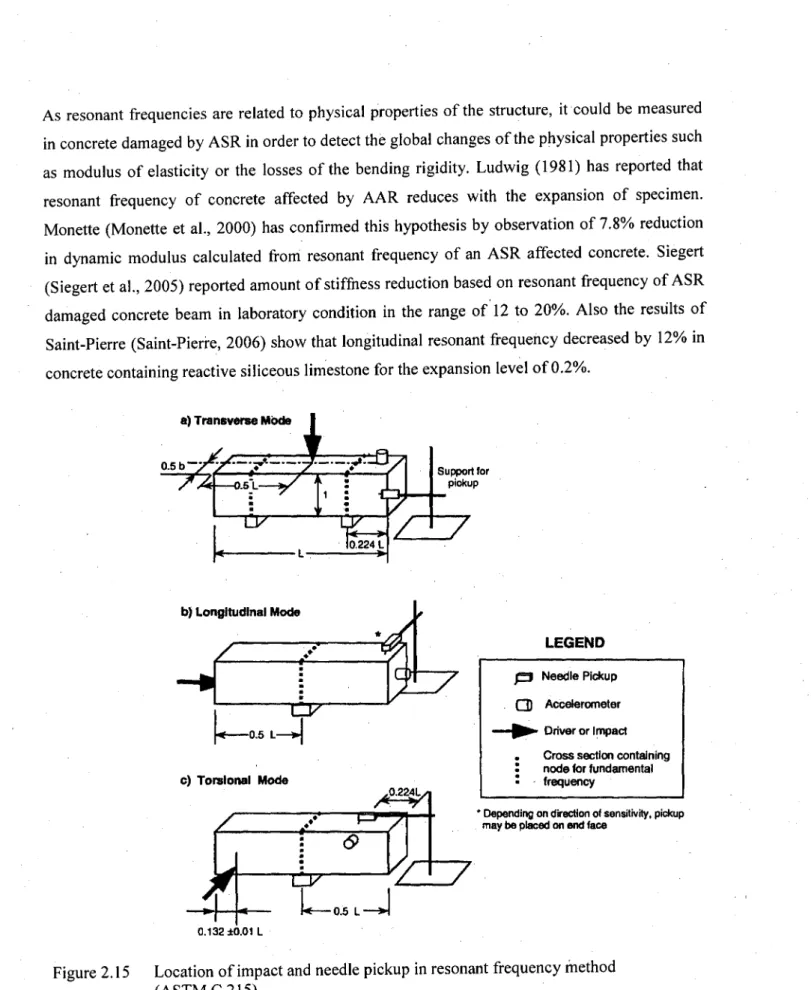
Figure 2.15: Location of impact and needle pickup in resonant frequency
method (ASTM C 215)... 47 Figure 2.16: Stress-strain curve for concrete with variable ASR expansion 52
Chapter 3
Figure 3.1: Experimental program 55 Figure 3.2: A view of ultrasonic pulse velocity measurement ..63
Figure 3.3: A view of resonant frequency measurement ..62
Figure 3.4: Expansion of concrete prism 64 Figure 3.5: Views of measuring the compressive strength of concrete ....64
Figure 3.6: A view of measuring the tensile strength of concrete 65 Figure 3.7: A view of measuring the modulus of elasticity 66 Figure 3.8: Measurement of resonant frequency shift 68
Chapter 4
Figure 4.1: A view of mortar bars stored in solution 74 Figure 4.2: A view of concrete prisms stored at 38 °C and in humid air
(>90%H.R.) 75 Figure 4.3: A view of the St Lawrence Seaway 76
Figure 4.4:
Figure 4.5: Figure 4.6: Figure 4.7: Figure 4.8:
Typical symptoms of ASR observed on a polished core taken from St-Lambert lock: cracks in limestone aggregates and cement paste filled
with reaction product, reaction rim around particles 77
A view of Beauharnois lock 78 Localization of concrete cores extracted from Beauharnois lock 78
A view of Cote Ste-Catherine lock 79 Localization of concrete cores extracted from Cote Ste-Catherine lock...79
Chapter 5
Figure 5.1: Crystalline phases of Limeridge limestone with SiC>2 phase 83 Figure 5.2: Crystalline phases of Spratt limestone with Si02 phase 83 Figure 5.3: SEM micrograph of Limeridge limestone (A: surface and B:
fractured surface of Limeridge limestone) 84 Figure 5.4: SEM micrograph of Spratt limestone (A: surface and B: fractured
surface of Limeridge limestone) 84 Figure 5.5: Elemental map of Limeridge limestone by microanalysis probe in
the SEM 85 Figure 5.6: Elemental map of Spratt limestone by microanalysis probe in
the SEM 85
Chapter 6
Figure 6.1: Expansion of mortar bar containing Limeridge limestone 88 Figure 6.2: Expansion of mortar bar containing Spratt limestone 88
Figure 6.3: Curving of reactive mortar bar (MSP) 89 Figure 6.4: Mass variations of mortar bar containing Limeridge limestone. 90
Figure 6.5: Mass variations of mortar bar containing Spratt limestone 90 Figure 6.6: Relation between expansion and mass variations of mortar bars 91
measurement of mortars stored in 1 normal NaOH at 28 and 91 days 93
Figure 6.9: Variation of pulse velocity with expansion 96
Figure 6.10: Pulse velocity in mortars 96 Figure 6.11: Variation of pulse velocity versus time 97
Figure 6.12: Dynamic modulus of elasticity in mortars , 99 Figure 6.13: Variation of dynamic modulus of elasticity in mortars 99 Figure 6.14: Variation of dynamic modulus with expansion in mortars 100
Figure 6.15: SEM petrography of MLG at 24 hours 101 Figure 6.16: SEM petrography of MLG at 14 days 102 Figure 6.17: SEM petrography of MLG at 28 days * 102
Figure 6.18: SEM petrography of MLG at 3 months 103 Figure 6.19: SEM petrography of MLG at 9 months 104 Figure 6.20: SEM petrography of MLG at 19 months 104 Figure 6.21: SEM petrography of MSP at 24 hours 105 Figure 6.22: SEM petrography of MSP at 14 days 105 Figure 6.23: SEM petrography of MSP at 28 days 106 Figure 6.24: SEM petrography of MSP at 3 months ..106 Figure 6.25: SEM petrography of MSP at 6 months 107 Figure 6.26: SEM petrography of MSP at 9 months 107 Figure 6.27: SEM petrography of MSP at 12 months ... 108
Figure 6.28: SEM petrography of MSP at 15 months... 108 Figure 6.29: SEM petrography of MSP at 20 months 109
Chapter 7
Figure 7.1: Expansion of concrete prisms containing Limeridge limestone 114 Figure 7.2: Expansion of concrete prisms containing Spratt limestone 114
Figure 7.3: Expansion of concrete prisms 115 Figure 7.4: Mass variations of concrete prisms containing Limeridge limestone... 116
Figure 7.5: Mass variations of concrete prisms containing Spratt limestone 116
Figure 7.7: Relation between Expansion and mass variation of concretes 118
Figure 7.8: Compressive strength development in concretes 119 Figure 7.9: Variation of compressive strength development in concretes 120
Figure 7.10: Tensile strength development 121 Figure 7.11: Elastic modulus of elasticity in concretes 122
Figure 7.12: Variation of elastic modulus of elasticity of concretes 123 Figure 7.13: Variation of mechanical properties of BSP with expansion 124
Figure 7.14: Pulse velocity in concretes 126 Figure 7.15: Variation of pulse velocity in concretes 126
Figure 7.16: Variation of pulse velocity with expansion of BSP 127 Figure 7.17: Dynamic modulus of elasticity in concretes 128 Figure 7.18: Variation of dynamic modulus of elasticity in concretes.. 128
Figure 7.19: Variation of dynamic modulus with expansion in BSP 129 Figure 7.20: Relation between expansion and the coefficient of 8.... 131 Figure 7.21: Relation between expansion and the coefficient of (3 131
Figure 7.22: Petrography of BLG at 23 months. 134 Figure 7.23: Petrography of BSP at 23 months... 134 Figure 7.24: ASR damage of concretes quantified by DRI method... 135
Chapter 8
Figure 8.1: Petrographic feature of BB before subjected to residual expansion test.139
Figure 8.2: Compressive strength vs depth in BB — 1 3 9
Figure 8.3: Tensile strength vs depth in BB 140 Figure 8.4: Static young modulus vs depth in BB 140 Figure 8.5: Ultrasonic pulse velocity vs depth in BB 141 Figure 8.6: Dynamic young modulus vs depth in BB 141 Figure 8.7: Petrographic features of BCSC before subjected to residual expansion
test : 143 Figure 8.8: Compressive strength vs depth in BCSC ....143
Figure 8.10: Static young modulus vs depth in BCSC ...144 Figure 8.11: Ultrasonic pulse velocity vs depth in BCSC 146 Figure 8.12: Dynamic young modulus vs depth in BCSC 146 Figure 8.13: Expansion of concrete cores extracted form Beauharnois lock (BB) 148
Figure 8.14: Expansion of concrete cores extracted form C6te-St-Catherine
lock (BCSC). 150 Figure 8.15: Expansion of concrete cores 151
Figure 8.16: Mass variations of concrete cores extracted from Beauharnois lock... 150 Figure 8.17: Mass variations of concrete cores extracted from
Cote-Ste-Catherine lock 151 Figure 8.18: Mass variation of concrete cores 151
Figure 8.19: Relation between Expansion and mass variations of
concrete cores ..152 Figure 8.20: ASR damage of BB cores quantified by DRI method before and after
residual expansion test 154 Figure 8.21: Petrography features of BB after residual expansion test .154
Figure 8.22: ASR damage of BCSC cores quantified by DRI method before and
after residual expansion test 156 Figure 8.23 shows the petrography features of BCSC 4. lm sample for the highest
expansion level of 0.359% 157 Figure 8.24: Pulse velocity in concrete cores 158 Figure 8.25: Variation of pulse velocity in concrete cores 159
Figure 8.26: Variation of pulse velocity with expansion 160 Figure 8.27: Dynamic modulus of elasticity in concrete cores 161 Figure 8.28: Variation of dynamic modulus of elasticity in concrete cores 161
Figure 8.29: Variation of dynamic modulus of elasticity with expansion 162
Figure 8.30: Resonant frequency shift in BB 163 Figure 8.31: Resonant frequency shift in BCSC 163 Figure 8.32: Normalized frequencies shift versus strain amplitude 164
Figure 8.33: Second-harmonic amplitude versus fundamental amplitude squared 164
Figure 8.35: Variation of UPV, EL and Eywith expansion in BCSC 166
Chapter 9
Figure 9.1: Relation between expansion and mass variation in concretes and
concrete cores 168 Figure 9.2: Ultrasonic pulse velocities of mortars, concretes and concrete cores 169
Figure 9.3: Variation of ultrasonic pulse velocities in reactive concretes 170 Figure 9.4: Dynamic modulus of elasticity of mortars, concretes and
concrete cores 171 Figure 9.5: Variation of Dynamic modulus in reactive concretes 171
Figure 9.6: Normalized frequencies shift (8) vs expansion 172 Figure 9.7: Second-harmonic amplitude (P) vs expansion 173
LIST OF TABLES
Chapter 2
Table 2.1: Alkali and lime solubility in the water (Wang and Gillott, 1991) 13 Table 2.2: Hydraulic ray of Na +, K + and Ca2 +, electrostatic energy and
distance between cations and oxygen (Wang and Gillott, 1991) 13 Table 2.3: Weighting factor for each feature in DRI method
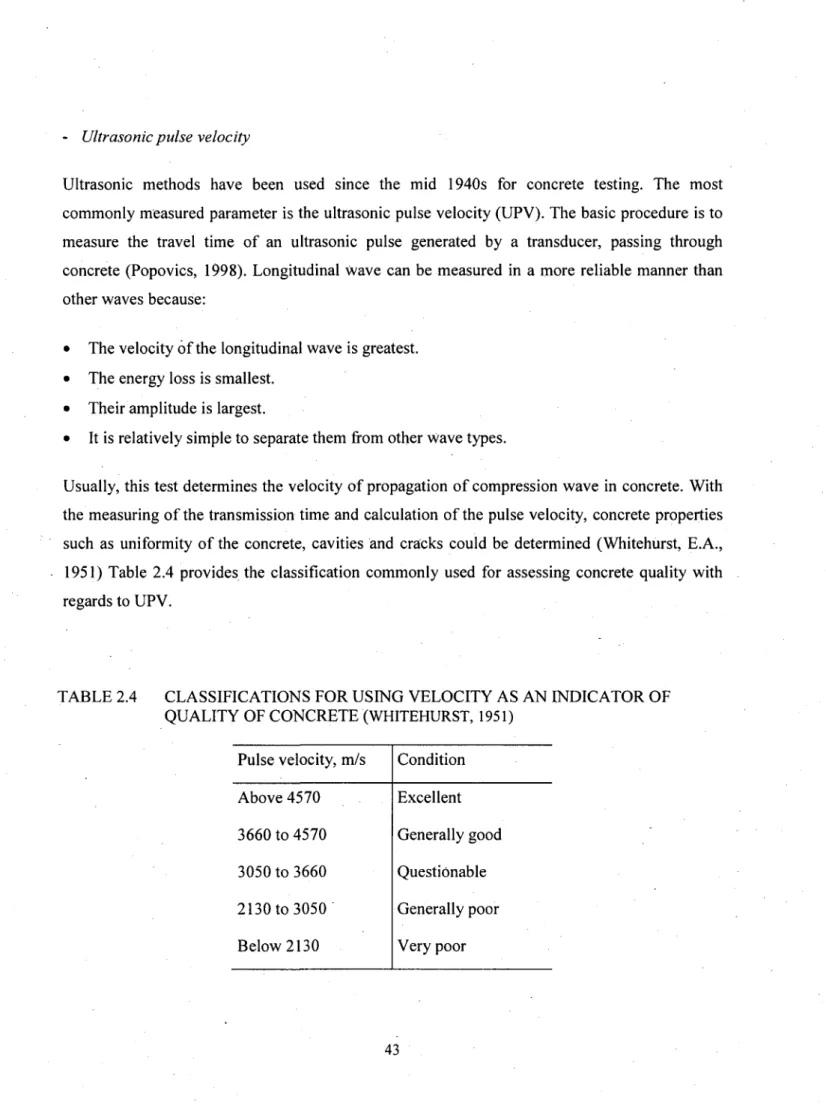
(Grattan-Bellew, 2003) 41 Table 2.4: Classification for using pulse velocity as an indicator of quality
of concrete (Whitehurst, 1951) 43 Table 2.5: Correction factor for pulse velocity at different temperature 50
Chapter 4
Table 4.1: Chemical composition of cement 71 Table 4.2: Bulk chemical compositions of coarse aggregates ....72
Table 4.3: Grading requirements of aggregate using in mortar 73
Table 4.4: Grading requirements of coarse 74 Table 4.5: Concrete mixture proportion 74 Table 4.6: Fresh concretes properties 75 Table 4.7: Depths of concrete core from the surface of the locks 80
Chapter 6
Table 6.1: Compressive strength of mortars (MPa) 92 Table 6.2: The results of chemical test on MSP at 24 hours 110
Table 7.1: Compressive strength in concretes (MPa) 119 Table 7.2: Tensile strength in concretes (MPa) ...121 Table 7.3: Modulus of elasticity in concretes (MPa) 122
Table 7.4: Nonlinear properties of concretes 130 Table 7.5: The results of petrographic examination in concrete 135
Chapter 8
Table 8.1: The results of mechanical and non-destructive tests on concrete cores...137 Table 8.2: Absolute reactivity of aggregate in concrete cores (Berube and
Fournier, 2000) ..147 Table 8.3: The results of petrographic examination in concrete cores (BB) 153
Table 8.4: The results of petrographic examination in concrete cores (BCSC) 156 Table 8.3: The final expansion and the last results of NDT methods on
CHAPTER 1
INTRODUCTION
1.1 Context
This study was undertaken in 2005 and proceeds under the supervision of professors Patrice Rivard and Jamal Rhazi at Civil Engineering Department of the University of Sherbrooke. This thesis is part of a large research project that aims at evaluating the residual expansion of concrete affected by alkali-silica reaction with non-destructive techniques and chemical analysis. The Rock Mechanic Group in civil engineering department has been studied various aspects of alkali-silica reaction in concrete for many years.
Concrete structures can be deteriorated by various physical and/or chemical factors: freezing/thawing cycles, carbonation, chloride attack on the steel reinforcement, sulphate attack, alkali-aggregate reaction (AAR), etc. AAR is a chemical reaction between certain types of aggregates and hydroxide ions (OH~) associated with alkalis in the cement, under humidity conditions. Usually, the alkalis come from the Portland cement, but they may also come from other ingredients in the concrete or from the environment. Under some conditions, the reaction may result in damaging expansion and cracking of the concrete. Concrete deterioration caused by this reaction is generally slow, but progressive.
The cracks facilitate the entry of de-icing salt solutions that may cause corrosion of the reinforcing steel, thereby accelerating deterioration and weakening a structure. The map cracking due to AAR generally becomes visible when concrete is 5 to 15 years old. AAR is a severe form of deterioration and measures need to be taken to minimize it.
The AAR-related problems were first identified in the early 1940's in California (U.S.A) (Fournier et al., 2000). Since then, it has been recognized in more than 50 countries around the world. It is likely that this problem exists in a large number of countries.
In Canada, the first documented case of AAR was investigated in a bridge in Montreal, Quebec, in 1953 (Swenson, 1957). Since then, numerous cases have been reported in Ontario, Quebec and the Maritimes. However, cases of this reaction are less common in the Prairie Provinces and
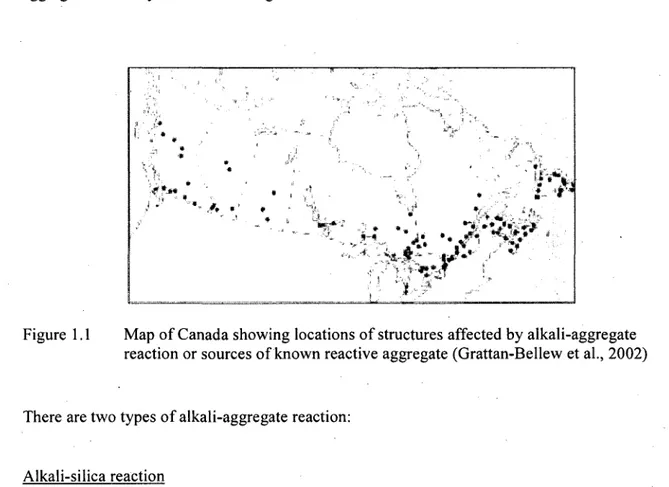
British Columbia because the alkali content of the cements produced there has been relatively low. The distribution of potentially reactive aggregate sources and documented cases of alkali-aggregate reactivity are shown in Figure 1.1.
Figure 1.1 Map of Canada showing locations of structures affected by alkali-aggregate reaction or sources of known reactive aggregate (Grattan-Bellew et al., 2002)
There are two types of alkali-aggregate reaction:
Alkali-silica reaction
This is the most common form of AAR. The alkali-silica reaction (ASR) on concrete occurs by reaction between certain silica phases in the aggregate with alkali and hydroxide ions in the pore solution of the hydrating cement to produce a hydrous alkali silicate gel (Glasser, 1992). This gel can swell by incorporation large amounts of water, causing severe and irreversible expansion. This reaction also can lead to cracking, increased permeability, and decreased strength of the concrete (Figure 1.2). Massive concrete structures, such as dams, are particularly susceptible to the damage caused by ASR, because of the availability of water and because massive gravity dams usually do not contain enough steel reinforcement to restrain the expansion. This type of reaction can be divided into two groups based on the evolution rate of the reaction as a
Figure 1.2 ASR deterioration of granite coarse aggregate (Stokowski et al, 1999)
Alkali-carbonate reaction
Alkali-Carbonate Reaction (ACR) is similar to ASR in that the alkaline environment of concrete attacks the dolomite aggregates. This reaction has been debated for a long time. In particular the dolomitic limestone from Kingston, in Ontario, Canada has been studied extensively. However, all dolomite aggregates are not reactive. Feldman et al. (1961) explored the sorption and expansion isotherms of the dolomitic limestone from Kingston. They found evidence of gel like material and concluded that the mechanism was similar to that of ASR. So they used low alkali cement and pozzolanic materials to stop the expansion caused by this reaction but without success.
Gillot (1963) has reported that certain clayey dolomitic limestone containing 40-60% of dolomite or calcite and 5-10% acid-insoluble residues, taken from Kingston, were highly reactive aggregate. Since then, the numerous occurrences of reactive carbonate aggregates in concrete have been reported in the North America (Ozol, 1994). This reaction can be explained as:
C a M g ( C 03)2 + 2 M O H => CaCO3 + Mg(OH) 2 + M2C 03 (I)
Where, M presents alkali ion. The formed M2 C 03 reacts with Ca (OH) 2 produced from cement
M2 C 03 + Ca (OH) 2 => CaC03 + 2 MOH (2)
For equation (1), the sum of volume of the solid products is less than that one of reactant, thus dedolomitization could not be the cause of expansion. In fact, the dedolomitization just simply developed the channel for access of moisture by clays (Gillot, 1964, Tang et al, 1989, 1991, Deng et al, 1993). The clay then expands by imbibing water, including pressure large enough to crack the concrete
This reaction usually occurs early and structures may show cracking within 5 years after construction. Over time, the ACR products create a "rim" around the aggregate, weakening the bond and creating microcracks and voids. Cracks allow ingress of potentially deleterious materials like water, sulfates and chlorides inside concrete, which in turn can lead to durability issues such as freeze/thaw damage, sulfate attack or steel corrosion.
Once ACR begins, it will continue until the reactants (that is, dolomite and hydrated lime) are exhausted. Therefore, structural damage caused by ACR can only be repaired by complete replacement of affected members. This reaction is less common and cases in Canada to date are limited to parts of Eastern Ontario (Figure 1.3). ACR is relatively rare because aggregates susceptible to this reaction are usually unsuitable for use in concrete for other reasons, such as strength potential. The mechanism of this reaction is different from that of alkali- silica reaction and it is not discussed in this study.
Extensive research has been carried out on ASR over the past six decades. Main area of research in Canada and worldwide are addressed (Berube et al., 2000):
1. Better understanding of the mechanism involved its deleterious process in concrete
2. Identifying the rock types or specific petrographic fancies at risk and developing quick and reliable test methods to assess the potential alkali-reactivity of concrete aggregate
3. Developing specification for preventing ASR in new concrete structure
4. Developing management action for existing concrete structure affected by AAR (diagnosis of the cause of distress, risk for future distress and actual structure integrity and repair method).
For a concrete structure affected by ASR, it is difficult to find if the reaction is completed and if not, what the reaction degree and the expansion level are, how much additional expansion can be expected and for how long.
Despite decades of study, the chemistry of alkali-silica reaction remains poorly understood, especially at the molecular scale. Yet, several studies have been carried out on the mechanism of ASR in the siliceous aggregates (Dent-Glasser and Kataoka, 1981, Chatterji, 1989, Wang and Gillot, 1991, Dron and Brivot, 1992, Prince and Perami, 1993, Wilson et al., 1994, Lombardi, 1997, Bulteel et al., 2000). However, only few works was carried out on the mechanism of ASR in the concrete containing the siliceous limestone aggregates (Monnin, 2005). This study is directed on the evaluation of residual expansion of concrete containing limestone aggregates affected by ASR.
1.2 Objectives
The objective of this thesis is to assess various non-destructive methods regarding their effectiveness to characterize the effects of the alkali-silica reaction on mortars and concrete specimens. The contribution of this work is to gather results on cementitious materials at different scales, from mortar bars, concrete prisms and cores collected from a large hydraulic structure affected by ASR. Detailed petrographic exams were conducted in order to better understand how the microstructure damaged by ASR affects the results obtained from non-destructive tests.
1.3 Thesis structure
This document contains ten Chapters. Following the introduction, chapter 2 presents the general knowledge on the ASR. In chapter 3, objective and experimental program is described. Chapter 4 presents material and their characteristics. Chapter 5 presents the characterization of aggregates. In chapter 6, the results of expansion and non-destructive tests and microscopic analysis of mortars and chemical tests are presented, respectively. The results of tests on concretes made in laboratory and concrete cores are described in chapter 7 and 8, respectively. In chapter 9, the results of experimental program will be discussed. The last chapter is conclusions and recommendations for further studies.
CHAPTER 2
LITERATURE SEARCH ON ALKALI-SILICA REACTION
2.1 Different types of alkali-silica reaction
According to the literature, there are basically two types of alkali-silica reaction:
a) Alkali-silica reaction that occurs with poorly crystalline or metastable silica minerals and volcanic or artificial glasses, which have significant initial alkali reactivity: Volcanic glass and opal are two typical examples. The rapid cooling of magma when it is exposed to the atmosphere or the environment, the atoms do not have enough time to accommodate themselves and form crystalline network forms. Therefore, crystal formation cannot occur and glass becomes a potentially reactive substance. Its thermal history and severe overcooling from larger amounts of glass that can either form govern the amount of glass in a volcanic rock. They react quickly with deleterious effects about one year after the structure building, but this period is also depends on environmental conditions (Ponce et al., 2006). Aggregates containing such materials may cause deterioration of concrete when the reactive component is present in amounts as small as 1%.
b) Alkali-silica reaction that occurs with various varieties of silice such as chalcedony, cryptocrystalline, and macrogranular quartz. These minerals have undergone deformation and significant thermal changes due to the number of tectonic processes acting during the evolution of the earth's crust. This group shows a slow or delayed reaction with deleterious expansive effects that can be seen after 6 to 10 years, or even at later ages. In other cases however, particularly when exposed to deicing salts, cracking may occur in 5 years or less. Aggregates containing such forms of silice may cause deterioration of a concrete when the reactive component is present in amounts as small as 5% by mass of the aggregate and there is a high alkali content. According to Canadian experience this category also includes several slowly expanding aggregates in which microcrystalline quartz is thought to be the reactive component.
Rocks such as greywacke, argillite, quartzite, hornfels, granite and granite gneiss are some. Such rock types may not show cracking and deterioration for up to 20 years.
These reactions introduce by their mechanism swelling and cracking that is deleterious for concrete durability. The formation and evaluation of amorphous and poorly crystallized phases could induce a variation of the volume of the aggregate and consequently participate in this swelling. Figure 2.1 shows the various aggregates and their reaction patterns regarding ASR (Idorn, 1997). An important factor to the deleterious activity of the aggregates is their size distribution. OWL OPALINE CHS?r VOLCAMC GLASS INDUSTRIAL Gl/SS PKtfourre PCWPHWttS DENSE PUNT CHERT DENSE. MIOTO amxmm SUGKXIS RQCXS SCMST mmwe FOLIATED GNEISS OfUNnreAwo GNSSSWTTH ssmmrecroHic CHSTOBTtON EKTwePAmrscu BUtLWJPBESERVCNfl FOftSWHJJNGGa BEfOfi£ BURSTING REACTION RUM OFTEN PRCS0CT VtMERfCUStC GflAWS P«OV83€ STRENGTH 0UR1N6 GEL FORMATION SOME StM REACTION UAVKVtSISLE COWTN60 INTERNAL POROUS, OPADN* fleGWNSSSATSOF SWSJJNOGSLL FORMATION CAU3WG FRACTUWNGOf SUWOUNOtfJG flOCX SUOSTANCe CWCMMS FOLLOWS CMCWNG WEAK WT©*3«*NULAfl ACCUMULATES PATCHES WTTM FJIOM REGIONS SVVgUJWG {J& WITH THOROUGHLY FORMATION DISTORTED OUAFU
2.2 Principal methods of reaction mechanism
One mechanism of reaction that is confirmed by most of the researchers is hydroxide attack of silica causing formation of ionized site and then breaking up of siloxane bonds.
2 S i 02 + 20H~ -> 2 S i O ;/ 2+ H20 [1]
SiO;/ 2 + - H20 + OH - - > H2S i O j ~ [2]
We can classify different models of mechanism according to three processes:
• Topochemical process: the reaction is hold in solid-liquid interface constituted by interstitial solution and aggregate. In this reaction, it is not necessary that all of the aggregate come in to the solution.
• The second process is dissolution-precipitation. In this model the reaction is hold in interstitial solution when the elements have passed under ionic form in different spaces. • There is also a new chemical method to quantify ASR. This method is based on the
measurement of the reaction degree. This process concerns the properties of product precipitating from dissolution of silica.
2.2.1 Topochemical process
For the first time, in 1981, Dent-Glasser and Kataoka (1981a) proposed a reaction mechanism explaining deterioration of poorly crystalline silica. This reaction is demonstrated as follow:
• Ionization of silanole by the hydroxyl ions.
Si05/2H + O H - > S i O ;/ 2+ H20 [3]
• The neutralization of the sites ionized by alkaline (Na + or K +) .
S i O „2+ N a+- > S i Os / 2N a [4]
• Formation of silanole due to siloxane bond breaking up by the hydroxyl ions attack
Silanole group formed by breaking up of siloxane bonds is then ionized by hydroxyl ions and
neutralized like shown in equation 3 and 4. Figure 2.2 shows mechanism of reaction.
Ma* ' Nflf
•o-su
I
i- *
< NO*(a)
(b)
Figure 2.2 Reaction described by Dent-Glasser and Kataoka (1981a)
(a): Ionization of silanol and neutralization of the sites ionized by alkaline
(b): Formation of silanol due to siloxane bond breaking
In the solution containing sufficient alkalis, breaking up of siloxane bond continues with
dissolution of silica. Then, the silanol of residual silica will be completely ionized (Dent-Glasser
and Kataoka, 1981a). According to Fernandez (Fernandez, 1992) ionized silanol proportion is
function of pH and also, ionization degree will increase with increasing pH of solution in balance
with silica gel. For example, the ionized silanol proportion is 0.25 for the pH of 10.5 whereas;
this proportion is 0.5 for the pH of 11.5.
Thus, aggregates composed of amorphous or poorly crystalline silica will tend to dissolve more
readily in the inherently high pH pore solution in concrete. Well-crystallized or dense forms of
silica, such as quartz, are relatively inaccessible to alkaline-hydroxide solution, and dissolution
only occurs at the surface, at a very slow rate.
Wilson (Wilson et al., 1994) believed that siloxane bonds are broken up by the alkalis ions and
not by hydroxyl ones.
In 1992, another mechanism similar to that of Dent-Glasser and Kataoka (1981) was proposed by
Pool (Pool, 1976), but in this method, the role of calcium is presented.
Generally, Ca (OH)
2performs two main functions in ASR (Wang and Gillot, 1991):
1) Source of supply of OH" ions
The attack of alkali on silica is the result of attack by OH~ on the Si-O-Si bridge in a silica
grain. Therefore, the concentration of OH" is primary important in alkali-silica reaction. A
saturated calcium hydroxide solution has a pH value of 12.5. In Portland cement concrete, the pH
of pore solution is greater than 12.5 due to the presence of alkali. It is generally agreed that the
higher the pH, the more severe the attack on siliceous material. In concrete containing reactive
silica, the OH" will be depleted by interaction with siloxane groups, but once the OH" will be
released by ionization of Ca (OH)
2. In other words, the Ca (OH)
2maintains a high pH value in
the pore solution.
2) The source of Ca
2+ions
Ca
2+ions can exchange by alkali ions in the swelling alkali-silica complex to produce a
non-swelling lime-alkali-silica complex. This process increases the alkali ions needed for further
production of a swelling alkali-silica complex by exchange with protons on silanol groups.
Therefore, Ca (OH)
2provides the source of Ca
2+needed to release alkali ions in the
alkali-silica complex.
On the other hand, the Ca
2+ions concentration in the environment controls the rate of high silica
rate at which silica diffuses out of the grains and the higher the rate at which cations diffuse into
the grains (Chatterji, 1989).
The fact that alkali ions diffuse to the reaction sites before Ca
2+ions, is explained below:
• They are surrounded by fewer number of molecule of water. So, calcium ions penetration
depends to the aggregates deterioration degree. When they are sufficiently deteriorated,
the calcium ions can penetrate inside of them (Poole, 1992).
• According to the model proposed by Chatterji (Chatterji et al., 1986), more of the smaller
ions (Na
+and K
+) will follow the penetration of OH" ions than the large ion of
calcium, although both types of cations will penetrate reactive silica grains. The reaction
involves dissolution of exterior part of aggregate and calcium ions controls amount of
diffusion. In fact, silica diffusion is slow down by its precipitation with calcium ions in
forming the C-S-H or C-K-S-H.
• Electrostatic energy of calcium ion is more than those of alkalis and it can release one
part of alkalis of gel that will be available to continue the reaction and reproduce
alkali-silica gel (Wang and Gillot, 1991).
• More alkali ions are available at the first stage. The solubility of NaOH and KOH is
much higher than that of Ca (OH)
2(Table 2.1). In other words, alkali ions are more
readily available for the exchange reaction. Also, when alkali and Ca (OH)
2are in the
same system, the solubility of Ca (OH)
2is greatly suppressed due to the common ion
effect (Figure 2.3). So the alkalis are more available than lime.
• The hydraulic radius is another factor that affects on diffusion of the cations to the
reaction sites. The hydraulic radius of Na
+and K
+ions is much smaller than that of Ca
2+ions (Table 2.2) and this tend to increase the rate of diffusion of Na
+and K
+ions (Wang
TABLE 2.1 SOLUBILITY OF ALKALIS AND Ca (OH) 2 IN WATER
(Wang and Gillot, 1991)
Alkali NaOH KOH Ca(OH)2 Solubility (g/lOOcc) AtO°C 42 107(atl5°C) 0.185 At 100°C 347 178 0.077
TABLE 2.2 HYDRAULIC RADIUSES OF CATIONS AND ELECTROSTATIC ENERGY BETWEEN CATIONS AND O " (Wang and Gillot, 1991)
Cations (R) Na+ K+ Ca^+ Hydraulic radius A0 3.3 3.1 4.2 R-0 distance A0 4.65 4.45 5.55 Electrostatic energy (Z,Z2/d) 0.21 0.22 0.36 »»
oi cot o n a«4 u i CUM art CUM CUM UO
CoO CONTENT (9/O Figure 2.3 Solubility of CaO in alkaline solution (Wang and Gillot, 1991)
2.2.2 Dissolution-precipitation process
According to this model, ASR occurs by the setting of silica ions in interstitial solution. Stark (Stark et al., 1993) reported the case of mortar made by Opal of Beltane. The observation of alkali-silica gel by optical microscope has demonstrated the large quantity of this gel in the cement paste. They mentioned that the central part of silica stays visible and the peripheral part is dissolved. In this theory, hydroxyl ions, silica and alkalis migrate in to the solution and alkali-silica gel is formed outside of aggregates. Generally this reaction can occur as follow (Dron and Brivot, 1992; Lombardi, 1997):
1) First siloxane bond breaking up by hydroxyl ions attack and then pass in the solution. Si02 + O H - + H20 =>H3SiO; [6]
2) Dissolution of Ca (OH)2 in order to balance hydroxyl ions: In solution, the cations of
Ca2+ close to Ca (OH) 2 tend to migrate toward the zone containing less calcium ions:
Ca(OH)2=>Ca2 ++20H- [7]
3) When all of the elements (OH", Na + , K + , Ca2+ and Si4 +) are contacted in the solution,
the gel of reaction that its composition depends to the proportion of elements will be formed.
H3SiO"4 +1.43 Ca2+ (n - 0,57) H20 => [Si02 + 0,43 CaO - nH20]+ 0,86 H+ + OH_ [8]
4) Alkali ions are adsorbed just one time in the reaction product and they do not release from it (Davies and Oberholster, 1988; Dron and Brivot, 1993). According to the result of chemical analysis of reaction product, interstitial solution was observed in the solid phase (Lombardi, 1997). So the role of calcium ions in this model is more important than that presented by Chatterji (1986).
According to this theory, pressure of swelling is caused by crystallization of reaction product. But, this theory could not be found, because in the term of cement hydration, the form of all reaction products is crystalline.
2.2.3 Model of quantification the reaction degree (Bulteel et al. 2000)
Bulteel et al. (2000) presented the new chemical method for quantitative measurement of the ASR degree. In fact it is the diagnosis technique that could be specific and quantitative to relate expansion to the reaction degree. This method is applied to a crushed natural reactive aggregate (Silex) kept in contact with an alkaline solution and saturated lime. This chemical system is designed to model the concrete capillary pores alkaline solution, in contact with siliceous reactive aggregates. (Figure 2.4)
Solution: K+, Ca2+, OH , H2Si042-, H3Si04 -Stage 1 C-S-H et/ou C-K-S-H Sound silica Altered silica: Si-O-H Si-O-K Si-O-Ca-O-Si Sound silica * Sound silica Altered silica: Si-O-H Stage 2 Stage 3
Figure 2.4 A schematic presentation of model of Bulteel (Bulteel et al. 2002)
The dissolution degree is measured by a selective acid treatment, and the nature of silica into solution (Q0) is characterized by liquid NMR (Nuclear magnetic resonance) spectroscopy. The
remaining silica is composed of Q4 tetrahedrons and Q3 protonated sites identified by solid
2 S i 05 / 2H - > 2 S i 02 + H20
It should be noted that the aggregate which is used in this model is a siliceous aggregate containing more than 99% silica. Thus the result of thermogravimetry analysis is only associated to the transformation of Q3 to Q4. But the reliability of this model for quantifying the reaction
degree has not already been used to the other types of aggregates containing impurities.
For example, the presence of clay in the matrix of aggregate could influence the results of thermogravimetry analysis. This topic will be discussed in chapter 6.
It has been shown that the formation of Q3 sites prevails on dissolution as the reaction
progresses and contributes to an internal silica gel generation.
The Q 3site formation and the silica dissolution are controlled by the hydroxide diffusivity in
reaction grains and by hydroxide adsorption on the solid surface. These values could be measured as follow:
moles of O, sites
n = :
moles of initial silica moles of dissolved silica
a =
moles of initial silica
Where, n and a are Q3site content and dissolution degree, respectively.
The formation of Q3 tetrahedrons causes a swelling of the aggregate and a significant increase of
its specific pore volume due to microcracking (Bulteel et al., 2002). The hydroxide diffusivity increases with the pH and the ionic strength of the solution (Chatterji, 2000). At a constant pH and ionic strength, the hydroxide adsorption decreases with the increasing size of the hydrated cations.
Q4 -> Q3 expansive transition induced by swelling of the aggregate is not proportional to the
degree of the reaction.
Monnin (Monnin et al., 2004) reported the same model-reactor allows quantifying various reaction degrees in siliceous limestone aggregates. According to their results, as ASR progresses, the formation of Q3 tetrahedron prevails on the formation of Q0 tetrahedron and the transition of
Q4 —>Q3on the siliceous limestone is expansive; so the origin of the expansion in the aggregate
seems to be an internal granular swelling.
As explained, this chemical system models the reaction between pore alkaline solution and aggregate present in concrete. But the role of fine aggregate as the other part of concrete component has not been determined. On the other hand, concrete elements may contain the siliceous fine aggregate in their structure. Therefore, using this model could not be reliable for quantifying the ASR degree in a core sample extracting from a concrete structure.
2.3 Signals of ASR
Expansion, microcracking, loss of cement paste-aggregate bond, reaction product (gel) and reaction rim are the main results of ASR in concrete. But concrete could be affected by the other factors such as freezing and thawing, mechanical loading, salt attack and shrinkage that could produce symptoms similar to those of ASR. So, the occurrence of this reaction in concrete shoufrd be confirmed. For instance, freezing and thawing does not occur in warm climates and sulphate attacks only occur in the concrete in contact with ground water.
2.3.1 Cracking
The main effect caused by this expansive reaction is cracking of concrete surface. Internal cracks spreading from expanding particles in to the cement paste and macrocracking the surface of affected structure. Dron and Brivot (1993) proposed that cracks in concrete affected by ASR are filled by ASR gel. Hydrated gel is diffused far from the aggregate into micro pores and channel
connecting them. Then, the gel reacts with Ca2+ ions and expands to cause cracking of concrete.
But in this model it was not obvious why the gel generates expansion pressure in the pores. Also, the cracking of aggregate under this compressive pressure was not described.
Bazant et al., (2000) proposed that expansive pressure accumulated in the boundary of aggregate induced cracking of concrete. According to this theory, pressure is initially released by pushing ASR gel in to accessible micro pores near the aggregate surface. When the pore around of aggregate is completely filled by gel, further formation of gel induces expansive pressure between cement paste and the unaffected concrete pore. The expansive pressure is finally released by cracking the cement paste. In this model, although expansive pressure is applied on all parts of concrete structure, the cracking of cement paste should not attend cracking of aggregate. According to analysis of crack patterns in concrete affected by ASR, Idorn (2001) concluded that expansive pressure due to formation of ASR gel is accumulated inside the reacting aggregate. Heterogeneous expansion of aggregate during the time of reaction causes tension in aggregate that induces the crack of both the aggregate and surrounding cement paste.
The cracking of concrete due to ASR may take several forms depending to the design, geometry and other stresses operating on it. The pattern cracking in plain or lightly reinforced concrete is the network of cracks that widen with time. The cracks from polygons of seemingly sound areas, roughly square to hexagonal in form and quite variable in size, are often 10 to 15cm in one direction. With time, the larger network of cracks may subdivide into smaller networks (Gillot, 1975). But in more heavily reinforced or prestressed concrete, they become directional, in the direction of the largest applied stress. If prestress is lost with age, they tend to take the form of map cracking as further random cracks appear (Shayan, 1994).
The environmental condition of structure and its composition must also be considered. For example, in the case of a floor slab of concrete, the cracks are found in the part in contact with the ground. Thus, the presence of crack in the parts of structure exposed with cycle of drying and damping, heating and loading is more remarkable. Also, less strained parts of structure show
The type of aggregate used in concrete is another important factor influencing on the form of
cracking. For example, the swelling of Potsdam sandstone is isotropic and it generates fewer
cracks compared with Spratt limestone (Rivard, 2002).
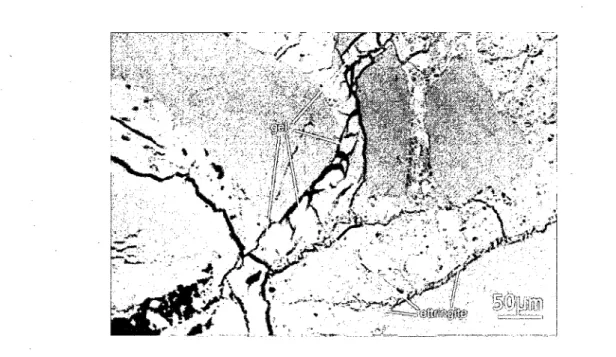
2.3.2 Reaction rim
One particular spectrographic feature associated with ASR is the growth of the dark reaction rim
at the periphery of aggregate particles (Figure 2.5). In fact, reaction rim is a zone surrounding the
aggregate, between the particle and the cement paste. Identifying the reaction rim can sometimes
be difficult around dark aggregates. It plays a significant role in the deterioration of concrete.
ASR does not cause the deterioration of concrete, if ASR is completed before the formation of
the reaction rim (Ichikawa and Miura, 2007)
• •' ;:sap
"MM
O.S c m j
Figure 2.5 Reaction rim surrounding Potsdam particles (Rivard, 2002)
The chemical composition of this zone can be different from the inner part of the particle and
related to ion exchange processes between silica in aggregate and alkali hydroxides present in
concrete pore solution. A few studies carried out on reaction rim in the case of opal aggregate,
from reactive aggregate to cement paste are reported as follow (Thaulow et al., 1975; Pool, 1976;
Wang, 1991; Brouxel, 1993):
• A rapid decrease in SiO 2 content at aggregate contact followed by a slow decrease.
• A rapid increase in CaO content at aggregate contact followed by a slow increase. For instance, Thaulow showed a calcium-rich reaction zone inside the aggregate.
• Maximum alkali content in the middle of the reaction rim, which slowly decreases toward the cement paste.
However, all rocks do not react like opal. For example, the reaction rim in the Potsdam sandstone is mainly composed of more than 99.5% silica (Rivard, 2000). As the reaction progresses and the expansion level raises, a dark rim is developing at the internal boundary of the aggregate particle. At 0.04% expansion, rims are generally difficult to identify. But at an expansion level of 0.06%, the rims are about 2mm thick and at the expansion level of 0.12-0.14%, the reaction rim is countable and affects nearly all the aggregate particles.
2.4 The concept of the pessimum proportion
Numerous studies have shown that there is a certain concentration or proportion of reactive aggregate present in an otherwise inert aggregate that cause a maximum expansion in concrete made from it. This proportion is referred as a pessimum proportion (Ozol, 1975). Similarly, according to Ozol, there is also a pessimum proportion for alkali content, which will give maximum expansion. Hobbs (Hobbs, 1988) suggested that both alkali concentration and percentage of reactive aggregate component should be considered together and pessimum can be corresponding to the ratio of SiO 2/Na2 O. He presented a graphical model explaining
relationship between SiO 2 /Na2 O and Expansion of concrete (Figure 2.6).
This figure presents expansion of four areas:
A: Reactive silica content is very low and the quantity of reaction product is too negligible to crack the concrete. So this expansion cannot be deleterious.
B: The reaction continues after concrete hardening, reactive silica content is sufficient to be
expansive in concrete and expansion increases with increasing the Si0
2/Na
2O ratio.
C: The reaction continues after concrete hardening and the concrete is cracked but the rate of
reaction slows down with increasing amount of SiO
2in SiO
2/Na
2O ratio.
D: Reactive silica content is too high and the reaction occurs before hardening of the concrete.
So, reaction product cannot make swelling and cracking of concrete.
Reactive aggregate content:
%bymass of total aggregate
O 2 0 4 0 60 8 0 lOO
fmm
Reactive silica content:
% by mass of total aggregate
Figure 2.6 Graphical model of pessimum, Water/Cement = 0.4, Aggregate/Cement = 2.75
and Na
2O
eq= 6 kg/m
3(Hobbs, 1988)
In this example, the pessimum of reactive silica content is 2.5% of total mass of aggregate. There
is not any pessimum if the aggregate contains more than 2.5% of reactive silica or fewer than it.
Such a critical level will depend on the nature of the reactive material in the mortar or concrete
and the mobility of pore fluids within the sample. This mobility will, of course depends to the
porosity and permeability of the concrete, and this will depend on a number of factors, but
perhaps most important among these will be the water/cement ratio.
2.5 Composition and other characteristics of the alkali-silica gel
ASR gels are almost responsible for expansion and damage due to ASR in concrete. Gel may be
present in cracks and within aggregate particles. The best technique for the identification of ASR
is the examination of concrete in thin section, using a petrographic microscope. Alternatively,
polished sections of concrete can be examined by scanning electron microscopy (Figure 2.7).
This gel is usually amorphous to X-ray diffraction and optically isotropic (John et al., 1998).
Reactive indices are low (between 1.45-1.51) and crystallization of older gel into various
compounds can take place. It is reported by various authors that ASR gel in concrete tend to
change composition over time, usually accumulating calcium from the surrounding cement paste.
The compositions of ASR gel vary widely, especially in CaO content. The compositions of ASR
gels in field concretes typically fall into the range (Na20+K20)/Si02 = 0.05-0.6 and (CaO +
MgO) / Si0
2= 0-0.2 (molar ratios) (Struble, 1979 and Knudsen et al., 1975). The compositions,
especially Ca contents, vary significantly with age and distance from the reaction site. Many gels
identified petrographically as ASR gel has the composition very similar to C-S-H (Diamond,
2000, Thomas, 2001 and Knudsen, 1975). Helmuth and Stark (1992) concluded that
compositionally, ASR gels can be regarded as two-component mixtures containing variable
proportions of alkali calcium silicate and alkali silicate components with nearly fixed
compositions.
Generally, alkalis that exist in C-S-H gel may incorporate the hemi-crystalline C-S-H structure
and also be trapped in the layer space of C-S-H gel as a free state or may be adsorbed on the
surface of C-S-H. Because C-S-H has a huge surface to volume ratio, among alkalis existing in
S-H gel, the adsorbed alkalis are the dominating ones. Hence it is the adsorption ability of
C-S-H surface for alkalis to decide the fixating alkalis capability of C-C-S-H gel. But it is hot enough
deep to study on the adsorbing alkalis ability of C-S-H surface and the contributing factors.
The alkali silicate end member is thought to have a composition of 17% (Na20+K20) and 83%
Si02, and the alkali calcium silicate end member a composition of approximately 6.6%
(Na
20+K
20), 52.6% CaO and 40% Si0
2. In contrast, Diamond (2000) concluded that ASR gel is
neither uniformly low nor high in Ca, but varies from one grain to another. Generally, gel rich in
calcium are considered non-swelling, but some Ca is necessary for the formation of gel. In fact,
significant expansion occurs only when sufficient reactive Ca (OH)
2is available, that systems
without Ca (OH)
2exhibit little expansion despite evidence that ASR has occurred.
The appearance of ASR gels has been described many times. Macroscopically, they have been
described as transparent and resinous in appearance with variable viscosity and when they are
altered, they become white and hard, with desiccation cracks similar to those observed in layers
of dried mad (Poole, 1992).
The SEM (Scanning electron microscopy) observation of ASR at high magnification shows that
they generally appear to be composed of very fine nodules and the dry mass appear to be finely
porous and it displays a characteristically spongy texture.
2.6 The principal factors influencing on alkali-silica reaction
It is widely accepted that the three essential components necessary for ASR-induced damage in
concrete structures are:
1) Reactive forms of silica in the aggregate
2) High-alkali (pH) pore solution
3) Sufficient moisture
Also, there are other factors that influence on the rate of reaction that will be mentioned next.
2.6.1 Reactive silica
The use of reactive aggregates in concrete is necessary for ASR to occur. The term of reactive
refers to aggregates that tend to breakdown under exposure to the highly alkaline pore solution in
concrete and subsequently react with the alkali-hydroxides (sodium and potassium) to form ASR
gel. It is important to note that not all siliceous aggregates are prone to ASR. The inherent
reactivity of aggregates depends on several factors, including aggregate structure and aggregate
texture.
- Aggregate structure
In nature, rocks contain the variety of mineral of the silica group, where silica usually has
different structural states. There are two types of reactive aggregate that could be classified by
their reaction rate (Section 2.1). The behaviour and manifestations in concrete are directly related
to the mineralogy of the aggregates, different compositions and their own microstructures.
All these reactive materials have some common characteristics. All of them contain SiO 2 as a
major component and have either a disturbed or open structure. Also both external and internal surfaces of all siliceous materials are covered with silanol, Si05/2H groups. As Hornain (Hornain
1993) underlined it, when crystalline network of aggregate is similar to that of quartz (there is a few defect) the risk of alkali-silica reaction will be reduced.
The other parameters determining reactivity of different types of silica are the length L of Si-0 liaison and inter-tetrahedron angle of a in Si-O-Si that are presented in Figure 2.8 (Couty, 1993a, 1993b, 1999). This angle can vary between 120° and 180° and determine energy of Si-0 liaison by silica reactivity. The nuclear magnetic resonance test has confirmed that this angle in quartz and opal are 144, 7 ° ± 0 , 7° and 152, 6 ° ± 6 , 9°, respectively (Couty and Fernandez,
1996).
Figure 2.8 Representation of a siloxane bond between two silica tetrahedron defining angle
a and length of silica-oxygen liaison (Bulteel, 2000)
- Aggregate texture
The factors concerning aggregate texture are granularity, micro porosity and micro cracking. All these factors influence on reaction surface that is the important parameter influencing on the rate of alkali-silica reaction.
2.6.2 High-alkali pore solution
The presence of sufficient alkalis is another required ingredient for ASR. The source of alkali can be from any of the following:
• Portland cement.
• Supplementary cementing materials such as fly ash, slag and silica fume. • Aggregates.
• Chemical admixtures.
• External sources such as seawater and de-icing salts. • Wash water (if use).
Of the above materials, Portland cement is the main contributor of alkali. The alkali present in Portland cement is in the form of potassium oxide (K20) and sodium oxide (Na20). The quantity
of alkalis in Portland cement is typically expressed as follows:
Na2Oeq = NazO + 0.65 8K20
The alkali content of Portland cements generally ranges from 0.3-1.3%. Interstitial solution analysis by Roux (Roux et al., 1992) shows that alkali concentration can fall quickly because of its consumption in some solid phase formation such as C-K-S-H. Thus, increasing in alkalis content of interstitial solution increases its consumption by solids phases and increase hydroxyl ions concentration.
Although the percentage of alkalis in Portland cement is relatively low, in comparison to other oxides or compounds, the bulk of the alkalis ultimately resides in the pore solution of concrete, and it is the associated hydroxide (OH ") concentration (necessary to maintain charge balance) that produces the inherent high pH in the pore solution (13.2 to 14.0). Based on Stanton's early work (1940), it was proposed for many years that expansion due to ASR is unlikely to occur when the alkali content of the cement is below 0.6% Na2Oeq. This value has been cited in various
One part of the alkali hydroxide of the concrete pore solution cannot contribute to ASR:
• Alkali hydroxide could induce gypsum dissolution to form portlandite and soluble alkali
sulphate. This reaction raises the sulphate concentration of the solution instead of the
hydroxide concentration.
• A partial drying of the concrete decreases, more than increases, the alkali hydroxide
concentration in pore solution.
In interstitial solution, OH", Na
+, K
+and Ca
2+are responsible of reactive silica deterioration
and increasing their concentration accelerates the rate of reaction. Also, the concentration of
alkali and sulphate are higher than that of Ca
2+(Gillot et al., 1973; Gillot, 1980; 1983, 1989;
Regourd 1989). Figure 2.9 (Diamond, 1983) illustrates increasing of potassium and sodium ions
concentration and reducing in calcium ion content and its solubility K
s= |OH" J . [Ca
2+J.
> | 0,5