OATAO is an open access repository that collects the work of Toulouse
researchers and makes it freely available over the web where possible
Any correspondence concerning this service should be sent
to the repository administrator:
[email protected]
This is an author’s version published in: http://oatao.univ-toulouse.fr/23841
To cite this version:
Sarih, Houda
and Tchangani, Ayeley
and Medjaher, Kamal
and Péré, Eric Data preparation and preprocessing for broadcast
systems monitoring in PHM framework. (2019) In: 6th International
Conference on Control, Decis
Data preparation and preprocessing for broadcast
systems monitoring in PHM framework
Houda SARIH1,2, Ayeley P. TCHANGANI1, Kamal MEDJAHER 1 and Eric PERE2 1 Production Engineering Laboratory (LGP), INP-ENIT, Universit´e de Toulouse
e-mail: houda.sarih, kamal.medjaher, [email protected] 2 WorldCast Systems, Merignac
e-mail: h.sarih, [email protected]
Abstract—Nowadays, companies producing goods use produc-tion systems that are equipped by different sensors in order to monitor efficiently their behavior. Most of the time, the infor-mation collected by these sensors is mainly used for production monitoring rather than to analyzing the state of health of the production system. By so doing, these companies have a large and growing amount of data at their disposal. These data make it possible to extract information and knowledge for a better control of the system in order to improve its efficiency and reliability. With the emergence of Prognostics and Health Management (PHM) paradigm few years ago, it has become possible to study the state of health of an equipment and predict its future evolution. Globally, the principle of PHM is to transform a set of raw data gathered on the monitored equipment into one or more health indicators. In this framework, the present paper addresses issues related to raw data. A generic approach is proposed for obtaining monitoring data that are reliable and exploitable in a PHM application. The proposed approach is based on 2 steps: collecting data and preprocessing data. This approach will be applied to a real world case in broadcast industry to show its feasibility.
Index Terms—Prognostics and Health Management, Data col-lection, Data cleaning, Data preprocessing, Useful information.
I. INTRODUCTION
In recent decades, manufacturers have begun to focus on activities related to remote monitoring, fault diagnostic and, more broadly, predictive maintenance solutions. This interest is motivated by the operators desire to reduce operational expenses, such as operating and maintenance costs. In this context, efforts are being made to develop monitoring and diagnostic systems and decision support solutions based on Prognostics and Health Management paradigm. The state of art of these approaches show that various works aiming at the integration of predictive maintenance are published and some solutions already exist on the market. In 2006, ALSTOM launched a preventive maintenance tool called TrainTracer, which collects useful data on the train and captures them from several sources of sensors to continuously monitor the health status of various components. A few years later, the same company launched a predictive tool called ”HealthHub” that integrates TrainTracer and automates certain tasks such as alerts and anticipating repairs [1]. Another solution for the implementation of predictive maintenance, known as ”Orbita”,
has been developed by Bombardier Transportation, which combines data from rolling stock with Bombardier’s engineer-ing know-how and fleet knowledge. This capability improves active vehicle management and infrastructure maintenance, performance and operation [2]. In 2015, SNCF also intro-duced predictive maintenance for its trains and pays particular attention to the relevance of the data collected [3]. In 2017, as part of the Connect project, Air Liquide created a remote control center for all its French plants, whose challenges are: the development of predictive maintenance, data recording and analysis and the measurement of the slightest discrepancies that could be a sign of the failure of a particular installation [4]. At the same year, Air France presented its Prognos range of two dedicated predictive maintenance solutions at the Paris Air Show 2017: ”Prognos for Engine” for motors, and ”Prognos for Aircraft” for planes. This analysis tool makes it possible to identify and understand the wear of various components, plan their replacement before they fail and avoid costly maintenance operations [5]. Table I summarizes some companies that have established predictive maintenance tools, their industrial sectors and the names of the tools.
TABLE I
SOME PREDICTIVE MAINTENANCE SOLUTIONS USED IN INDUSTRIES.
Company Sector maintenance solutions Alstom Railway transport HealthHub Bombardier Railway transport Orbita
Air liquid Industrial Gas A remote operation andoptimization center Air France Aerospace Prognos General Electric Energy Equipment insight
The targeted application of the approach being developed in this paper is a broadcast system from WorldCast Systems company. At WorldCast Systems, which is a truly global actor offering a multitude of product lines for the broadcast market, experts and engineers created a proactive service for their products that sends to the user regular reports on the status of key parameters such as temperature, current and voltage, as well as information on components performance and life. Condition monitoring (CM) is one of WorldCast Systems historic businesses and such functions are integrated into all the equipment of various ranges. However, even if
the latter have knowledge of the physical behavior of the systems, they encounter difficulties when it comes to exploit this knowledge and implement PHM applications. Because this process requires to transform the raw data into useful information, which makes it possible to estimate and predict the systems health state at every instant. These few analyzed systems show the interest in predictive maintenance along with customers requirements that are more and more demanding (Higher performances, low prices, etc.). Moreover, with the complexity of nowadays systems and the constraints the users may face, it is necessary to establish a scientifically proven approach to deal with their maintenance.
The main purpose of this paper is to position the industrial problem within a more general scientific framework. The research work that will be presented in this contribution aims to preprare and clean data in order to have exploitable and reli-able data to be used for monitoring, diagnostic and prognostic of failures. The objective is to enable anomalies to be detected and faults to be anticipated by taking into account the context and conditions of use (environment, localization, etc.). This research work can thus be positioned in the PHM framework where the physical system is a Frequency Modulation (FM) transmitter monitored by different sensors. In the field of PHM, three approaches can be used for the monitoring pur-pose [6]: physics-based (also called model-based) approach, data-driven approach and hybrid approach that combines the two first ones. The pluridisciplinarity and complexity of the physical phenomena characterizing industrial systems, added to the relatively high cost of the experimental considerations to generate degradation models, make it difficult to imple-ment the approach based on physical model. This has been reinforced by various collaborations with industrial partners. In this paper, and given the knowledge and the data available, the data-driven approach would be the most appropriate to implement. Indeed, given the complexity of the studied system, which is located in different places in the world and subjected to different conditions and contexts of use, it would be difficult to use the approach based on a physical model.
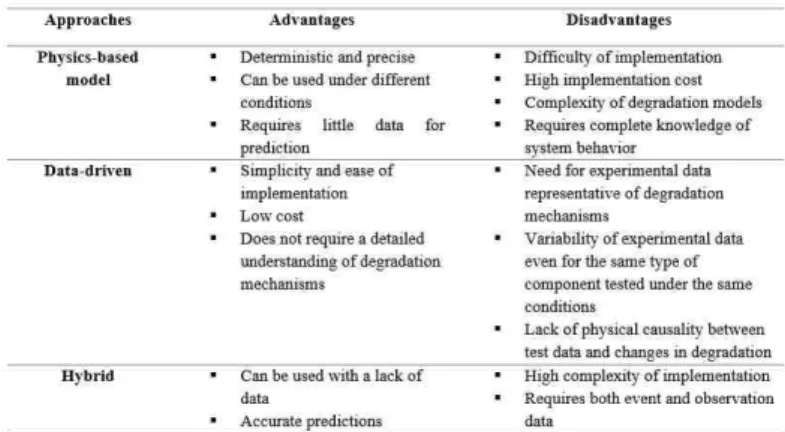
For example, in practice, it is very difficult to obtain an exploitable model of nominal behavior including damage to an FM transmitter. Indeed, the FM transmitter considered here is a complex system involving different physical phenomena (electrical, mechanical, etc.) and consequently, its modeling requires multidisciplinary skills. Furthermore, for the gener-ated model to be usable, it must be simple, if possible linear, with stationary parameters and take into account variable operating and environmental conditions. Thus, the difficulty of constructing easily exploitable models, the relatively excessive cost and the low applicability of the model-based approach led us to choose the data-driven approach. Also, this choice was motivated, among others, by the simplicity of implementation of the approach on industrial systems and its low cost. Each of the aforementioned approaches has its advantages and disadvantages (see table II), which limit their applicability.
In this context, this paper deals with the description of a general approach for collecting and preprocessing data to
TABLE II
SUMMARY OF ADVANTAGES AND DISADVANTAGES OF THE THREE PROGNOSTIC APPROACHES.
extract useful information for monitoring, which are represen-tative of the critical degradation mechanisms and which allow extracting relevant features for fault detection, diagnostic and prognostic. For this purpose, two main steps are identified:
• Collecting data. This step consists in specifying technical characteristics of the acquisition system and defining the storage format in order to be used by PHM algorithms. • Preprocessing data. At this step, it is a question of
remov-ing noise from raw data and extractremov-ing useful information for PHM algorithms.
One can notice that these tasks are basically at the system comprehension and the engineering levels, but they are nev-ertheless crucial for the success of the PHM process. Indeed, a poor choice of components, of parameters to monitor, or a poor specification of the acquisition system may lead to biased results in detection, diagnostics, prognostics and decision. Furthermore, implementing the approach on a complex system is potentially a challenging task. All this requires multidisci-plinary skills and close collaboration with the manufacturer and/or the operator of the system who have precious infor-mation. Moreover, in practice, and most of the time, the raw data collected from the system are not directly exploitable and need some preprocessing actions (data cleaning, denoising, resampling, missing data estimation, wrong data substitution, etc.), which is the purpose of this paper. Figure 1 shows the main idea of the contribution.
The remainder of this paper is organized as following. The second section deals with the proposed methodology by presenting its purpose as well as its different steps; the third section is devoted to the application of the methodology to a real world case in the domain of broadcast products in order to show its effectiveness; and finally, the fourth section concludes the paper and presents some future works.
II. METHODOLOGY
The main aim of this paper is to obtain exploitable and reliable data. The purpose of data acquisition is to collect
Fig. 1. Idea around the contribution of the paper.
Fig. 2. What data scientists spend the most time doing [7].
monitoring data. The data collected must make it possible to monitor the health assessment of the system over time and to understand its degradation phenomena. Data can come from different sensors installed on/in the critical components or from inspections performed by operators working on the system. The choice of the sensors depends on the components to be monitored and the type of data to be recovered. This choice should take into account the use of a minimum number of dedicated sensors to collect representative and relevant data and deploy appropriate acquisition facilities. These data are recovered via dedicated acquisition cards or recording files and stored in a secure database. They are then preprocessed to eliminate errors in data reception that might affect the interpretation of degradation phenomena to ensure that they are complete, reliable and ready for further processing. Fur-thermore, it is necessary to save the data in formats easily accessible by processing algorithms. In a report published by Forbes [7], data preparation accounts for about 80% of a data scientists role, with 60% of that time spent with the cleaning and organizing of that data for analysis; see for instance Figure 2 for most occupation of a data scientist.
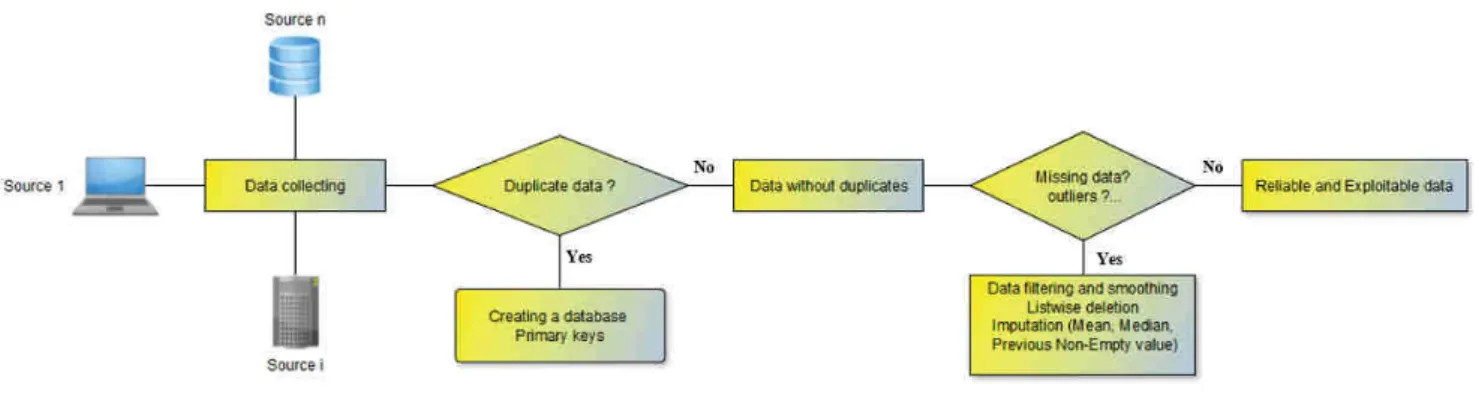
The overall PHM framework that we are concerned with can be schematically summarized by the Figure 3 where the goal is to obtain monitoring, reliable and exploitable data which represent the degradation mechanisms and which are necessary in a PHM application.
In the following subsections each of the aforementioned
steps will be described more precisely. A. Data collection
In a company there are many products. The first step consists in choosing the system to analyze. One possible criterion to do this is to proceed by the amount of the collected data. The choice will then be made according to the product which has a maximum representative data over a long period [8]. The problem is that the company may have several data sources. Burn-in data that provides information on youthful defects, customer online data and data in the SD card that provides information on the system in normal operation and the wear period (Figure 4). All these information are important for system monitoring. The first solution to this problem is to create a single database to group the information disseminated in the databases, organize them and store them in the same format to help decision-making in the company and facilitate the processing of these data for use in PHM algorithms. B. Data preprocessing
Data Preprocessing is a technique that is used to convert raw data into clean data set that are reliable and exploitable in a PHM or any other application. In other words, whenever the data are gathered from different sources, they are collected in raw format, which is not suitable for the analysis. Real-world data are often incomplete, inconsistent and lacking in certain behaviors or trends and are likely to contain many errors. Data preprocessing is a proven technique of resolving such issues. This technique prepares the raw data for further processing [9]. ISO definition for data preprocessing can be found in [10].
Different steps are involved for Data Preprocessing. These steps are described below [9]:
Data cleaning: This is the first step which is implemented in Data Preprocessing. In this step, the primary focus is on handling missing and noisy data, detection, and removal of outliers, minimizing duplication and computed biases within the data.
Data integration: In this step, the data, which can be gathered from various sources, are combined. The combined data are then cleaned and used for processing and analysis.
Data transformation: This step is used to convert the raw data into a specified format according to the need of the model. For this purpose, different options exist, such as the following ones:
• Normalization - In this method, the numerical data are converted into a specified range, for instance to be ranged between 0 and 1 so that scaling can be performed. • Aggregation - The concept can be derived from the word
itself, this method is used to combine some groups of data into one group.
• Generalization - In this case, lower level attributes are converted to a higher standard.
Fig. 3. Collecting and preprocessing data methodology flowchart.
Fig. 4. Collecting data and creating of a single database process.
Fig. 5. Preprocessing data
Data Reduction: This step is used to minimize the amount of data that needs to be stored in a data storage environment. After the transformation and scaling, duplicated (or redundant) data are removed and efficiently organized. The creation of a single database was the solution to both problems: the problem of several data sources and also duplicate data. Each line in the table in our database corresponds to one record. One of the main objectives of a database is to avoid data redundancy or duplication. A duplicate is two (or more) identical records. To be careful about this, a primary key is used as a unique identifier for each line.
The overall data preprocessing procedure performed in this work is depicted in Figure 5.
III. CASE STUDY
The methodology described in the previous section is ap-plied to a case study in the field of radio and television broadcasting. This case study consists of analyzing on a FM transmitter from the WorldCast Systems company.
A. Description of the considered system
The FM transmitter is a complex system composed of different subsystems (please refer to subsection 3.1 System selection in [8] for more details)
In the following subsection, we will present the first task of the proposed methodology that is identifying parameters to measure and necessary sensors to this end.
B. Parametres to measure and sensors to use
The parameters which are to be monitored in a PHM implementation can be selected based on their relationships to functions that are crucial for safety, likely to be implicated in catastrophic failures, essential for mission completeness or that can result in long downtimes. The selection is also based on the knowledge of the critical parameters established by past experiences [11], on field failure data taken from similar products and on qualification testing. For the considered FM transmitter, 14 parameters have been considered because sen-sors for this purpose are already integrated during the design process of the FM transmitter.
The monitoring data collected by different sensors from several sources, where initially saved as data files in different formats (usually .txt, .csv or .tdms). In our case, the initial data where in XML format. A typical data set are shown on the left side of Figure 6 from which we extract the csv file of the right side of that Figure that is more convenient for analysis by data analysis software such as Matlab.
In order to be able to manage all the company’s data from sensors and have only one data source instead of searching for information in several services, the solution was to create a single database by mySQL Workbench and send all the data from different sources into this database. The preprocessing of the latter takes 2 months
Fig. 6. Examples of data file formats: on the left a formal XML, on the right a CSV format.
Fig. 7. a) Example fan speed measurements with missing values, b) Method 1: Replacing by the previous value not missing, c) Method 2: Replacing missing values with the average value and d) Method 3: Ignore missing values (Listwise deletion).
Data cleaning processes are then used to obtain exploitable data. For instance, in the case of missing data, techniques such as replacement by the value of previous not missed data, average value, or ignoring missed data where used. For missing data, 3 methods are tested with an example of 100 fan speed measurements and 15% missing values. Figure 7 shows an example of these procedures for the fan speed parameter. In our case, the preprocessing of the FM transmitter data took 2 months.
C. Data import and data mining
The studied example of the company WorldCast systems contain a CSV file (comma-separated values) with measurements taken every minute. The typical approach to working with data distributed across multiple files and sources is to create a database, explore it to identify the data values to be analyzed, and then import these values for the
Fig. 8. Graphical representation of the ”Supply temperature” measurement.
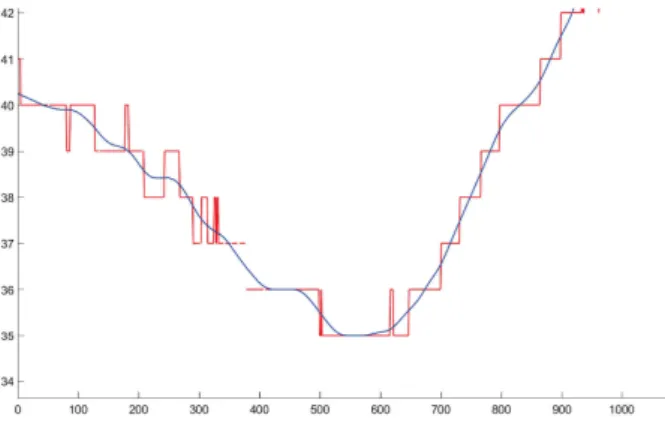
Fig. 9. Graph of the actual and smoothed ”Supply temperature” measurement.
entire data set. The MATLAB import tool allows us to select columns in a CSV file and import the selected data into various MATLAB data structures, including vectors, matrices, cell tables and tables. With the import tool, we select CSV file columns and a target format. We can import the data directly from the example file or generate a MATLAB function that imports all files corresponding to the format of the example file. Once the data are imported, preliminary plots are generated to identify patterns and make conversions. Most real-world data contain missing or incorrect values and, before the data can be explored, they must be identified and processed. After the graphical representation of the exam-ple of the measured supply temperature data, we found peaks outside the normal cyclical fluctuations (Figure 8).
There are several ways to automate peak identification. For example, one can apply a smoothing function on Matlab (Figure 9) and locate the peaks by calculating the difference between the smoothed and the original curves (Figure 10).
After removing abnormal peaks from the data, one can notice the absence of missing values (Figure 11). Indeed, a moving average filter smooths the data by averaging a number of points from the input signal to produce each point in the
Fig. 10. Plotting the difference between actual and smoothed values
Fig. 11. Missing values replaced by Moving Average Filtering
output signal [12]. This process is equivalent to low-pass filtering with the the response of the smoothing. In equation form (1), this is written:
y[i] = 1 M M −1X j=0 x[i + j] (1) where:
x[ ] is the input signal. y[ ] is the output signal.
M is the number of points used in the moving average. By applying data filtering and smoothing methods, it was possible to remove the outliers and the missing data and get reliable and exploitable data for further processing (feature ex-traction, fault detection, fault diagnosis and fault prognostics).
IV. CONCLUSION AND PERSPECTIVES
In this paper, a methodology has been proposed to obtain reliable and exploitable monitoring data for a PHM application in order to assure predictive analysis and reliability objectives demanded by industrial companies. The developed approach consists in analyzing the system, identifying the parameters to measure along with necessary sensors for this purpose, and the pre-processing tasks to do to obtain PHM exploitable data.
Fig. 12. Data without missing values and outliers
The application of this methodology to a real world problem with data stored in different sources and different formats has shownits promising results.
The next step will consist in developing algorithms to extract knowledge from these data; this knowledge will be the basics for PHM algorithms to be developed. On this basis, the PHM algorithms development (diagnostics, prognostics and decision) can be considered. For this purpose, it is necessary to give meanings to the preprocessed data by processing them; this will reveal their content and allow estimating the health status of the components or of the system at every instant.
REFERENCES
[1] LU, Xiangyang, SHAN, Sheng, TANG, Guoping, and al. Survey on the Railway Telematic System for Rolling Stocks. In : Proceedings of the 2015 International Conference on Electrical and Information Technologies for Rail Transportation. Springer, Berlin, Heidelberg, 2016. p. 645-656.
[2] DUB, E. Bombardier ORBITA: predictive asset management. In : AusRAIL PLUS 2007, 4-6 December 2007, Sydney, NSW, Australia. 2007.
[3] Versailles, V. ”Digitalization in Maintenance at SNCF.” No.5. Novembre 2018.
[4] America, South. ”1 for 10.” (1806).
[5] Air France Industries KLM Engineering & Maintenance ”La mainte-nance pr´edictive avec Prognos.” 2017.
[6] GOURIVEAU, Rafael, MEDJAHER, Kamal, and ZERHOUNI, Noured-dine. From Prognostics and Health Systems Management to Predictive Maintenance 1: Monitoring and Prognostics. John Wiley & Sons, 2016. [7] Press Gill, ”Cleaning Big Data: Most Time-Consuming, Least Enjoyable
Data Science Task, Survey Says”, Forbes, 2016.
[8] SARIH, Houda, TCHANGANI, Ayeley, MEDJAHER, Kamal, and al. Critical components identification based on experience feedback data in the framework of PHM. IFAC-PapersOnLine, 2018, vol. 51, no 11, p. 429-434.
[9] Sagar S. Jambhorkar and Vijay S. Jondhale. Data Mining Technique: Fundamental Concept and Statistical Analysis. Horizon Books, 2015. [10] ISO 13374-1:2003. (n.d.). Condition monitoring and
diag-nostics of machines Data processing, communication and presentation Part 1: General guidelines. Retrieved from http://viewer.afnor.org/Pdf/Viewer/?token=CBEmBI2g7w1
[11] PECHT, Michael G. et KANG, Myeongsu (ed.). Prognostics and Health Management of Electronics: Fundamentals, Machine Learning, and the Internet of Things. John Wiley & Sons, 2018.
[12] SMITH, Steven W., et al. The scientist and engineer’s guide to digital signal processing. 1997.
![Fig. 2. What data scientists spend the most time doing [7].](https://thumb-eu.123doks.com/thumbv2/123doknet/2956432.80927/4.892.73.423.378.556/fig-data-scientists-spend-time-doing.webp)