To link to this article : DOI:10.1109/TITS.2015.2477675
URL :
http://dx.doi.org/10.1109/TITS.2015.2477675
To cite this version :
Amhaz, Rabih and Chambon, Sylvie and Idier,
Jérôme and Baltazart, Vincent Automatic Crack Detection on
Two-Dimensional Pavement Images: An Algorithm Based on Minimal Path
Selection. (2016) IEEE Transactions on Intelligent Transportation
Systems, vol. 17 (n° 10). pp. 2718-2729. ISSN 1524-9050
O
pen
A
rchive
T
OULOUSE
A
rchive
O
uverte (
OATAO
)
OATAO is an open access repository that collects the work of Toulouse researchers and
makes it freely available over the web where possible.
This is an author-deposited version published in :
http://oatao.univ-toulouse.fr/
Eprints ID : 17205
Any correspondence concerning this service should be sent to the repository
administrator:
[email protected]
Automatic Crack Detection on Two-Dimensional
Pavement Images: An Algorithm Based
on Minimal Path Selection
Rabih Amhaz, Sylvie Chambon, Jérôme Idier, Member, IEEE, and Vincent Baltazart
Abstract—This paper proposes a new algorithm for automatic crack detection from 2D pavement images. It strongly relies on the localization of minimal paths within each image, a path being a series of neighboring pixels and its score being the sum of their intensities. The originality of the approach stems from the proposed way to select a set of minimal paths and the two post-processing steps introduced to improve the quality of the detection. Such an approach is a natural way to take account of both the photometric and geometric characteristics of pavement images. An intensive validation is performed on both synthetic and real images (from five different acquisition systems), with comparisons to five existing methods. The proposed algorithm provides very robust and precise results in a wide range of situations, in a fully unsupervised manner, which is beyond the current state of the art.
Index Terms—Crack detection, minimal path, Dijkstra algo-rithm, non destructive control, road surface condition.
I. INTRODUCTION
S
URVEYS of pavement condition is an important task to insure road safety. In many countries, pavement distress detection is considered as an essential step for road surface inspection. The objective is to detect surface distresses, like rav-eling and cracking, in order to plan effective road maintenance and to afford a better sustainability of the pavement structure. The most common type of surface distress is cracking. Human visual inspection has been gradually replaced by automatic data collection at traffic speed using both area and line scan cameras [1]. Off-line processing techniques have been then developed for surface condition monitoring as a support of human visual control. Readers can find a brief history of the imaging devices in [2]. CCD, Charge-Coupled Device, acquisition techniques provide information on the presence of cracks through the pixel intensities (pixels corresponding to cracks being generally ofR. Amhaz and V. Baltazart are with LUNAM Université, IFSTTAR, 44344 Bouguenais, France.
S. Chambon is with the Institut de Recherche en Informatique de Toulouse (IRIT), INP-ENSEEIHT, Université de Toulouse, 31071 Toulouse, France (e-mail: [email protected]).
J. Idier is with LUNAM Université, IRCCyN, UMR CNRS 6597, Ecole Centrale de Nantes, 44321 Nantes, France.
Color versions of one or more of the figures in this paper are available online at http://ieeexplore.ieee.org.
Digital Object Identifier 10.1109/TITS.2015.2477675
dark intensity). 3D imaging technology has emerged in the past years and gives the imaging system to detect distresses thanks to the elevation data. In the paper, we concentrate on crack detection by processing 2D pavement images with the prospect to generalize the proposed method to the latest 3D imaging technologies.
Full automation of crack monitoring is a challenging image processing problem, because in most cases the cracks appear as thin, irregular lines, buried into a strong, textured noise. Indeed, only few of the existing methods are fully unsupervised [3].
Photometry-Based Approaches: Quite different principles have been adopted to tackle the problem. The most basic methods are based on the sole photometric information, i.e., they decide whether each pixel belongs to a crack according to a simple thresholding operation. Some methods determine the threshold value in a global way [4], and other at a local scale, e.g., in small patches, with adaptive thresholding [5] or by hysteresis [6]. To determine the threshold, many opti-mization approaches can be involved from the simplest one based on Otsu algorithm [7] to more sophisticated ones, like fuzzy logic based techniques [8] and genetic algorithms [9]. All these approaches are of limited efficiency, since the pixels corresponding to cracks cannot be well separated from the other pixels by a simple thresholding operation [10]. Photometry-based methods can also involve a supervised learning step. For instance, the training of a neural network [11], a Bayesian classifier [12], an AdaBoost classifier [13], or the estimation of the parameters of Gaussian mixture [14] are often considered to solve this classification problem. However, such photometry-based methods suffer from one important drawback in our context: the need of a supervised training stage.
Introduction of Geometric Constraints:More efficient meth-ods incorporate spatial processing steps involving groups of pixels at a local scale. For instance, mathematical morphology based methods consider dilation and erosion operators to reduce the discontinuities within the crack pattern and to remove false detections [5], [15]. However, the automatic implementation of the latter methods remains difficult because of the large amount of parameters to tune. Based on the fact that cracks can have different width and size, multi-scale analysis with watersheds [16], wavelet decomposition [17] have been intensively used but the main difficulty is to select the right scale for identifying cracks or how to combine the detections at multi-scale to compute the final decision.
Photometry and Geometry-Based Approaches: Advanced methods introduce higher-level geometrical information on the
topology of cracks combined with the photometric information. Cracks are then considered as sets of contiguous pixels of low intensities. For instance, the Markov based method proposed in [10] and [18] favors the continuity between neighboring crack pixels using a statistical approach. However, it is a computa-tionally intensive method, and it relies on statistical parameter values that must be tuned in a supervised manner. Let us remark that the crack detection problem from pavement images shares some common points with other tracking problems, such as fiber tracking from diffusion MRI images, or object contour tracking for image segmentation. Some authors have exploited these similarities to propose crack detection methods using a tensor voting strategy [19], on active or geodesic contour approach [5], [20], for instance. In the latter case, a crucial step of the methods relies on a minimal path principle (also referred to as shortest path principle) that is also shared by other recent contributions [21], [22].
Minimal Path Based Methods:Generally speaking, the min-imal path problem consists in finding best paths between pairs of nodes in a graph, with respect to a criterion defined as a cumulated cost along the paths. In the context of image processing, the cost usually combines two terms. The first one accounts for the pixel intensities along the path, and the second one locally evaluates the regularity of the path [23], [24]. The two latter terms are often called an external and an internal energy, respectively, and also as a fidelity-to-data term and a regularizing term.
Efficient applications of the minimal path principle to several image processing problems are made possible because fast algorithms exist to compute the solutions, such as Dijkstra’s algorithm [25] and the fast marching algorithm [26], the latter being specifically suited to minimize costs involving an internal energy based on the length of the path. Thanks to such algo-rithms, it is possible to take relatively high-level geometrical in-formation into account, while maintaining moderate computing time and memory requirement. However, the direct application of the minimal path principle requires that some information be known in advance, such as the two endpoints of each path to be detected. Unfortunately, such a prior knowledge is not avail-able in a fully unsupervised context. Worse than that, cracks are not simple lines. They may appear as complex networks of unknown geometry. To overcome both difficulties, several recent methods share a common overall structure [19]–[23]:
• In a first step, some of the darkest pixels are selected as the best candidates to belong to the crack structure. • In a second step, pairs of preselected pixels are considered
as endpoints and minimal paths joining them are built with a view to track the whole structure of the cracks. At the first step, some contributions proceed according to a manual procedure [23]. Others rely in a more automatic way [20], [22]. Finally, [21] considers that every pixel is a potential endpoint. At the second step, [19], [20] use a regularization term to favor the smoothness of the trajectory, while [21], [22] only consider the cumulated pixel intensities along the paths, without any internal energy term. In this paper, we adopt the latter approach, because we consider that the shape of pavement cracks is too irregular to be well described by any internal energy term favoring smooth curves.
Contributions: Indeed, it is a distinctive contribution of the present paper (shared by our early version [22]) to develop a crack detection method that is only based on the photometry and on a minimal assumption that pixels belonging to the cracks form continuous paths of arbitrary shape. In particular, a difference between [21] and ours is that the former assumes that each crack is organized along a preferred direction, so that it can be tracked using a faster algorithm than Dijkstra’s algorithm for all possible pairs of endpoints. In contrast, we do not make any restriction on the shape of the cracks, while being more selective at the initial stage of electing potential pairs of endpoints. Additionally, our method incorporates two post-processing steps, where the currently detected paths are merged, and some pixels are added to the crack or removed, de-pending on their position and on their photometry. In particular, the resulting detected cracks gain a certain thickness, whereas the minimal path stage only provides one pixel thick paths.
Another distinctive feature of the proposed method is its fully unsupervised character at all stages, including the initial stage of endpoint selection. We emphasize here that all the tests presented in the paper to illustrate the efficiency of the method have been performed with fixed values for all the parameters.
Organization of the Paper: The next section introduces fur-ther details on the minimal path principle and on its existing ap-plications to road crack detection. Section III contains our own contribution, under the form of the three-stage method sketched above, where the minimal path principle is the central part of the processing chain and two post-processing steps to refine the detection and to estimate the width of the cracks. Section V proposes a performance study, along a protocol introduced in Section IV. It includes a comparison with five existing methods, and both synthetic and real images are considered. Section VI contains the main perspectives of the present contribution.
II. EXISTINGMINIMALPATHAPPROACHES A. Minimal Paths in Graph Theory
In graph theory, finding shortest paths consists in estimating a path between two vertices such that it minimizes a cost that is usually the sum of the weights of each edge included in the path. In this paper we have chosen the term minimal path instead of shortest path because it better corresponds to what is done, i.e., the paths have to minimize a cost that does not take into account a geometric distance. In the rest of the paper, we always use the term minimal path.
Algorithms for finding minimal paths have been efficiently used for transportation networks, high performance communi-cation, fault tolerant routing [27]. By considering images as connected graph of pixels, minimal path extraction has been used for a number of applications in image processing such as segmentation or medical images [28], road extraction in satellite images [29] or object boundary extraction [30].
For using minimal path estimation algorithms, these two important elements have to be chosen:
1) The used cost function depends on the weight of each edge. It should be designed so that good solutions have a low cost while poor solutions have high cost. In image
processing, most of the cost functions are based on grey levels or colors. Moreover, many techniques include a regularization term in order to minimize the distance, the regularity of the path, the length of the path [23], [24]. These terms are really appropriate in applications such as detecting blood vessel in medical imagery because the object to detect have a regular shape and a constraint length. In the case of crack detection, these constraints are not really appropriate because the shape of the cracks is more chaotic.
2) The optimization approach to find the path that minimi-zes this cost. The most famous methods are the Dijkstra algorithm [25] and the fast marching approach [26]. The way to design the cost influences the optimization approach that is chosen and vice versa. The rest of the paper focuses on using these costs and optimization approaches for crack detection.
B. Cost and Optimization for Road Crack Detection
Pavement images are highly textured images and cracks are long dark filaments that can be assimilated to perceptually sa-lient curves. It naturally leads to search for a path composed of dark pixels [27]. In the context of active contours, the goal is to find a curve that fits an object or a region by iteratively minimiz-ing a cost or energy function, E, of the curveC, defined by [31]:
E(C) = L Z 0 ³ w1kC′(v)k 2 + w2kC′′(v)k 2 + P (C(v))´dv (1)
where c(v) represents a curve drawn on a 2D image, [0, L] its domain of definition, and L the length of the curve. The two first terms represent the internal forces (regularity of the curve) based on first and second derivatives with w1, w2 the weights
of each of these two parts. The third term is the external force. Here, we consider an external force based on grey levels. More-over, the first two terms favor smooth curves, whereas the shape of the cracks are not smooth in general. Therefore, we propose a simple cost function c that only incorporates an external force
c(pij) = j
X
m=i
I(m) (2)
where xi is the source point, xj the destination point, and m
is a pixel of the path. In [20], an additional regularization term was considered. Here, we advocate that using the cost (2) is more natural to recover crack patterns as series of connected pixels with arbitrary shapes and lengths.
The minimization of a separable cost such as (2) is a so called minimal path finding problem between two points. The reference algorithm to solve such a problem is the Dijkstra algorithm which has a linear overall complexity as a function of the problem size [32]. Owing to the simplicity of its structure, we have retained this algorithm to minimize (2).
In the particular context of road crack detection, a difficulty is that we do not know in advance the endpoints of the minimal paths to detect. Potentially, a minimal path could be estimated between each pair of pixels of the image, in order to select only
the best ones at a subsequent step. However, the computational time to solve so many minimal paths problems using a Dijkstra type algorithm is clearly out of reach. As a consequence, a strategy must be adopted to reduce the computational time. Two types of solutions have been proposed in the recent literature. Both of them introduce some constraints on the estimation of the paths, as explained below.
C. Computation Strategies for Minimal Paths
1) Introduction of constraints on the optimization
process: Most of the proposed constraints affect the
geometry of the paths: disjointness, ordering, spacing, length, smoothness [27]. With the advantage of being less selective for the endpoints, [21], [33] propose to compute the minimal path from each pixel of the image with a directional constraint (only four orientations are consid-ered) and a fixed distance (typically chosen between 4 and 32 pixels). The main feature of the approach in [21] and [33] is to consider that if one orientation gives different grey level distribution than the other orientations, the pixel is probably inside a crack. Consequently, individual pixels are selected rather than paths, with the drawback that the continuity along the cracks is not necessarily preserved. Moreover, such an approach is not able to detect cracks with fast variations of orientation.
2) Selection of a subset of sources and destinations based on manual selection [23] or automatic selection of points of interest [20]. In the concerned application, a fully automatic process is by far preferable than a manual selection version. Moreover, the latter approach may be too selective, since the detected points of interest do not necessarily cover all the crack, leading to an incomplete segmentation. In [22], the possible endpoints are chosen among the pixels that correspond to local maxima of intensity. Then, minimal paths are computed at the local level without direction or length constraints.
In the following section, a refined version of the strategy proposed in [22] is presented.
III. MINIMALPATHSELECTION FOR
AUTOMATICCRACKDETECTION A. General Algorithm
The proposed method is called Minimal Path Selection (MPS) algorithm. It is mainly based on the principle that mini-mal path within a crack reaches a lower cost function than any other minimal path within the image background. The image is analyzed from a local to a global point of view: at a local level, significant pixels are selected as endpoints and minimal paths between endpoint pairs are computed without neither direction nor length constraints. Then, at a global level, a subset of minimal paths of lowest costs is selected. We suppose that images have no lighting defaults, i.e., halos or a non-uniform lighting are removed by a pre-processing step, if needed. Two post-processing steps are also performed. The first one allows to remove some residual artifacts. Finally, the width of the crack is locally estimated.
Fig. 1. Illustration of the five steps of the MPS method.
Fig. 1 provides an illustration of the successive operations. Let us stress that the three core elements and the two post-processing steps of the method are all based on pixel intensities, which makes MPS a coherent, fully data driven method.
B. Core Steps of MPS
The three core steps of the proposed MPS algorithm are summed up in Fig. 2 and are detailed below.
C1) Endpoint SelectionE: Our goal is to select a significant proportion of the endpoints eiinside the cracks. A first simple
step is to partition the image into small square sub-images and to retain the one darkest pixel mi in each of them. Some
of the candidates are then removed if their intensity is above a threshold of the form Te= µ − keσ, where µ and σ are
the mean and the standard deviation of the whole image. See Section V-A for more details about the choice of the sub-image dimension P and of the coefficient ke.
C2) Minimal Path Estimation pij: Dijkstra algorithm [25]
is used to compute the minimal paths pij between each pair
(ei, ej) of endpoints using (2) for the minimization. Following
the first step of the algorithm, the endpoint eiis surrounded by
eight endpoints ejat most. An important aspect is that by using
this algorithm and the cost defined in (2), there is no constraint on the shape and the length of the paths.
C3) Minimal Paths Selection: Among the many paths se-lected at the previous step, only a small proportion of them are
Fig. 2. Pseudocode of the three core steps of the proposed MPS algorithm.
within (or partially within) a crack. Such paths are expected to be made of pixels of darker intensities than the others, so we use again a threshold on the cost path to select the best candidate paths. Since the goal of this proposed step is to select paths with the lowest mean intensities and not the shortest ones, it is impor-tant to threshold the following normalized version of cost (2):
c(pij) = 1 card(pij) j X m=i I(m) (3)
where card(pij) is the length of the path (in pixels). We have
chosen Tc= µc− kcσc, where µc is the mean and σc is
the standard deviation of the costs (see Section V-A for the choice for kc). As shown in Fig. 1(C3), this step makes the
result converges towards the skeleton of the crack, i.e., a one pixel-wide estimation of the crack with some artifacts.
C. Post-Processing Steps
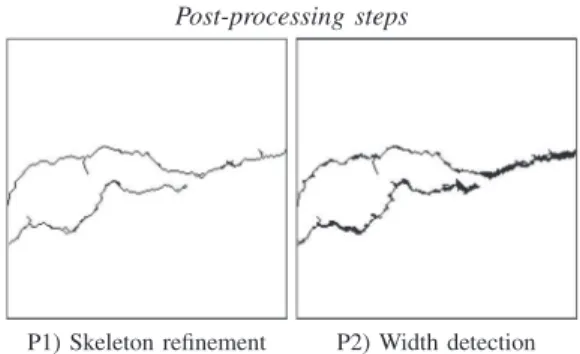
Two kinds of improvements can still be performed, see Fig. 3. On the one hand, some paths or some parts of the paths correspond to false detections. On the other hand, the width of the crack has to be evaluated.
P1) Elimination of Artifacts:Some small isolated paths may be present in the estimated crack, due to the texture of the road. A simple operation is to introduce a new threshold Ts on the
minimal size of a path. The value of Ts can be empirically
tuned, as shown in Section V-A.
Moreover, for some of the paths that constitute the crack skeleton, a frequent situation is that only one endpoint actually belongs to the crack. The resulting path is then partly inside the crack, and partly outside. The outside part forms a spurious “spike.” When several spikes share a common endpoint outside the crack, they form a “loop.” Both spikes and loops correspond
Fig. 3. Pseudocode of the two postprocessing steps.
to false positive pixels and must be eliminated. To do so, we first divide the skeleton into linear segments, such that both extremities of each segment are either a junction point, or an extremity of the crack itself. For example, a crack having the shape of letters A, H and P would be cut into four, five and three segments, respectively. The interest of such a partitioning step is to isolate the spikes and the spurious parts of loops into segments of higher average intensity than that of the “good” segments. A new thresholding operation is then performed on each segment, using the same threshold Tcas in Step C3.
P2) Width Detection: The proposed width detection proce-dure consists in absorbing dark pixels neighboring the currently detected crack, according to a threshold test. The adopted threshold parameter is Tw= µw+ kwσw, where µwand σware
the mean and the standard deviation of the grey levels within the currently detected crack, see Section V-A for the choice for kw.
The aggregation process is performed iteratively, so that several “layers” of dark pixels may be incorporated.
IV. ASSESSMENTPROTOCOL
In Section V, the proposed MPS algorithm will be tested both on a synthetic image, and on five real image databases. The test images are presented in Section IV-A. The performance of five existing methods will be also presented for comparison pur-poses. In real data cases, the definition of objective evaluation criteria is not an easy task. In Section IV-B, we propose a semi-automatic way of generating reference segmentation results, i.e., a pseudo ground truth. Finally, Section IV-C introduces performance indices to evaluate the mismatch between the reference result and the output of any segmentation method.
Fig. 4. Acquisition system used for the acquisition of the 38 images of data set 1: It is based on three sensors, and the processing is done 1 m × 1 m with no overlap.
A. Tested Dataset
The dataset is composed of one simulated image and 269 real images. The synthetic image allows to test the behavior of the MPS algorithm in a fully controlled framework, while real ones allow to evaluate the algorithm in a realistic context.
The simulated image of size 256× 256 pixels contains some artificial crack patterns that have been superimposed to a real image of pavement texture. The simulated cracks have chaotic angular variations, with some ramifications and two thickness values (one and two pixels), as shown on the upper part in Fig. 11. Moreover, the grey level distribution of the pixels within the cracks has been chosen in conformity with the one empirically identified on a real image. In particular, the grey level distributions of the two pixel categories, namely the crack and the background pixels, significantly overlap.
The chosen 269 real images are expected to form a repre-sentative set of samples in terms of pavement texture and of crack patterns, with ramifications at some places and varying thickness along the crack. They can be decomposed in two cat-egories: 68 images with reference segmentations (details about these reference segmentations are given in the next section) and 201 images without reference segmentation. Initially, we collected 62 images from one sensor, the Aigle-RN system pre-sented in Fig. 4, and we computed a reference segmentation for 38 images from this database. Thanks to the Framework Pro-gram for European Research and Technological Development, called TRIMM for Tomorrows Road Infrastructure Monitoring and Management [34], we obtained 207 additional images acquired with four other sensors. It is obviously difficult and expensive to obtain a reference segmentation for quantitative evaluation on such a large dataset. In practice, we generated a reference segmentation for only 30 representative images from these 4 additional databases.
For all the systems tested, the acquisition are made per-pendicular to the road, which means that the optical axis of the sensor is perpendicular to the road. One of these systems, named ESAR, corresponds to a static acquisition (not on a vehicle) with no controlled lighting and the four others are dynamic ones (on a vehicle) with controlled lighting. While the system Aigle-RN uses stroboscopic lights, laser is used by the
TABLE I
PRESENTATION OF THE269 IMAGESTESTED FOREACHSENSOR. THE
NUMBER OFIMAGESWITHPGT ISINDICATEDBETWEENBRACKETS
three remaining ones, namely Tempest 2,1LCMS,2and LRIS.3 More details about the sensors and the tested images are given in Table I.
For the sake of clarity, let us divide the 269 images in three sets:
• Dataset 1 contains the 38 images with reference segmen-tations acquired by Aigle-RN system. These images have been collected at traffic speed for periodically monitoring the French pavement surface condition. They have been pre-processed to mitigate the influence of non-uniform lighting conditions.
• Dataset 2 contains 30 images acquired by the other four systems, with reference segmentations.
• Dataset 3 corresponds to the remaining 201 images with-out reference segmentations. This last dataset allows only visual evaluations and comparisons.
B. Pixel-Based Ground Truth
In the synthetic data case, the ground truth can be defined in an unambiguous manner at the pixel level. The situation is more complex in real data cases. First of all, it is almost impossible to guarantee any ground truth in a realistic context. The best that we can obtain is a reference as reliable as possible. Even a complete manual segmentation is not as reliable as expected [10]. In the latter reference, a pseudo ground truth (PGT) is defined as the fusion of the manual segmentations obtained by four different experts. Here, we rather introduce a semi-automatic segmentation that involves only one human operator whose main role is to select pairs of pixels considered as endpoints of a crack segment. We suppose that manual selection of endpoints is enough reliable. Then, we know that Dijkstra algorithm guarantees the estimation of the minimal path between two points. It can be erroneous only if we have a false minimal path (due to texture) that intersects with the crack, in such a case the wrongly estimated part can be removed manually. According to our own experience, such a semi-automatic procedure is quite fast and reliable. Furthermore, the
1http://yotta.co.uk
2http://www.pavemetrics.com/en/lcms.html 3http://www.pavemetrics.com/en/lris.html
post-processing step P2 is applied to estimate the thickness of the crack and to provide the whole crack pattern.
C. Evaluation Criteria
When comparing segmentation results and the ground truth or the PGT, the following four pixel categories are considered: • true positives (TP) correspond to correct detection of
pixels belonging to the crack structure;
• false positives (FP) are wrongly detected crack pixels (i.e., false alarms);
• false negatives (FN) are crack pixels that have been missed by the detection process;
• true negatives (TN) are background pixels that are cor-rectly labeled by the detection process.
The number of pixels falling in each category is commonly used to quantify the agreement between detection and ground truth. Several indices can be deduced from the four basic figures, among which the following ones are widely used [35]:
• The Precision index highlights the proportion of false alarms
P = TP
TP+ FP.
• The Sensitivity index highlights the proportion of non-detected pixels
S= TP
TP+ FN.
• The DICE Similarity Coefficient (DSC) is the harmonic mean of precision and sensitivity
DSC= 2TP
2TP+ FP + FN. (4)
The DICE coefficient (4) combines the results of the first two criteria and it is commonly used as a global quality measure. It puts emphasize on good detections TP as a function of wrong decisions. Besides, it is especially suited when pixels to be detected are weakly represented, which is the case here. In the case of a perfect detection, we have DSC= 1, while DSC = 0 corresponds to a totally erroneous decision. In practice, it has been argued that a DSC value beyond 0.7 indicates an excellent agreement [36].
Finally, considering that the generation of a faithful PGT remains a difficult task for many real images, we propose to tol-erate a small distance between the detection and the reference segmentation for the calculation of the TP rate. Then, it means that TP pixels are included within a 2 pixel vicinity of the PGT.
D. Comparison of Methods
Very few comparative study between automatic pavement crack detection methods can be found in the literature. One difficulty is that several reference methods are protected com-mercial products, and their description is not publicly available.
Here, we propose a partial comparison involving five existing segmentation methods, that can be grouped into two families.
• Modeling based methods are composed of a photomet-ric criterion (cracks pixels are darker than other pixels) and a local geometric criterion (locally, a crack can be considered as a small segment).
— M1 [37] consists in enhancing the contrast with adap-tive 2D filtering in a multi-scale manner and in four different directions. Then, segmentation is done with a Markovian modeling where manipulated elements (sites) correspond to 3× 3 blocks. Four possible con-figurations are distinguished (four segments in four directions). The segmentation results at all levels are then merged to compute the final result.
— M2 [10] is an improved variant of [37] where more configurations are proposed (sixteen) in order to better cover all the real local configurations of sites in the neighborhood.
• Minimal path methods are closer to the one introduced in this paper. Such methods are based on finding minimal paths between endpoints.
— GC is a Geodesic Contour method [20] with automatic selection of points of interest based on auto-correlation. — FFA, Free Form Anisotropy, method [21], [33] is based on the estimation of minimal paths of a given length, d, at each pixel in four directions. Each current pixel is considered to belong to a crack when the path cost strongly varies with the direction.
— MPS0 [22] is a previous version of the Minimal Path Selection (MPS) method.
For FFA approach, an important parameter corresponds to the maximal length of the minimal paths, d. [33] indicates that “The distance must be higher than granulate size to obtain an efficient filtering. If distance d is high enough, there is no noise detection.” Here, the chosen value d= 30 fulfills this criterion on dataset 1, in the sense that significantly lower values of d introduce wrong detections due to the pavement texture. For the four methods M1, M2, GC, and MPS0 previously introduced, all the parameters used are fixed as recommended in each associated publication.
V. PERFORMANCESTUDY A. Parameter Setting
In practice, the proposed MPS algorithm requires the tuning of five parameters: the size of the image subsets P for local image analysis (Step C1), and the thresholds Te (Step C1),
Tc(Step C2), Ts(Step P1) and Tw(Step P2).
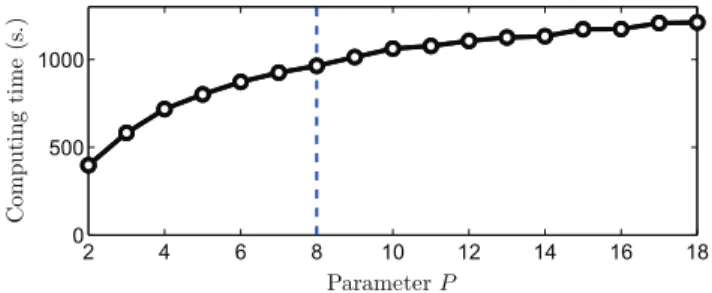
The value of P must not be too large to limit the computation time of the Dijkstra algorithm (since the latter is quickly growing with the distance between endpoints). Fig. 5 shows an example. However, a small value of P can have an influence on the detection performance, as illustrated in Fig. 6. In fact, the choice has an impact essentially on the computing time while the quantitative results remain essentially similar for all the P values. Let us remark that such a choice is not very different to
Fig. 5. Computation time as a function of the value of the window size P , for data set 1.
Fig. 6. Influence of parameter P on the detected paths. For small values of P , such as P = 3, some parts of the cracks become disconnected.
Fig. 7. Percentage of TP among the endpoints as a function of parameter ke
for data sets 1 and 2. For the chosen value of ke= 1, 6% of the endpoints are
removed.
the block size value adopted for other block-based approaches, i.e., between 7 and 9 in [38] and [39].
The choice of ke determines the threshold value Te= µ −
keσ that allows to retain only the darkest endpoints. Smaller
values of kelead to discard only few endpoints, so the following
steps become more computationally demanding. Larger ones eliminate more pixels, with the risk to remove crack pixels (see Fig. 7 for an illustration). In practice, we have found that ke= 1
corresponds to a suited value. However, when this parameter value varies between 0 and 2, the percentage of TP varies only between 3.8 and 4.2. Again, this choice has mostly an impact on the computing time.
Fig. 8. Precision, sensitivity, and DSC value variations with respect to parameter kcfor data sets 1 and 2.
Fig. 9. Precision, sensitivity, and DSC value variations with respect to parameter Tsfor data sets 1 and 2.
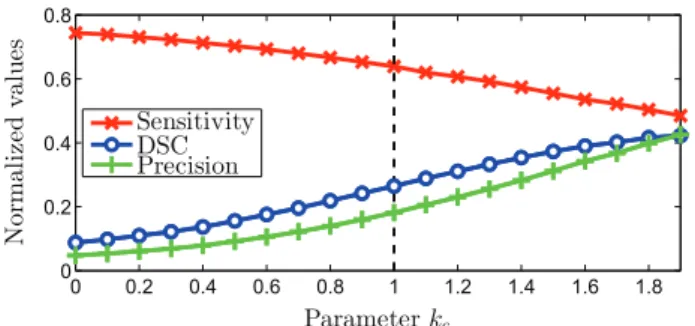
The choice of kc determines the threshold value Tc= µc−
kcσcthat allows to retain only the paths of lowest costs among
the ones found at Step C2. This parameter is a crucial one but its value is quite easy to choose. In fact, the results presented in Fig. 8 highlight that the value of kc corresponds to a trade-off
between precision and sensitivity. Beyond kc = 2, the
sensitiv-ity becomes too low. We have chosen to retain the intermediate value kc= 1, so that both thresholds Teand Tccorrespond to a
unit standard deviation from the corresponding means. As concerns the threshold Ts, Fig. 9 indicates that the value
Ts= 60 empirically corresponds to a good trade-off to improve
the precision without loosing much sensitivity. This parameter is also crucial. We have chosen its value given that road cracks that are lower than 10 cm are usually not considered as significant. Such a choice is coherent for an image resolution of 1 mm per pixel and should be adapted to a different resolution (or to a different goal in term of size of detected cracks).
Finally, the choice of kw determines the threshold value
Tw= µw+ kwσwto merge some dark pixels neighboring the
currently detected crack structure. An appropriate value for kw should increase the sensitivity with a low impact on the
precision. According to Fig. 10, there is no doubt that kw= 0.6
is the best choice, since it corresponds to the maximal value of DSC. We can also notice that for kw> 0.6, the DSC value is
quite stable.
B. Evaluations and Comparisons on Simulated Data
According to Figs. 11 and 12, the results obtained by the two Markov-based methods M1 and M2 are very sensitive to the image texture. The performance of GC strongly depends on the automatic determination of the points of interest. In
Fig. 10. Precision, sensitivity, and DSC value variations with respect to parameter kwfor data sets 1 and 2.
Fig. 11. Segmentation results on a synthetic image for the six methods com-pared to the ground truth.
Fig. 12. Precision, sensitivity, and DSC values for the six different methods applied to the synthetic image in Fig. 11.
this synthetic image, since many points of interest have been detected only on a small part of the cracks, the method produces a high rate of FN. On the contrary, the FFA method detects a continuous crack path. However, the directional and length
Fig. 13. Example of outcome from the six different methods compared to the PGT.
constraints clearly prevent the method from detecting the chaotic crack pattern and the fine structure of the crack. For instance, the direction change is missed at the right hand extremity of the thicker crack. The MPS0 method shows better performance compared to the first three methods. Nonetheless, some loop artifacts limit its performance to 0.75 in terms of DSC value. MPS broadly outperforms the other tested methods, with a DSC value of 0.83. A closer look at the result displayed at Fig. 11 confirms that MPS accurately detects cracks of any form and thickness.
To sum up, GC shows the lowest performance on the tested synthetic image. FFA, M1, and M2 provide intermediate results, and the two MPS methods yield the best overall performance, the new version being superior to the previous one.
C. Performance Comparison on Images From the Real Datasets
Here, the performance of the six methods are evaluated on the images of the real datasets 1 and 2 introduced in Section IV-A. First, an image sample from dataset 1 is used to illustrate some qualitative aspects of the comparison but the results on all the datasets are resumed in Fig. 14.
According to Fig. 13, the Markov-based methods provide discontinuous crack segmentation, owing to the sensitivity to the image texture. M2 also detects a lot of small FP within the image background, including the two dark small patches at the bottom. GC gives the worst performance, because only a small part of the crack has been detected. The FFA method detects a more continuous crack path than M2 and HA. The segmented result appears as a thick line, implying a lot of FP within the vicinity of the crack pattern. At some places, the crack pattern
Fig. 14. Averaged values of precision, sensitivity, and DSC for the 38 real images of data set 1.
Fig. 15. Averaged values of precision, sensitivity, and DSC for the 30 real images of data set 2. This data set is more difficult than the French one because it contains images from different sensors with high variability in the lighting and different problems in the images, such as textures or other defaults that are comparable to cracks and low contrast. The methods M1, M2, and GC are not able to detect the cracks, and their performances are under the performances of HA. Again, the proposed approach obtained the best results for each criterion.
is scattered in small pieces and FN pixels appear. As opposed to the latter, MPS accurately reveals the thin and chaotic structure of the whole crack pattern with reduced artifacts. The overall performance of the six methods on datasets 1 and 2 are shown in Figs. 14 and 15, respectively.
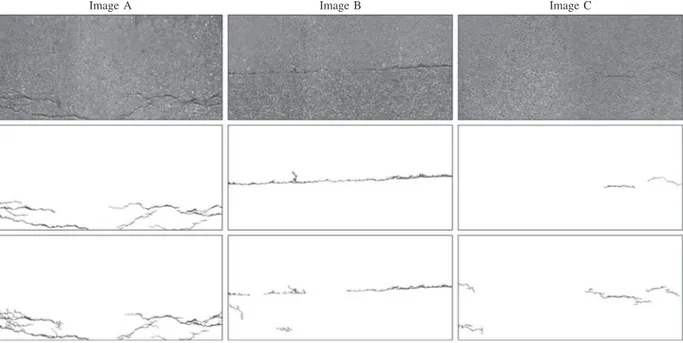
Fig. 16. MPS results on three real images of varying textures. The second and third lines respectively show the PGT and the results obtained by MPS.
For dataset 1, the two Markov-based methods depict sensi-tivity, precision and DSC criteria below 0.5 because of high FP and FN rates. The GC method presents a high precision level, owing to a small amount of FP pixels, but as a counterpart, its sensitivity and DSC values are very low due to the large number of FN. As opposed to the latter, FFA method provides a smaller amount of FN pixels and a larger number of FP pixels in the vicinity of the cracks, which results in a small precision level, a rather high sensitivity, and only a moderate DSC value. The two MPS methods yield by far the best average performance in terms of sensitivity, precision and DSC. Once again, MPS provides a significant improvement over MPS0, meaning that the estimation of thickness has significantly improved the seg-mentation result.
The overall performance on dataset 2 are under the overall performance of the first dataset. However, the same remarks can be done and the MPS approach still gives the best results.
As a conclusion, the average results obtained on the real image datasets confirm the conclusion drawn on the simulated case: MPS is the most accurate method, followed by MPS0, FFA, M1, M2, and GC in descending order of performance.
Another test consists in evaluating the sensitivity of the MPS method to the image texture. The latter may depend on the pavement materials owing to either the size or the color of ag-gregates, on the light scattering over the pavement roughness, or on the wearing of the road surface which modifies the material granularity at some places of the pavement. Here, three different images have been selected within the real datasets, of growing difficulty from Image A to Image C, the latter being the most textured (see Fig. 16). MPS performs well on Images A and B, which is confirmed by a high DSC value (see Fig. 16). In the case of Image C, MPS produces a coherent result, but it corre-sponds to a more continuous crack than the one produced by the expert in the PGT image. This explains why the obtained DSC value is low.
TABLE II
DSC VALUES FOR THESIXDIFFERENTMETHODS
APPLIED TO THETHREEIMAGES INFIG. 16
Table II also gathers the performance of the other five meth-ods on the same three images. For all methmeth-ods, the smallest DSC value is reached for the most textured image, namely Image C, while MPS produces the highest DSC value for the three images.
Finally, the images without a PGT (i.e., dataset 3) have been processed. The results visually confirm that MPS provides far more precise detections than the other methods. The whole set of results are available from the following web page: http:// www.irit.fr/~Sylvie.Chambon/Crack_Detection_Database. html. Some of these results can also be found in [40].
VI. CONCLUSION ANDPERSPECTIVES
Our main contribution is an improved minimal path selection method based on the appropriate selection of minimal paths between endpoints. Compared to our initial version of [22], it incorporates a refined artifact filtering step and enables the estimation of the thickness of the crack pattern. A complete evaluation protocol has been introduced on both synthetic and real images (from five different sensors). The comparison with five existing methods has shown that the proposed method affords the best DSC rate. To our best knowledge, such a kind of precise and complete evaluation is quite new in this context. In the future, it could provide a basis for additional comparisons involving new methods. It can be argued that the assessment protocol provides a bias in favor of the MPS method because
the same algorithm, namely Dijkstra, is used to process the image and to provide the PGT. Indeed, the best performance achieved by MPS on simulated data and the coherency between the MPS results on simulated and real data sets have contributed to remove the latter ambiguity. In conclusion, the proposed method provides very robust and precise results in a wide range of situations, in a fully unsupervised manner, which is beyond the current state-of-the-artifact.
One of our main perspectives will be to reduce the com-putation time of the method by GPU, Graphics Processing Unit, programming, especially at step III-B of the algorithm in Fig. 2. We could also obtain a faster version by replacing the exact Dijkstra algorithm by a suboptimal version in the A∗ family [41]. Finally, 3D imaging systems are of growing use and give the potential to improve crack detection [2]. It is believed that the MPS relies on a versatile principle and thus may cope with the elevation data which is available from these latest imaging technologies.
REFERENCES
[1] M. Ahmed and C. Haas, “The potential of low cost close range photogram-metry towards unified automatic pavement distress surveying,” presented at the Transportation Research Board Meeting, Washington, DC, USA, 2009.
[2] M. Gavilán et al., “Adaptive road crack detection system by pavement classification,” Sensors, vol. 11, pp. 9628–9657, 2011.
[3] H. Oliveira and P. L. Correia, “Automatic road crack detection and charac-terization,” IEEE Trans. Intell. Transp. Syst., vol. 14, no. 1, pp. 155–168, Mar. 2013.
[4] J. J. Acosta, L. Adolfo, and R. L. Mullen, “Low-cost video image process-ing system for evaluatprocess-ing pavement surface distress,” J. Transp. Res.
Board, vol. 1348, pp. 63–72, 1992.
[5] J. Tang and Y. Gu, “Automatic crack detection and segmentation using a hybrid algorithm for road distress analysis,” in Proc. IEEE Int. Conf. Syst.,
Man, Cybern., 2013, pp. 3026–3030.
[6] Y. Hu and C. Zhao, “A local binary pattern based methods for pavement crack detection,” J. Pattern Recognit. Res., vol. 5, no. 1, pp. 140–147, 2010.
[7] N. Otsu, “A threshold selection method from gray-level histograms,”
IEEE Trans. Syst., Man, Cybern., vol. 9, no. 1, pp. 62–66, Jan. 1979. [8] H. Cheng, J. Chen, C. Glazier, and Y. Hu, “Novel approach to pavement
cracking detection based on fuzzy set theory,” J. Comput. Civil Eng., vol. 13, no. 4, pp. 270–280, 1999.
[9] T. Tomikawa, “A study of road crack detection by the meta-genetic algo-rithm,” in Proc. IEEE Africon, 1999, vol. 1, pp. 543–548.
[10] S. Chambon and J.-M. Moliard, “Automatic road pavement assess-ment with image processing: Review and comparison,” Int. J. Geophys., vol. 2011, 2011, Art. no. 989354.
[11] J. Bray, B. Verma, X. Li, and W. He, “A neural network based technique for automatic classification of road cracks,” in Proc. Int. Joint Conf.
Neural Netw., 2006, pp. 907–912.
[12] H. Oliveira and P. L. Correia, “Supervised strategies for cracks detec-tion in images of road pavement flexible surfaces,” in Proc. Eur. Signal
Process. Conf., 2008, pp. 1–5.
[13] A. Cord and S. Chambon, “Automatic road defect detection by textural pattern recognition based on AdaBoost,” Comput.-Aided Civil Infrastruct.
Eng., vol. 27, no. 4, pp. 244–249, 2011.
[14] H. N. Koutsopoulos and A. B. Downey, “Primitive-based classification of pavement cracking images,” J. Transp. Eng. Amer. Soc. Civil Eng., vol. 119, no. 3, pp. 402–418, 1993.
[15] N. Tanaka and K. Uematsu, “A crack detection method in road surface images using morphology,” in Proc. Workshop Mach. Vis. Appl., 1998, pp. 154–157.
[16] N. Coudray, A. Karathanou, and S. Chambon, “Multi-resolution approach for fine structure extraction—Application and validation on road images,” in Proc. Int. Conf. Comput. VISAPP, 2010, pp. 142–147.
[17] P. Subirats, O. Fabre, J. Dumoulin, V. Legeay, and D. Barba, “Automation of pavement surface crack detection with a matched filtering to define the
mother wavelet function used,” in Proc. Eur. Signal Process. Conf., 2006, pp. 1–5.
[18] P. Delagnes and D. Barba, “A Markov random field for rectilinear struc-ture extraction in pavement distress image analysis,” in Proc. Int. Conf.
Image Process., 1995, vol. 1, pp. 446–449.
[19] Q. Zou, Y. Cao, Q. Li, Q. Mao, and S. Wang, “CrackTree: Automatic crack detection from pavement images,” Pattern Recognit. Lett., vol. 33, no. 3, pp. 227–238, 2012.
[20] S. Chambon, “Detection of points of interest for geodesic contours: Application on road images for crack detection,” in Proc. Int. Conf.
Comput. VISAPP, 2011, pp. 1–4.
[21] T. S. Nguyen, S. Begot, F. Duculty, and M. Avila, “Free-form anisotropy: A new method for crack detection on pavement surface images,” in Proc.
Int. Conf. Image Process., 2011, pp. 1069–1072.
[22] R. Amhaz, S. Chambon, J. Idier, and V. Baltazart, “A new minimal path selection algorithm for automatic crack detection on pavement images,” in Proc. Int. Conf. Image Process., 2014, pp. 788–792.
[23] V. Kaul, A. Yezzi, and Y. Tsai, “Detecting curves with unknown endpoints and arbitrary topology using minimal paths,” IEEE Trans. Pattern Anal.
Mach. Intell., vol. 34, no. 10, pp. 1952–1965, Oct. 2012.
[24] J. Mille, S. Bougleux, and L. Cohen, “Minimally overlapping paths sets for closed contour extraction,” in Proc. Int. Conf. Comput. VISAPP, 2012, pp. 259–268.
[25] E. W. Dijkstra, “A note on two problems in connexion with graphs,”
Numerische Mathematik, vol. 1, no. 1, pp. 269–271, 1959.
[26] J. A. Sethian, “A fast marching level set method for monotonically ad-vancing fronts,” in Proc. Nat. Acad. Sci., 1995, pp. 1591–1595. [27] C. Sun and B. Appleton, “Multiple paths extraction in images using a
constrained expanded trellis,” IEEE Trans. Pattern Anal. Mach. Intell., vol. 27, no. 12, pp. 1923–1933, Dec. 2005.
[28] T. Deschamps and L. Cohen, “Fast extraction of minimal paths in 3D images and applications to virtual endoscopy,” in Proc. Med. Image Anal., 2001, pp. 281–299.
[29] L. D. Cohen and R. Kimmel, “Global minimum for active contour models: A minimal path approach,” Int. J. Comput. Vis., vol. 24, no. 1, pp. 57–78, 1996.
[30] P. Yan and A. A. Kassim, “Medical image segmentation using minimal path deformable models with implicit shape priors,” IEEE Trans. Inf.
Technol. Biomed., vol. 10, no. 4, pp. 677–684, Oct. 2006.
[31] M. Kass, A. Witkin, and D. Terzopoulos, “Snakes: Active contour mod-els,” Int. J. Comput. Vis., vol. 1, no. 4, pp. 321–331, 1988.
[32] M. Gondran, M. Minoux, and S. Vajda, Graphs and Algorithms, ser. Discrete Mathematics and Optimization. New York, NY, USA: Wiley, 1984.
[33] M. Avila, S. Begot, F. Duculty, and T. S. Nguyen, “2D image based road pavement crack detection by calculating minimal paths and dynamic programming,” in Proc. Int. Conf. Image Process., 2014, pp. 783–787.
[34] V. Baltazart, J.-M. Moliard, R. Amhaz, L.-M. Cottineau, A. Wright, and M. Jethwa, “Some advances in monitoring road cracks from 2D pave-ment images within the scope of the collaborative FP7 TRIMM project,” presented at the EGU Meeting, Vienna, Austria, 2015.
[35] M. P. Sampat, Z. Wang, S. Gupta, A. C. Bovik, and M. K. Markey, “Complex wavelet structural similarity: A new image similarity in-dex,” IEEE Trans. Image Process., vol. 18, no. 11, pp. 2385–2401, Nov. 2009.
[36] A. P. Zijdenbos, B. M. Dawant, R. A. Margolin, and A. C. Palmer, “Morphometric analysis of white matter lesions in MR images: Method and validation,” IEEE Trans. Med. Imag., vol. 13, no. 4, pp. 716–724, Dec. 1994.
[37] S. Chambon, P. Subirats, and J. Dumoulin, “Introduction of a wavelet transform based on 2D matched filter in a Markov random field for fine structure extraction: Application on road crack detection,” in Proc. SPIE
Image Process., Mach. Vis. Appl. II, 2009, pp. 1–12.
[38] Y. Huang and B. Xu, “Automatic inspection of pavement cracking dis-tress,” J. Electron. Imag., vol. 15, 2006, Art. no. 013017.
[39] Z. Li and X. Zou, “Skeleton detection of crack based on multiscale geo-metric analysis in space domain,” in Proc. Int. Conf. Autom. Control Artif.
Intell., 2012, pp. 1862–1865.
[40] R. Amhaz, Détection de fissures par traitement d’images pour la surveil-lance des chaussées et des ouvrages d’art, Ph.D. thesis, IRCCyN, École Centrale de Nantes, Nantes, France, Mar. 2015.
[41] D. Delling, P. Sanders, D. Schultes, and D. Wagner, “Engineering route planning algorithms,” in Algorithmics of Large and Complex Networks, ser. Lecture Notes in Computer Science, vol. 5515. Berlin, Germany: Springer-Verlag, 2009, pp. 117–139.
Rabih Amhaz received the Ph.D. degree in im-age and signal processing from LUNAM University, Nantes, France, in March 2015, with a dissertation about pavement crack detection on images, which was supported by IFSTTAR.
He was with the Institut de Recherche en Infor-matique de Toulouse (IRIT), INP-ENSEEIHT, Uni-versité de Toulouse, Toulouse, France. His research interest includes crack segmentation using minimal path approach.
Sylvie Chambon received the Ph.D. degree in computer science from the University of Toulouse, Toulouse, France, working on “Colour stereoscopic matching with occlusions.”
From 2006 to 2007, she was a Postdoctoral Re-searcher with Télécom Paris, working on in mul-timodal registration of medical images. From 2008 to 2011, she was a Permanent Researcher with IFSTTAR (the French institute of science and tech-nology for transport, development and networks), working on segmentation of thin structures and, in particular, road cracks. Since September 2011, she has been an Assistant Professor with the Institut de Recherche en Informatique de Toulouse (IRIT), INP-ENSEEIHT, Universit of Toulouse. Her research interest includes match-ing, feature detection and trackmatch-ing, and segmentation of thin structures and urban scenes.
Jérôme Idier was born in France, in 1966. He re-ceived the Diploma degree in electrical engineering from the Ecole Sup’erieure d’Electricité, Gif-sur-Yvette, France, in 1988 and the Ph.D. degree in phys-ics from the University of Paris-Sud, Orsay, France, in 1991.
In 1991, he joined the Centre National de la Recherche Scientifique. He is currently a Senior Re-searcher with the Institut de Recherche en Commu-nications et Cybernétique (IRCCyN), Ecole Centrale de Nantes, Nantes, France. His main research inter-ests are in signal and image processing and more specifically in optimization and inference for inverse problems.
Dr. Idier is currently an elected member of the French National Committee for Scientific Research. He is also a member of the Signal Processing Theory and Methods Technical Committee of the IEEE Signal Processing Society.
Vincent Baltazart received the Ph.D. degree in sig-nal processing from the University of Rennes, France, in 1994.
From 1992 to 1993, he worked on ionospheric modeling and propagation at IPS Radio and Space Services, Sydney, Australia. From 1994 to 1996, he worked on microwave remote-sensing techniques at the Université Catholique de Louvain, Louvain-la-Neuve, Belgium. In 1996, he joined the Labo-ratoire Central des Ponts et Chaussées, France, as a Researcher in the field of optical sensors. He is currently involved in nondestructive testing and evaluation techniques for civil engineering applications at IFSTTAR, Bouguenais, France.