OATAO is an open access repository that collects the work of Toulouse
researchers and makes it freely available over the web where possible
Any correspondence concerning this service should be sent
to the repository administrator:
[email protected]
This is an author’s version published in:
https://oatao.univ-toulouse.fr/27707
To cite this version:
Roggero, Aurélien and Caussé, Nicolas and Dantras, Eric and
Villareal, Laura and Santos, Audrey and Pébère, Nadine In situ
study of the temperature activated kinetics of water sorption in an
epoxy varnish. (2021) Polymer, 213. 123206. ISSN 0032-3861
Open Archive Toulouse Archive Ouverte
Official URL :
In situ study of the temperature activated kinetics of water sorption in an
epoxy varnish
Aur´elien Roggero
a, Nicolas Causs´e
a,*, Eric Dantras
b, Laura Villareal
a,c, Audrey Santos
c,
Nadine P´eb`ere
aaUniversit´e de Toulouse, CIRIMAT-ENSIACET, 4 all´ee Emile Monso, BP44362, 31030, Toulouse Cedex 4, France
bUniversit´e de Toulouse, Physique des Polym`eres CIRIMAT, Universit´e Paul Sabatier, Bˆat. 3R1b2, 118 route de Narbonne, 31062, Toulouse Cedex 9, France cPeintures Maestria, 41 avenue de la Rijole, 09100, Pamiers, France
A R T I C L E I N F O
Keywords: Organic coating Water diffusion Fick′s law
Electrochemical impedance spectroscopy Glass transition
Stretched exponential
Broadband dielectric spectroscopy
A B S T R A C T
The dielectric permittivity of a polyepoxy varnish with a glass transition temperature (Tg) of 61 ◦C is monitored
during immersion in a 0.5 M NaCl aqueous solution, by electrochemical impedance spectroscopy, at various temperatures in the range [21; 78] ◦C. The sorption curves are first analysed with a Fickian approach. An
Arrhenius-type dependence of the apparent coefficient of diffusion is observed, with no visible influence of Tg.
Below 46 ◦C, the sorption curves clearly do not obey Fick′s second law of diffusion. On another hand, the
Kohlrausch-Williams-Watts function (KWW) satisfactorily fits all the isothermal sorption curves. The KWW time constant has the same temperature activation as the apparent coefficient of diffusion, and likewise is unaffected by Tg. The KWW stretching exponent displays a strong dependence on Tg, correlates with the Fickian behaviour
observed in the rubbery state, and is thought to be governed by molecular heterogeneities in the polyepoxy network. A linear rule of mixture is used to estimate the water uptake in the polyepoxy varnish as a function of temperature. The originality of this work lies in the in situ analysis of water uptake kinetics (constant immersion), which is performed above (rubbery state) and below (glassy state) the Tg of the polyepoxy coating.
1. Introduction
When it comes to protecting metal surfaces against corrosion in aggressive environments, polymer-based coatings are the most wide-spread solution. Leaving the inclusion of inhibitive pigments aside, the “barrier effect” is the main protective mechanism of organic coatings: by limiting the diffusion of water, oxygen, and possibly ions through the coating down to the metal substrate. The ability of the coating to maintain a low ionic conductivity over time is generally accepted as the limiting factor of the corrosion initiation (high resistance between anodic and cathodic sites) [1,2] even though this assertion is still debated [3]. Regardless of the actual protective mechanism at the microscopic scale, most failure modes leading to corrosion damage at the macroscopic scale (e.g. blistering [4]) simply do not occur without water uptake first taking place, hence the abundant literature on the subject in the coatings community [5,6].
The diffusion of water (and other species involved in corrosion) through the coating highly depends on the polymer′s physicochemical
structure. These protective coatings often display relatively low glass transition temperatures, Tg, in the vicinity of the ambient temperature.
In humid environments, or in immersion, water uptake has a plasticizing effect which leads to a Tg-depression: typically 10 ◦C [7] to 20 ◦C [8] per
percent of water uptake in polyepoxies. An initially glassy polymer coating may therefore be brought to the rubbery state as a consequence of water uptake, which has great implications on its mechanical (the modulus decreases [9]) and electrical properties (ionic conductivity generally increases [10]). The glass transition may also be expected to influence the diffusion of water molecules in the polymer. A rather widespread conception is that water occupies the free volume in the polymer matrix [11,12]. This idea is debated, in particular by Merdas et al. [13], based on the observation of a unique activation energy of water diffusivity across the glass transition of several polymers, which is in contradiction with the increasing free volume in the rubbery state that suggests different activation energies on both sides of Tg [14]. On
another hand, Halary [15] argues that the sub-Tg β-relaxation, mainly
associated with the mobility of the hydrophilic hydroxyl groups [16], * Corresponding author.
E-mail address: [email protected] (N. Causs´e).
2.3. Broadband dielectric spectroscopy (BDS)
A Novocontrol BDS 4000 impedance analyser was used to perform dielectric measurements (in the temperature range [-150; 150] ◦C and in
the frequency range [5 × 10⁻²; 106] Hz). A gold plated cylindrical
stainless steel electrode (40 mm diameter) was placed on top of a dry polyepoxy varnish sample, in the supported film configuration (the steel substrate acted as the lower electrode). In the complex domain, the applied sinusoidal voltage (1.5 V peak) divided by the measured current yielded the complex impedance, Z∗(ω), of the sample. The material′s
complex dielectric permittivity, ε∗(ω), was then calculated as a function
of temperature and frequency by the WinDeta software, based on Eqs.
(1) and (2). ε∗(ω) =ε′ (ω) − i ε′′(ω) = 1 iωCvZ∗(ω) (1) with Cv= εvA ℓ (2)
where ω=2πf is the angular frequency of the applied voltage, Z∗(ω)
the measured complex impedance of the sample, and Cv the capacitance
of the equivalent vacuum-filled (εv is the vacuum permittivity) parallel
plate capacitor formed by two electrodes of area A (here, the area of the 40 mm top electrode) separated by the distance ℓ (here, the coating
thickness).
In the present work, only the real part of the dielectric permittivity at high frequency (94 kHz) was analysed as a function of temperature (in the range [0; 100] ◦C) and compared to the electrochemical impedance
spectroscopy measurements.
2.4. Electrochemical impedance spectroscopy (EIS)
Impedance measurements were performed on supported polyepoxy varnish films immersed in a 0.5 M NaCl solution (conventional EIS medium and high enough electrical conductivity to have a negligible influence on the total impedance), with a REF600+ impedance analyser manufactured by Gamry Instruments. Similarly to the BDS measure-ments, the coated steel acted as the working electrode while a graphite rod partially immersed in the electrolyte acted as both the counter and reference electrodes (two electrodes configuration). A custom-made double-jacketed glass cell was used to regulate the solution and sam-ple temperature by means of a water flow in the double wall. A stable cell temperature control (±0.5◦C over tens to hundreds of hours) was
achieved by using a Corio CD-200F refrigerated/heating circulator, manufactured by Julabo. A Pt100 probe was used to accurately monitor the solution temperature without interfering in the EIS measurements. Isothermal impedance measurements were performed in the tempera-ture range [21; 78] ◦C, in the frequency range [10; 106] Hz, with a 500
mVRMS perturbation at the open circuit potential. Loops were
pro-grammed within the Gamry software to acquire EIS spectra every 2 min right after filling the cell with the electrolytic solution. Both the reduced frequency range and short open circuit measurement time (30 s) were compromises allowing such closely spaced EIS measurements, required to capture the fast sorption processes (especially right after the immer-sion). The interval between measurements was increased (up to 15 min) when a slowing down of the sorption process was observed. The rela-tively high ac perturbation was motivated by the increased signal-to- noise ratio it provided, especially for the initial high impedance mea-surements (various amplitudes were tested which led to the 500 mV optimum). Moreover, no evidence of corrosion was observed after the various measurements, neither visually nor in the impedance spectra.
A unique system composed of a polyepoxy varnish sample and cell was used throughout the whole EIS study, in order to limit the sources of variability (thickness, application defects, probed area). Prior to each EIS sorption monitoring, the sample and cell assembly were put to dry overnight in an oven set to 65 ◦C. Immediately after taking the sample
governs the diffusion of water molecules in epoxy-based materials, rather than the mobility associated with the glass transition. Perhaps these ideas are not contradictory: as summarized by Soles and Yee [17], “the topology (nanopores), polarity, and molecular motions act in con-cert to control the transport” of water in amine-cured epoxies. They also emphasize the fact that the quantity of unoccupied volume (they call nanopores) accessible to the water molecules is not a rate-limiting factor for the diffusion.
Usually, studies on diffusion in polymers rely on gravimetric mea-surements. When performed at elevated temperatures, especially when it comes to thin coatings (typically less than 100 μm-thick), partial
desorption during the weighing step may become a problem that can be alleviated by using in situ apparatus. In the organic coatings community, electrochemical impedance spectroscopy (EIS) is commonly used to monitor the water uptake [18–21] but rarely at elevated temperatures [22]. This in situ non-destructive technique eliminates the need to periodically remove the sample from immersion.
In the present study, EIS experiments are optimized for the charac-terization of the water sorption kinetics (particularly at short times) in a low Tg polyepoxy varnish, that is an unfilled coating with only the
required constituents to produce a continuous, macroscopic defect-free film. These measurements are performed at various immersion tem-peratures ranging from ambient to 78 ◦C, allowing to study the diffusion
mechanism on both sides of Tg. The main objective of this study is to
analyse the influence of the glass transition and water-induced plasti-cization on the sorption kinetic parameters as determined by EIS mea-surements. A link between the macroscopic sorption and the physical structure at the microscopic scale is sought.
2. Experimental
2.1. Polyepoxy varnish samples
A two-component high-solids polyepoxy varnish was manufactured by Peintures Maestria (Pamiers, France). It consisted of an epoxide as base and a mixture of polyamidoamines as hardener. The liquid varnish was deposited by air spraying onto S235JR steel plates (200 mm × 100 mm × 3 mm). Prior to spraying, the steel plates were sand-blasted to an average roughness of 8 ± 1 μm. After 21 days of cure at 21 ◦C in a
climate-controlled room, the varnish was 182 ± 15 μm thick (measured
by an ultrasonic probe). Freestanding films were also prepared by bar coating deposition onto polypropylene substrates and peeling after cure, with a final thickness of 200 ± 20 μm. To stabilize the physicochemical structure (elimination of residual solvent and completion of residual crosslinking) of both the supported and freestanding samples, a post- curing step was achieved in an oven at 160 ◦C for 30 min.
2.2. Differential scanning calorimetry (DSC)
A Q2000 calorimeter, manufactured by TA Instruments, was used to determine the glass transition temperature of the polyepoxy varnish in both dry and wet states. Small pieces of a freestanding film were cut out to a total mass of approximately 10 mg and put in a standard sealed aluminium pan. A 10 mg-sample was also harvested from a piece of film previously immersed in 0.5 M NaCl at 70 ◦C for 2 h, in order to saturate
the water absorption by the sample and erase the physical ageing. This “wet” sample was sealed in a hermetic Tzero™ pan with 10 μL of water
to limit the sample dehydration inside the pan. For each sample, three temperature ramps were applied (heating, cooling, heating) at 20 K/min under a helium flow. The temperature range for the analysis of the dry sample was [-50; 150] ◦C. For the wet sample, it was limited to [5; 80] ◦C
to prevent water from freezing (below 0 ◦C) and vaporizing (100 ◦C).
The glass transition temperatures were determined at the midpoint of the heat capacity jump in the cooling ramps.
ε′ ( ω ) = − Z(ω) ′′ Cv(Z ′ (ω)2+Z′′(ω)2) (3)
where ε′(ω)is the real part of the complex dielectric permittivity, ω the
angular frequency of the applied voltage, Z′
(ω)and Z′′(ω)the real and
imaginary parts of the measured sample impedance, and Cv the
capac-itance of the equivalent vacuum-filled parallel plate capacitor (see Eq.
(2)) formed by two electrodes of area A (here, the area of the EIS cell = 34.2 cm2) separated by the distance ℓ (here, the coating thickness).
3. Results and discussion
3.1. Magnitude of the water-induced plasticization process
Fig. 1 shows the first cooling DSC ramps of the polyepoxy varnish, in the dry and wet states.
The glass transition temperatures (Tg) are indicated with dotted lines
in Fig. 1. Thanks to the use of a hermetic pan and the addition of a small quantity of distilled water prior to sealing the pan, the hydration level of
the sample is thought to be similar to a complete immersion (as in EIS measurements, in particular). Therefore, the 25 ◦C decrease in T
g
observed between the dry and wet samples represents the maximal measurable water-induced plasticization of the polyepoxy network. The magnitude of this plasticizing effect highly depends on the chemistry of the epoxy-based resin and hardener used, but comparable values of the water-induced Tg-depression have been reported in the literature: 24 ◦C
on an epoxy-based adhesive [23], 10–20 ◦C on various epoxy-based
materials at 2 wt% water uptake [7], 14 ◦C for a DGEBA/DETA
sys-tem at 2.2 wt% water uptake [24], and again 20 ◦C for a polyepoxy
matrix and some silica-filled composites [25].
During the sorption monitoring by EIS measurements, the Tg of the
varnish is expected to vary between 61 ◦C at zero immersion time and
36 ◦C when the sorption reaches the saturation plateau.
3.2. In situ isothermal impedance monitoring
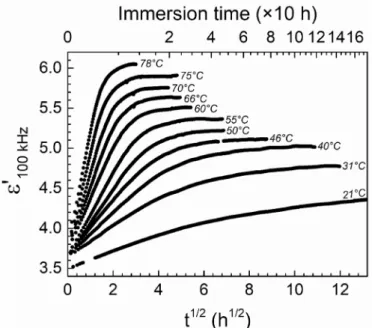
The sorption process is monitored by acquiring closely spaced EIS spectra as soon as the sample is immersed in the 0.5 M NaCl solution. The same protocol is repeated at various temperatures in the range [21; 78]◦C. From each EIS spectrum, the real part of the dielectric
permit-tivity at 105 Hz is calculated and plotted against the square root of
im-mersion time (Fig. 2). This frequency is chosen, based on the analysis of the full spectra [26], to avoid the contribution of the α dielectric
relaxation (frequency range [10−2; 103] Hz, depending on the
temper-ature) and instrument accuracy problems in the 106 Hz range.
Based on the assumption that any substantial variation of the sample′s permittivity during the immersion is mostly caused by the
absorption of water, which has a much higher permittivity (80 at room temperature [27]) than a polymer coating (around 3 in general), the plots of the permittivity as a function of immersion time will be referred to sorption curves. This approach has been described by Bellucci and Nicodemo [28] where Eq. (4) is formulated in terms of the film capac-itance, which equals the permittivity multiplied by the sample geome-try. In other words, this assumption means that an increase in real permittivity (relative to the dry value) is proportional to the mass in-crease due to water uptake one would observe during a gravimetric measurement (as in Eq. (4)). The bulk dielectric measurement averages
Fig. 1. DSC thermograms (cooling ramp, − 20 K/min) of polyepoxy varnish
free-standing film samples: dry (continuous line) and wet (dashed line).
Fig. 2. Isothermal real dielectric permittivity as a function of the square root of
immersion time in the 0.5 M NaCl solution, as measured by EIS. The indicated temperatures correspond to the sample cell temperature, maintained during the measurement. The 21 ◦C experiment was monitored over 450 h to reach a
saturation plateau (not entirely shown for clarity purpose). out of the oven, a rubber film was stretched over the glass cell to limit
the sorption of ambient moisture. The water circulator was then quickly connected to the cell and equilibrated to the desired temperature, while a flask containing 200 mL of 0.5 M NaCl was placed in the circulator bath. After a few minutes, once the NaCl solution reached the desired temperature, it was poured in the EIS cell, marking the start of the im-mersion time axis in the following figures (uncertainty on initial time: 1 s). The graphite electrode and Pt100 probe were, as quickly as possible, immersed and the EIS measurement loop started. Prior solution equili-bration and fast handling allowed to limit the delay between immersion and the first EIS spectrum acquisition to an average of 120 s. A first series of isotherms between 31 and 75 ◦C was acquired sequentially, followed
by the 21 ◦C and finally the 78 ◦C isotherms. The monotonous evolution
observed between 75 and 78 ◦C (the most critical range considering the
fast sorption kinetics at high temperatures) allowed to dismiss any sig-nificant influence of the previous temperature of exposure.
In the present work, the dielectric permittivity formalism was chosen to represent the EIS results. It was preferred to the usual capacitance or impedance formalisms because it is intrinsic (does not depend on the sample geometry) and because the rules of mixtures used to assess the fraction of absorbed water are based on the real part of the dielectric permittivity. The latter was therefore calculated from the complex impedance data by means of Eq. (3), arising from Eq. (1).
Δε′ (t) Δε′ ∞ =ε ′ (t) − ε′ t=0 ε′ ∞− ε ′ t=0 ∝mt(t) m∞ (4)
where t is the immersion time, ε′
t=0 is the permittivity at zero time (dry
state), ε′
∞ is the permittivity value at saturation, mt and m∞ the
analo-gous mass water uptake that would be measured during gravimetric measurements.
The sorption curves in Fig. 2 display a typical Fickian shape with an initial, apparently linear, rise in permittivity before transitioning to a saturation plateau at longer immersion times [6]. The higher the tem-perature is, the quicker a plateau is reached: saturation appears in less than 10 h at 78 ◦C, while around 300 h are needed at 21 ◦C. Thereafter,
two methods are used to analyse these sorption curves. The first one is based on the classical assumption that the sorption process obeys Fick′s
second law of diffusion, and the second one makes use of the stretched exponential, in an attempt to reduce the number of initial assumptions. Both methods are described in the following.
i) Fickian analytical method
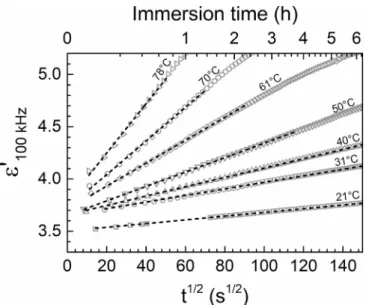
The Fickian analytical method is often encountered in the literature about water uptake in coatings. It consists in assuming a linear depen-dence of the initial sorption process on the square root of immersion time (up to 60% of the total absorption), based on the physical assumption that the flux of diffusing substance is proportional to the gradient in concentration. Fig. 3 is a zoom of the initial permittivity rise in Fig. 2 and features the corresponding linear regressions, performed over 50% of the total permittivity rise.
When extrapolated to t = 0, the linear regressions yield the permittivity of the polyepoxy varnish in the dry state, ε′
t=0, used as a
normalization parameter in Eq. (4). J. Crank [29] formulated analytical solutions to Fick′s second law of diffusion through various geometries.
The relevant one for the present work is the plane sheet exposed to the diffusing solution on one side, initially derived by Daynes [30] (Eq. (5)). It should be noted that a constant (or unique) coefficient of diffusion, DFick, is assumed in Eq. (5). The slope of the linear regression allows
calculating the apparent coefficient of diffusion, DFick, by means of Eq.
(6) [28], which is the short immersion times approximation of Eq. (5) for a supported film. These equations, initially defined for gravimetric water uptake, are adapted to permittivity variations based on the assumption of Eq. (4). Δε′ (t) Δε′ ∞ =1 − 8 π2 ∑∞ n=0 1 (2n + 1)2exp ( − DFick (2n + 1)2π2 (2ℓ)2 t ) (5) Δε′ (t) Δε′ ∞ =2 ℓ ̅̅̅̅̅̅̅̅̅̅ DFick π √ ×√̅̅t when Δε ′ Δε′ ∞ ≲0.6 (6)
where t is the immersion time and ℓ the sample thickness.
The linear regressions are satisfactory (correlation factor > 0.999) for all the isotherms, except the 21 ◦C one, which shows a clear deviation
from linearity when approaching 50% of total permittivity increase (not visible in Fig. 3). In that particular case, and even though the correlation factor is acceptable, the regression is performed up to 33% of the total permittivity increase. The permittivity increase at saturation, Δε′
∞, is
required to determine DFick by means of Eq. (6). An average of the last
values of the sorption curves in Fig. 2 is considered in this method. The fact that a constant plateau is indeed reached represents another assumption. In the present work, the saturation was arbitrarily consid-ered reached when the overnight variation in permittivity was less than 0.1%. The DFick values are reported in the Arrhenius plot of Fig. 9a and
will be discussed in section 3.3.
Knowing the permittivity both at zero time and at saturation allows normalizing (Eq. (5)) the sorption curves as in Fig. 4, in a similar way to the usual gravimetric measurements of water uptake. The normalization emphasizes the influence of temperature on the sorption kinetics, regardless of the initial and final values.
The apparent coefficient of diffusion, DFick, previously obtained from
the linear regressions (Eq. (6)) can be injected in Eq. (5), to determine if the experimental sorption curves obey to it over the entire time range. A representative selection of sorption curves is reported in Fig. 5 along with their corresponding Fick′s law.
Fig. 5 shows that at high temperatures (75 and 61 ◦C), Fick′s law
satisfactorily describes the experimental sorption curves. This holds true down to the 50 ◦C isotherm (not shown in Fig. 5 for clarity purposes).
Below 46 ◦C, as the temperature decreases, the sorption curves gradually
diverge from Fick′s law. While the satisfactorily linear regressions of all
Fig. 3. Linear regressions (dashed lines) of the real dielectric permittivity (grey
symbols) as a function of the square root of immersion time. Fits are performed over 50% of the total permittivity increase (33% at 21 ◦C).
Fig. 4. Real dielectric permittivity variation, normalized to the total variation
(saturation plateau), as a function of the square root of immersion time in the electrolytic solution (0.5 M NaCl).
any water concentration profile that may exist in the sample, which is equivalent to assuming a uniform concentration over the sample′s
the isotherms at short immersion times could suggest a Fickian behav-iour (Fig. 3), the global sorption curves below 46 ◦C indicate otherwise.
This seemingly contradictory observation motivates the second approach, deprived of two assumptions made earlier, namely the initial linear dependence of sorption with respect to the square root of time, and the value of the saturation plateau read from experimental data. ii) Stretched exponential approach
The second analytical method starts with the determination of the real permittivity of the polyepoxy varnish, ε′
t=0, by extrapolation of a
power law of time (Eq. (7)) rather than of a linear regression with a fixed exponent of 0.5 (square root function). To be consistent with the pre-vious linear regressions (Fig. 3), the power law fits, reported in Fig. 6, are performed over the same time ranges.
ε′ (t) =ε′
t=0+A t
n (7)
where A is a constant, t the immersion time and n the power law exponent.
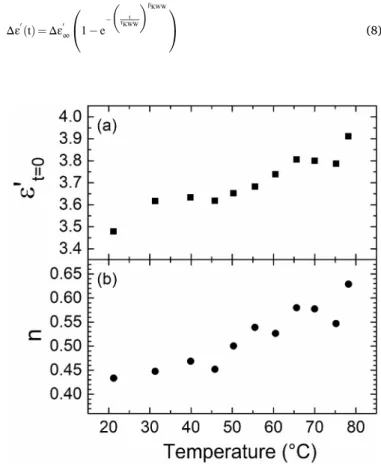
The fitted values of the extrapolated dry permittivities and exponent n are respectively reported as a function of temperature in Fig. 7a and
Fig. 7b.
Fig. 7a indicates that ε′
t=0 is a slightly increasing function of
tem-perature. The drying protocol comes with the expectation of a somewhat constant ε′
t=0, corresponding to the retrieval of the same initial dryness.
The small variation of ε′
t=0 (overall 10%) is not inconsistent with an
identical initial state from the perspective of water content. Tempera-ture also affects properties of the polymer (thermal expansion, dipole polarizability) that can reflect on the value of ε′
t=0. This point will be
more extensively discussed in section 3.4, with the analysis of broad-band dielectric spectroscopy measurements in the dry state.
Fig. 7b shows that the exponent n increases with the temperature and spans over the range [0.43; 0.63]. A 20% deviation from the expected value of 0.5 questions the Fickian assumption made earlier. On another hand, the correlation factor of the power law fits with the exponent n left free are equally as satisfactory (>0.999) as those previously obtained with the linear regressions. Fit quality is therefore not decisive when it comes to determining the actual value of n. Nevertheless, the power law fits (as opposed to the linear regression versus the square root of time) are mainly used, here, to obtain “assumption-free” values of ε′
t=0
(Fig. 7a) for normalization purposes. The increase in permittivity, Δε′
(t) =ε′ (t) − ε′
t=0, is then fitted with
the Kohlrausch-Williams-Watts (KWW) function [31], also known as the stretched exponential (Eq. (8)). This parametric function was used extensively to empirically describe relaxation phenomena associated with the molecular mobility of polymers in the time domain [32]. The underlying idea is that a distribution of relaxation times yields a broadened response (mechanical, dielectric) which departs from the simple exponential decay known as a Debye relaxation.
Δε′(t) = Δε′∞ ⎛ ⎝1 − e− ( t τKWW )βKWW⎞ ⎠ (8)
Fig. 5. Real dielectric permittivity variation normalized to the total variation
(grey symbols) and associated Fick′s law based on the initial slope (black
dashed lines), as a function of the square root of immersion time.
Fig. 6. Power law fits (dashed lines) of the real dielectric permittivity (grey
symbols) as a function of the immersion time, over 50% of the total permittivity increase (33% at 21 ◦C).
Fig. 7. Real permittivity extrapolated at t = 0 (dry state) (a) and exponent n (b)
DFick(T) = DFick,0e − Ea
kB T (9)
where DFick,0 is the pre-exponential factor, Ea the activation energy and kB the Boltzmann constant.The apparent coefficient of diffusion has values in the range [9.2
10−8;2.6 10−6] mm2/s between 21 and 78 ◦C, which is in very good
agreement with a study by De’N`eve and Shanahan [37] reporting values in the range [2.8 10−7;3.6 10−6] mm2/s between 40 and 70 ◦C for a
diglycidyl ether of bisphenol A/dicyandiamide network.
In first approximation, both DFick (Fig. 9a) and τKWW (Fig. 9b) display
an Arrhenius-type dependence over the whole temperature range. Given the uncertainty margins, their activation energies (Table 1) can be considered equal, around 50 kJ/mol (or 0.5 eV). This suggests that both DFick and τKWW reflect the same diffusion process. A very good
agree-ment is found with values from the literature on epoxy-based thermo-sets: 55 kJ/mol with an adhesive immersed in water between 30 and 45 ◦C [38], 54 kJ/mol with a DGEBA/TETA between 23 and 75 ◦C [39],
56 kJ/mol with an adhesive between 19 and 90 ◦C [40], 50 kJ/mol with
a high-Tg glassy polyepoxy between 40 and 60 ◦C [41]. The excellent
agreement with these previous studies, based on gravimetric measure-ments, shows that the temperature-dependent EIS measurements
Fig. 8. Normalized real dielectric permittivity variation (grey symbols) and
associated Kohlrausch-Williams-Watts fits (black dashed lines), as a function of the square root of immersion time.
Fig. 9. Arrhenius plots of the apparent coefficient of diffusion (a), the time
constant (b) and the stretching exponent (c) of the Kohlrausch-Williams-Watts function. The Arrhenius fitted curves appear as dashed lines.
Table 1
Arrhenius activation energy for the sorption kinetic parameters DFick and τKWW. Ea (kJ/mol) Ea (eV)
DFick (mm2/s) 50 ± 2 0.52 ± 0.02
τKWW (s) 54 ± 2 0.56 ± 0.02
where τKWW (s) is the time constant, and βKWW ∈]0; 1] is the stretching
exponent.
The stretching exponent of the KWW function, βKWW, quantifies the
wideness of the distribution, while the time constant, τKWW, is the mean
relaxation time of the distribution. Today spectroscopic techniques (mechanical and dielectric) have mostly replaced static measurements in the time domain, and equivalent functions can be used in the fre-quency domain, such as the Havriliak-Negami equation [33]. By analogy with the analysis of polymer relaxations, using the KWW function to empirically account for a distribution of diffusion processes may make sense. For instance, Shen and Springer [34] found that a stretched exponential with a stretching exponent of 0.75 approximated well the Fickian sorption case, and Zeng and Xu [35] resorted to the stretched exponential to model water vapour sorption in porous cement-based materials.
Contrary to the first method, based on the Fickian hypothesis, the increase in permittivity at saturation, Δε′∞, can be left as a free
param-eter in the fitting procedure. This eliminates the assumption made earlier when reading the value on the supposed saturation plateau. The sorption curves normalized to the new sets of parameters {ε′
t=0; Δε
′
∞}T,
respectively obtained from power law extrapolations at short times (Fig. 7) and KWW fits of Δε′(t) (not shown), are reported in Fig. 8. The
corresponding KWW fits are also plotted as dotted lines.
As shown in Fig. 8, the KWW function satisfactorily fits the sorption isotherms over the entire temperature range. As opposed to Fick′s laws
(Fig. 5), there is no degradation of the fit quality below 46 ◦C. The very
short immersion times (below 20–30% of the total permittivity increase) is the only region where the KWW function slightly diverges from the experimental data. However, this is not considered problematic here because the aim is to describe the overall sorption kinetics.
3.3. Analysis of the sorption kinetics parameters
The apparent coefficient of diffusion, DFick, and the KWW
parame-ters, τKWW and βKWW, are displayed in Fig. 9 as a function of reciprocal
temperature to emphasize Arrhenius-type dependences, which appear linear in this representation. Diffusion processes indeed are often re-ported to obey an Arrhenius equation (Eq. (9)) [5,36].
Linde et al. [42] studied a series of polyepoxy materials based on a DGEBA resin with various hardeners and found that the activation en-ergy of the water diffusivity between 20 and 200 ◦C lied in the range [44;
62] kJ/mol. In the same article, the authors showed that only one out of the six systems studied showed different activation energies on both sides of Tg. In the present work, the diffusion process similarly seems
mostly unaffected by the glass transition of the polyepoxy network (indicated with grey vertical dotted lines in Fig. 9): the Arrhenius dependence is monotonous over the entire temperature range. This behaviour may be explained from the point of view of Merdas et al. [13] who assimilate the activation energy of diffusivity (in various polymers, including epoxy-based ones) to the formation/dissociation of hydrogen bonds between water molecules and hydrophilic (polar) sites on the polymer chain. In epoxy-based networks, the hydroxyl, amine and amide groups are likely to be the preferred sites of interaction with water molecules [17,43]. Under the assumption that the hydrogen bonding to polar sites of the polymer backbone governs the diffusion of water molecules, the impact of the main chain mobility at the glass transition on the free volume should not play a major role in the diffu-sion process, which would explain the monotonous temperature dependence of the coefficient of diffusion on both sides of Tg.
Fig. 9c shows that the stretching KWW exponent, βKWW, has a non-
monotonous dependence on temperature: it transitions from an increasing function of temperature below 55 ◦C to a constant value
above (unexplained deviation for 78 ◦C point). This more or less
cor-responds to the temperature above which the Fick′s law starts to
satis-factorily describe the sorption curves (Fig. 5), suggesting an underlying correlation of the two equations. In order to evidence this correlation, all of the Fick′s laws plotted in Fig. 5 are fitted with the KWW function. The
obtained stretching exponent, βFick
KWW =0.79 ± 0.01, is temperature
in-dependent and seems to be intrinsic to Fick′s law (at least in the present
study) and is in very good agreement with the value of 0.75 reported by Shen and Springer as a general approximation to Fick′s law applied to a
plane sheet [34]. A grey rectangle, labelled “Fickian zone” and corre-sponding to the value βKWW takes in the Fickian case, is displayed in
Fig. 9c. Above 55 ◦C, the plateau reached by the experimental β KWW
points matches the “Fickian zone”, which confirms the visual evidence that the sorption process becomes Fickian. As 55 ◦C is reasonably close
to the dry Tg of the polyepoxy network (Fig. 1), βKWW seems to convey
the influence of the molecular mobility. In the literature, it is often stated that the water sorption by polymers is Fickian in the rubbery state, and that deviations from Fick′s law mainly occur in the glassy state
[6]. Moreover, βKWW provides a quantification of the deviation from
Fickian diffusion: as βKWW decreases, Fick′s law less and less accurately
describes the sorption curves.
While βKWW is not directly associated with a distribution of relaxation
times, as it is the case when the KWW function is used to analyse mo-lecular mobility modes, the argument that some kind of distribution is present with regards to the diffusion of water molecules in the polymer network is sensible: a distribution of diffusion coefficients for instance. The temperature dependence of βKWW could reflect an evolution of the
diffusion medium occurring during the sorption process, as a result of the plasticization process. If the test temperature is higher than the dry Tg, the polyepoxy varnish stays in the rubbery state over the whole
sorption experiment. If the test temperature is lower than the dry Tg, the
polymer is in the glassy state at the start of the experiment and plasti-cization occurs as soon as water molecules enter the network, possibly leading to the occurrence of the glass transition during the experiment (especially for temperatures between 36 and 61 ◦C, the wet and dry T
g,
respectively). From the perspective of a water molecule diffusing in the polymer, the diffusion paths are more heterogeneous in the partially plasticized glassy polymer than in the continually rubbery one. It is striking to note that these heterogeneities reflected by low values of
βKWW do not influence the mean diffusional process, reflected by τKWW or
DFick which both display the same activation energy. The discussion
about the heterogeneity of the diffusion medium could meet with the concept of D and I areas defined by Mayne, which could be associated with low and high cross-linked regions of thermoset coatings [1]. Mainly D areas are thought to be involved in the initiation of under film corrosion, as they constitute preferential ionic pathways to the substrate [2]. There could be a link between the heterogeneity in cross-linking density and a distribution in diffusion coefficients in the glassy state, which becomes less significant in the rubbery state.
3.4. Assessment of absorbed water volume fraction
The fact that water uptake is responsible for the permittivity increase (Fig. 2) is a recurring assumption in the previous two sections. This section focuses on quantifying the water uptake by means of a rule of mixture between the real dielectric permittivity of the dry polyepoxy varnish and that of water. A simple linear 2-phase rule of mixtures [19,
44] is applied to the high-frequency EIS data (105 Hz) to calculate the water volume fraction at saturation, Φv
H2O(t), as in Eqs. (10) and (11). This linear rule of mixture is chosen on the basis of various studies reporting its better agreement with gravimetric measurements [19,44,
45] when compared to the more widely used Brasher-Kingsbury equa-tion [18]. ε′ ∞(T) = ΦvH2O(T)ε ′ H2O(T) + Φ v dry varnish(T)ε ′ t=0(T) (10) ⇔ Φv H2O(T) = ε′ ∞(T) − ε ′ t=0(T) ε′ H2O(T) − ε ′ t=0(T) (11) where Φv
H2O(T) and Φvdry varnish(T) = 1 − ΦvH2O(T) are the volume frac-tions of water and dry varnish at the temperature T, ε′
H2O(T) and ε ′
t=0(T)
their respective real permittivity and ε′
∞(T) the sample′s real
permit-tivity at saturation.
The real permittivity of water is usually considered to be a constant, close to 80 [46], but this holds at 20 ◦C only. It is indeed a decreasing
function of the temperature, as thermal motions hinder the polariz-ability of a dipolar substance (except when a relaxation mode is reached). Malmberg and Maryott [27] reported accurate measurements of the real dielectric permittivity of liquid water as a function of tem-perature in the range [0; 100] ◦C and fitted the experimental data with a
third degree polynomial (Eq. (12)).
ε′H2O(T) = 87.740 − 0.400 T + 9.39810
−4T2− 1.41010−6T3 (12)
The application of Eq. (12) shows that in the temperature range [21; 78] ◦C of the present study, the dielectric permittivity of liquid water is
in the range [80; 61], which represents a significant 24% decrease be-tween 21 and 78 ◦C that needs to be taken into account when estimating
the water uptake. Eq. (11) was applied to all the isotherms in Fig. 2 with the ε′
t=0(T) values obtained from the power law extrapolations (Fig. 6)
and ε′
∞(T) values yielded by the KWW fits (Fig. 8). The water volume
fraction absorbed at saturation by the polyepoxy network is plotted as a function of temperature in Fig. 10 (□ symbols).
The water volume fraction at saturation increases from 1.3% at 21 ◦C
up to 3.7% at 78 ◦C, which is a credible order of magnitude for a
pol-yepoxy. However, the linear rule of mixture (Eq. (11)) does not account for any dimension changes as the temperatures increases (thermal expansion, swelling) that are to be expected, but difficult to dissociate from one another. An experimental correction of any temperature- induced permittivity contribution, except the swelling, which is ex-pected to be in the same order of magnitude than the thickness uncer-tainty (typically less than 10% [23]), is proposed. It consists in comparing the temperature dependence of the permittivity at saturation (obtained by EIS) with actual measurements in the dry state, by broadband dielectric spectroscopy (BDS). Fig. 11 features BDS developed in the present work can satisfactorily be used to monitor
measurements of the real permittivity of the polyepoxy varnish at high-frequency, as a function of temperature in the range [0; 105] ◦C.
Two seemingly linear dependences (dashed lines) of the permittivity with respect to the temperature are observed below and above 62 ◦C
(dotted line), with a factor of 4.6 between the two slopes. This behaviour closely resembles the shape of thermomechanical measurements in the glass transition region of polymers, which evidence thermal expansion coefficients several times higher in the rubbery state than in the glassy state. If this thermal effect on the BDS permittivity actually originates from dimensional changes, it is expected to occur during EIS measure-ments as well. By considering 21 ◦C as the reference point, this
normalized increase (BDS) is subtracted to the relative increase in ε′
∞(T)
(EIS, at saturation), as in Eq. (13). This yields the permittivity at water saturation corrected to the thermal effect also observed in the dry state,
therefore not linked to water uptake. ε′ ∞,corrected(T) =ε ′ ∞(21 ◦ C) × ( 1 + [( ε′ ∞(T) ε′ ∞(21◦C) ) EIS − ( ε′ (T) ε′ (21◦C) ) BDS ]) (13) The corrected permittivity values at saturation are reported in Fig. 12
(● symbols), along with the uncorrected values (□ symbols). To be consistent, the same correction has to be made to ε′
t=0(T) (not
shown) before calculating the corrected water volume fraction with Eq.
(11). The obtained water fraction values are displayed in Fig. 10 (● symbols). Accounting for the supposedly dimensional thermal effect observed in Fig. 11 only reduces the water volume fraction by 8% at most (at 78 ◦C). Such a low impact can probably be explained by the fact
that the subtraction in the numerator of Eq. (11), ε′
∞(T) − ε
′
t=0(T),
already cancels the majority of any contribution common to the dry and wet states.
However, if different dimensional changes occur in the wet and dry states, they do not cancel each other anymore. In particular, this would be true in the case of swelling, but also as a result of plasticization: the Tg-depression at saturation (61–36 ◦C) can be expected to accordingly
shift the thermal effect observed in the dry state (Fig. 11) towards lower temperatures. This idea is the basis of the second correction of the water volume fraction reported in Fig. 10 (▴ symbols). In order to assess the effect of plasticization on the water uptake values, a correction can be generated by horizontally shifting the curve in Fig. 11 by 25 ◦C towards
the low temperatures and applying Eq. (13) in the same way as the first correction (the ε′
t=0(T) are still corrected to the unmodified BDS values
of Fig. 11, because the polymer is in the dry state). This new correction, which makes physical sense in spite of the crude assumption made when simply shifting the BDS curve horizontally, has much more impact on the calculated values of the water volume fraction at saturation. A 33% decrease compared to the uncorrected values is observed at 78 ◦C.
Perhaps more importantly, a tendency to reach a plateau is now visible in Fig. 10 (▴ symbols) when the uncorrected and first corrected water fractions seemed to keep increasing at a constant rate with increasing temperature (□ and ● symbols).
The considerations about dimension changes and plasticization illustrate the complexity hidden behind simple rules of mixture like Eq.
(11)or the Brasher-Kingsbury equation. They are based on debatable (sometimes clearly incorrect) assumptions. For instance, taking 80 as the
Fig. 10. Water volume fraction in the polymer at saturation as a function of
temperature, calculated by means of the linear rule of mixture (Eq. (11)) with: uncorrected values of both ε′
∞ and ε
′
t=0 (□), their correction by the BDS
mea-surements (●) and the additional correction of ε′
∞ taking into account the
plasticization effect (▴).
Fig. 11. Real dielectric permittivity of the dry polyepoxy varnish as a function
of temperature, measured by broadband dielectric spectroscopy at 94 kHz. The dashed lines correspond to linear fits and the dotted line indicates their inter-section at 62 ◦C, which is very close to the calorimetric dry T
g.
Fig. 12. Uncorrected real permittivity as extracted from the water saturation
plateaus of EIS measurements (□), its correction by the BDS measurements (●) and an additional correction taking into account the plasticization effect in the form of a − 25 ◦C shift of the BDS data (▴), as a function of temperature.
4. Conclusions
In this study, EIS was used to monitor the increase in the high- frequency real permittivity of a polyepoxy coating as a result of water uptake. These experiments were reproduced at various temperatures in the range [21; 78] ◦C so as to evidence the thermal dependence of the
diffusion mechanisms and to assess the influence of the molecular mobility associated with the glass transition.
A traditional analysis based on the short-time approximation of the analytical solution to Fick′s second law of diffusion allowed the
deter-mination of the apparent coefficient of diffusion of water in the coating. An Arrhenius-type activation (of roughly 50 kJ/mol) was found for this diffusion process, in good agreement with existing literature. Below 46 ◦C, Fick′s second law of diffusion failed at describing the whole
sorption curves. The stretched exponential (Kohlrausch-Williams-Watts function), on another hand, successfully fitted the sorption curves in the entire temperature range, providing a mean time constant and a stretching exponent both associated with the diffusion kinetics. The time constant seemingly evidenced the same Arrhenius-type activation as the apparent diffusion coefficient, which suggest that the initial sorption somewhat encompasses the whole diffusion process kinetics. The stretching exponent reflects a notion of distribution, probably related to diffusion paths. It displayed a strong dependence on the glass transition of the coating, contrary to the average time constant and the apparent coefficient of diffusion: an increasing function of the temperature leading, at the dry Tg, to a plateau value corresponding to a Fickian
behaviour. This influence of the molecular mobility at Tg was explained
by the water-induced modification of the diffusion medium during the sorption experiment. Above the dry Tg, plasticization did not
signifi-cantly alter the diffusion medium (polymer is in the rubbery state at all times), while below the dry Tg, the plasticization of the initially glassy
polymer resulted in an inhomogeneous distribution of diffusion paths responsible for the low values of the stretching exponent.
Sensible values (below 4%) for the absorbed water volume fraction were estimated by means of a simple linear rule of mixture. Corrections based on a dimensional change evidenced by dry BDS measurements were attempted, also taking into account the influence of plasticization. These corrections led to a decrease of the water uptake at saturation, and plasticization was shown to have the greater impact on the value (up to 33% decrease compared to the uncorrected value).
This study showed that temperature-controlled EIS measurements can replace the widespread gravimetric measurements when it comes to analysing the temperature dependence of the sorption kinetics in poly-mer coatings, which allows establishing behaviour laws and analysing the influence of the molecular mobility on diffusional processes. The partial desorption problem encountered when taking samples out of immersion to weigh them is alleviated by the in situ character of EIS. In particular, the very short delays between acquisitions in the order of a minute allow accurate monitoring of the fast initial sorption processes. Clearly this experimental method is suitable for the analysis of a wide range of polymer materials destined to be used in immersion (bio-polymers for instance). However, when a precise determination of the
water uptake is required, gravimetric measurements should be per-formed due to the uncertainty inherent to the rules of mixture. Declaration of competing interest
The authors declare that they have no known competing financial interests or personal relationships that could have appeared to influence the work reported in this paper.
References
[1] J.E.O. Mayne, in: L. Shreir, R.A. Jarman, G.T. Burstein (Eds.), The Mechanism of the Protective Action of Paints, third ed.Corrosion, Butterworth-Heinemann, Oxford, 1994 https://doi.org/10.1016/B978-0-08-052351-4.50110-2, 14:22-14: 38.
[2] S.B. Lyon, R. Bingham, D.J. Mills, Advances in corrosion protection by organic coatings: what we know and what we would like to know, Prog. Org. Coating 102 (2017) 2–7, https://doi.org/10.1016/J.PORGCOAT.2016.04.030.
[3] J.M. Sykes, E.P. Whyte, X. Yu, Z. Sharer Sahir, Does “coating resistance” control corrosion? Prog. Org. Coating 102 (2017) 82–87, https://doi.org/10.1016/j.
porgcoat.2016.04.015.
[4] W. Funke, Blistering of paint films and filiform corrosion, Prog. Org. Coating 9 (1981) 29–46, https://doi.org/10.1016/0033-0655(81)80014-3.
[5] D.Y. Perera, P. Selier, Water transport in organic coatings, Prog. Org. Coating 1
(1973) 57–80.
[6] G.K. Van Der Wel, O.C.G. Adan, Moisture in organic coatings - a review, Prog. Org. Coating 37 (1999) 1–14, https://doi.org/10.1016/S0300-9440(99)00058-2. [7] T.S. Ellis, F.E. Karasz, Interaction of epoxy resins with water: the depression of
glass transition temperature, Polymer 25 (1984) 664–669, https://doi.org/
10.1016/0032-3861(84)90034-X.
[8] W.W. Wright, The effect of diffusion of water into epoxy resins and their carbon- fibre reinforced composites, Composites 12 (1981) 201–205, https://doi.org/
10.1016/0010-4361(81)90505-X.
[9] J.L. Halary, F. Lauprˆetre, L. Monnerie, 3. The glass transition, in: Polym. Mater.
Macrosc. Prop. Mol. Interpret, first ed., John Wiley & Sons, Inc., Hoboken, NJ,
USA, 2011, pp. 41–58.
[10] B. Roling, 10. Mechanisms of ion transport in amorphous and nanostructured
materials, in: S. Baranovski (Ed.), Charg. Transp. Disord. Solids with Appl.
Electron., first ed., John Wiley & Sons, Ltd, Chichester, 2006, pp. 379–401.
[11] J.L. Duda, J.M. Zielinski, 3. Free-volume theory, in: P. Neogi (Ed.), Diffus. Polym.,
first ed., Marcel Dekker, Inc., New-York, 1996, pp. 143–171.
[12] P. Johncock, G.F. Tudgey, Some effects of structure, composition and cure on the water absorption and glass transition temperature of amine-cured epoxies, Br. Polym. J. 18 (1986) 292–302, https://doi.org/10.1002/pi.4980180504. [13] I. Merdas, F. Thominette, A. Tcharkhtchi, J. Verdu, Factors governing water
absorption by composite matrices, Compos. Sci. Technol. 62 (2002) 487–492,
https://doi.org/10.1016/S0266-3538(01)00138-5.
[14] D. Turnbull, M.H. Cohen, Free-volume model of the amorphous phase: glass transition, J. Chem. Phys. 34 (1961) 120, https://doi.org/10.1063/1.1731549.
[15] J.L. Halary, Structure-property relationships in epoxy-amine networks of well-
controlled architecture, High Perform. Polym. 12 (2000) 141–153.
[16] L. Heux, J.L. Halary, F. Lauprˆetre, L. Monnerie, Dynamic mechanical and 13C n.m. r. investigations of molecular motions involved in the β relaxation of epoxy networks based on DGEBA and aliphatic amines, Polymer 38 (1997) 1767–1778,
https://doi.org/10.1016/S0032-3861(96)00694-5.
[17] C.L. Soles, A.F. Yee, A discussion of the molecular mechanisms of moisture transport in epoxy resins, J. Polym. Sci., Part B: Polym. Phys. 38 (2000) 792–802,
https://doi.org/10.1002/(SICI)1099-0488(20000301)38:5<792::AID-
POLB16>3.0.CO;2-H.
[18] D.M. Brasher, A.H. Kingsbury, Electrical measurements in the study of immersed paint coatings on metal. I. Comparison between capacitance and gravimetric methods of estimating water-uptake, J. Appl. Chem. 4 (1954) 62–72, https://doi.
org/10.1002/jctb.5010040202.
[19] A.S. Castela, A.M. Simoes, An impedance model for the estimation of water absorption in organic coatings. Part I: a linear dielectric mixture equation, Corrosion Sci. 45 (2003) 1631–1646, https://doi.org/10.1016/S0010-938X(03)
00014-3.
[20] E.P.M. van Westing, G.M. Ferrari, J.H.W. de Wit, The determination of coating performance with impedance measurements - II. Water uptake of coatings, Corrosion Sci. 36 (1994) 957–977, https://doi.org/10.1016/0010-938X(94)
90197-X.
[21] L.V.S. Philippe, S.B. Lyon, C. Sammon, J. Yarwood, Validation of electrochemical impedance measurements for water sorption into epoxy coatings using gravimetry and infrared spectroscopy, Corrosion Sci. 50 (2008) 887–896, https://doi.org/
10.1016/j.corsci.2007.09.008.
[22] J. Li, C.S. Jeffcoate, G.P. Bierwagen, D.J. Mills, D.E. Tallman, Thermal transition effects and electrochemical properties in organic coatings: Part 1 — initial studies on corrosion protective organic coatings, Corrosion 54 (1998) 763–771, https://
doi.org/10.5006/1.3284797.
[23] M.Y.M. Chiang, M. Fernandez-Garcia, Relation of swelling and Tg depression to the apparent free volume of a particle-filled, epoxy-based adhesive, J. Appl. Polym. Sci. 87 (2003) 1436–1444, https://doi.org/10.1002/app.11576.
permittivity of water at room temperature implies that water is in the liquid form and that it does not interact with the polymer, which is in contradiction with the plasticization phenomenon, precisely caused by water molecules bonding to the polymer chain. Plasticization, which can change the state of the polymer from glassy to rubbery during a sorption experiment, is another intrinsic limitation of the rules of mixture: they simply cannot account for this complexity. The correction attempts made earlier show that small variations of permittivity are magnified by the rule of mixture. The multiple sources of error on the permittivity values (extrapolations at zero time, value on the plateau, plasticization effect, dimension change by thermal expansion and swelling) dictate caution when using rules of mixture to obtain more than a rough esti-mate of the water uptake.
[24] P. Peyser, W.D. Bascom, The anomalous lowering of the glass transition of an epoxy resin by plasticization with water, J. Mater. Sci. 16 (1981) 75–83, https://
doi.org/10.1007/BF00552061.
[25] C. Zou, J.C. Fothergill, S.W. Rowe, The effect of water absorption on the dielectric properties of epoxy nanocomposites, IEEE Trans. Dielectr. Electr. Insul. 15 (2008) 106–117, https://doi.org/10.1109/T-DEI.2008.4446741.
[26] A. Roggero, N. Causs´e, E. Dantras, L. Villareal, A. Santos, N. P´eb`ere, Thermal activation of impedance measurements on an epoxy coating for the corrosion protection: 2. Electrochemical impedance spectroscopy study, Electrochim. Acta 305 (2019) 116–124, https://doi.org/10.1016/j.electacta.2019.03.007. [27] C.G. Malmberg, A.A. Maryott, Dielectric constant of water from 0 to 100 C, J. Res.
Natl. Bur. Stand. (1956) (1934) 56, https://doi.org/10.6028/jres.056.001, 1. [28] F. Bellucci, L. Nicodemo, Water transport in organic coatings, Corrosion 49 (1993)
235–247, https://doi.org/10.5006/1.3316044.
[29] J. Crank, Chapter 4 - diffusion in a plane sheet. The Mathematics of Diffusion,
second ed., Oxford University Press, London, 1975, pp. 44–68.
[30] H.A. Daynes, The process of diffusion through a rubber membrane, Proc. Roy. Soc. Lond. A. 97 (1920) 286–307, https://doi.org/10.1098/rspa.1920.0034. [31] G. Williams, D.C. Watts, Non-symmetrical dielectric relaxation behaviour arising
from a simple empirical decay function, Trans. Faraday Soc. 66 (1970) 80, https://
doi.org/10.1039/tf9706600080.
[32] A. Sch¨onhals, F. Kremer, 1 theory of dielectric relaxation, in: F. Kremer, A. Sch¨onhals (Eds.), Broadband Dielectr. Spectrosc, Springer-Verlag, Berlin, 2003, pp. 1–33, https://doi.org/10.1007/978-3-642-56120-7_1.
[33] S. Havriliak, S. Negami, A complex plane analysis of α-dispersions in some polymer systems, J. Polym. Sci. Part C Polym. Symp. 14 (1966) 99–117, https://doi.org/
10.1002/polc.5070140111.
[34] C.H. Shen, G.S. Springer, Moisture absorption and desorption of composite materials, J. Compos. Mater. 10 (1976) 2–20, https://doi.org/10.1177/
002199837601000101.
[35] Q. Zeng, S. Xu, A two-parameter stretched exponential function for dynamic water vapor sorption of cement-based porous materials, Mater. Struct. Constr. 50 (2017) 1–13, https://doi.org/10.1617/s11527-017-0997-7.
[36] C.E. Rogers, Permeation of gases and vapours in polymers, in: J. Comyn (Ed.), Polym. Permeability, Springer Netherlands, Dordrecht, 1985, pp. 11–73, https://
doi.org/10.1007/978-94-009-4858-7_2.
[37] B. De’N`eve, M.E.R. Shanahan, Water absorption by an epoxy resin and its effect on the mechanical properties and infra-red spectra, Polymer 34 (1993) 5099–5105,
https://doi.org/10.1016/0032-3861(93)90254-8.
[38] M. Fern´andez-García, M.Y.M. Chiang, Effect of hygrothermal aging history on sorption process, swelling, and glass transition temperature in a particle-filled epoxy-based adhesive, J. Appl. Polym. Sci. 84 (2002) 1581–1591, https://doi.org/
10.1002/app.10447.
[39] A. Apicella, L. Nicolais, G. Astarita, E. Drioli, Effect of thermal history on water sorption, elastic properties and the glass transition of epoxy resins, Polymer 20 (1979) 1143–1148, https://doi.org/10.1016/0032-3861(79)90307-0.
[40] S. Popineau, C. Rondeau-Mouro, C. Sulpice-Gaillet, M.E.R. Shanahan, Free/bound water absorption in an epoxy adhesive, Polymer 46 (2005) 10733–10740, https://
doi.org/10.1016/j.polymer.2005.09.008.
[41] J.A. Barrie, P.S. Sagoo, P. Johncock, The sorption and diffusion of water in epoxy resins, J. Membr. Sci. 18 (1984) 197–210, https://doi.org/10.1016/S0376-7388
(00)85034-6.
[42] E. Linde, N.H. Giron, M.C. Celina, Water diffusion with temperature enabling predictions for sorption and transport behavior in thermoset materials, Polymer 153 (2018) 653–667, https://doi.org/10.1016/j.polymer.2018.08.024. [43] E. Morel, V. Bellenger, J. Verdu, Structure-water absorption relationships for
amine-cured epoxy resins, Polymer 26 (1985) 1719–1724, https://doi.org/
10.1016/0032-3861(85)90292-7.
[44] A.S. Nguyen, N. Causse, M. Musiani, M.E. Orazem, N. P´eb`ere, B. Tribollet, V. Vivier, Determination of water uptake in organic coatings deposited on 2024 aluminium alloy: comparison between impedance measurements and gravimetry, Prog. Org. Coating 112 (2017) 93–100, https://doi.org/10.1016/j.
porgcoat.2017.07.004.
[45] A. Roggero, L. Villareal, N. Causs´e, A. Santos, N. P´eb`ere, Correlation between the physical structure of an epoxy paint and its electrochemical impedance response, Prog. Org. Coating 146 (2020), 105729, https://doi.org/10.1016/j.
porgcoat.2020.105729.
[46] U. Kaatze, V. Uhlendorf, The dielectric properties of water at microwave frequencies, Zeitschrift Fur Phys. Chemie. 126 (1981) 151–165, https://doi.org/