THE DISSOCIATIVE IONIZATION OF METHYL FLUORIDE. THE
FORMATION OF CH
2+AND CH
3+R. LOCHT and J. MOMIGNY
Département de Chimie Générale et de Chimie Physique, Université de Liège, Institut de Chimie, Sart-Tilman par B-4000 Liège 1 (Belgium)
ABSTRACT
The decay of ionized CH3F was investigated in the CH2+ and CH3+ dissociation channels by electro-ionization
and fixed-wavelength photo-ionization using the He(I) and Ne(I) resonance lines. The translational energy spectra, ionization efficiency curves and kinetic energy vs. appearance energy diagrams of both ions were measured. Although dissociative autoionization is the prominent dissociation mechanism for the appearance of CH2
+
and CH3 +
, direct dissociative ionization is observed for CH2 +
at 23.4 eV and for CH3 +
at 16.5 eV.
INTRODUCTION
Although the ionization and fragmentation of methyl halides CH3X (X = Cl, Br, I) have been studied by
many methods, much less attention has been paid to methyl fluoride.
Tsuda et al. [1] and Dibeler and Reese [2] studied the dissociative electroionization of CH3F. In both
papers, only the CH3+ dissociation channel has been investigated. However, the latter work evidenced the
appearance of "thermal" energy and "kinetic" energy CH3 +
ions for which the onset energies were measured at (i) 12.7 ± 0.5 eV and 14.7 ± 0.3 eV and (ii) 16.5 ± 0.5 eV, respectively.
Krauss et al. [3] reported a mass spectrometric photo-ionization study of the dissociation of CH3F, and
measured onset energies for the CH3+ and CH2F+ fragment ions. For the former ion, surprisingly, no
photo-ionization cross-section was measured between 14.7 and 16.5 eV.
Eland et al. [4] studied the CH3F +
ion dissociation by photoelectron- photoion coincidence using the He(I) resonance line at 584 Å. The CH2F
+
and CH3 +
dissociation channels have been considered. Mainly "kinetic energy" CH3+ ions were measured in coincidence with the CH3F+(2A1 +2E) states. This result appears to agree
with those of the resonant photo-ionization experiment [3].
The most recent high resolution He(I) photoelectron spectrum of methyl fluoride has been published by Karlsson et al. [5] and Bieri et al. [6] measured the He(II) photoelectron spectrum of the same molecule.
One aim of this paper is to elucidate the origin of the discrepancy between electro-ionization and photo-ionization concerning the CH3+ ion production from CH3F in the 14.5-16.5 eV energy range. Since no data are
available, to our knowledge, concerning the CH2 +
ion from CH3F, the study of the appearance of this fragment
ion is included in this work.
EXPERIMENTAL
The dissociative ionization of methyl fluoride was investigated by both electro-ionization and by fixed-wavelength photo-ionization, using He(I) (21.22 eV) and Ne(I) (16.67-16.85 eV) resonance lines.
The experimental arrangement used in the electro-ionization study has been described in detail earlier [7] and only the prominent features will be repeated here. The ions produced in a Nier-type ion source by the impact of energy-controlled electrons, are focused on the exit hole, energy-analyzed by a retarding lens and mass-selected in a quadrupole mass filter. The ion current, collected on a 17-stage Cu-Be electron multiplier, is continuously scanned as a function of either the electron energy at fixed retarding potential VR or the retarding
potential at fixed electron energy Ee. Both signals are electronically differentiated, averaged in a multichannel
analyzer which is interfaced with a Tracor Northern TN-4000 minicomputer. The data are stored on floppy disks for further handling and recording.
The newly built set-up used in the fixed-wavelength photo-ionization experiment will be described elsewhere [8]. The main features only will be mentioned here. The light, produced by a discharge in properly chosen rare gases, is led into an ion chamber through a capillary. The photo-ions are extracted by a 0-500 mV draw-out field. After leaving the ion source and before entering a quadrupole mass spectrometer, the ions are energy-analyzed by means of a retarding lens, identical to that used in the electro-ionization experiment. The retarding potential VR is scanned by applying a voltage ramp to the retarding lens. The first derivative of the
retarding potential curve of Ar+ ions, obtained numerically, has a FWHM of about 80 meV.
The photoelectrons, flying in the opposite direction to the photo-ions, are energy-selected in a retarding potential-type electron energy analyzer with a differential output [9]. The resolution in the photoelectron spectrum of Ar was limited to 40-50 meV.
Both ions and electrons are detected with Cu-Be electron multipliers followed by counting electronics. Both signals are collected and stored in a minicomputer.
In both experiments, the vacuum chamber is baked-out at about 300 °C and the residual gas pressure is typically of about 2 X 10 -8 Torr. Special care is taken to lower the N+ ion background when the CH2+ ion is
investigated.
The methyl fluoride gas of 97% purity was purchased from Air Products. This gas was dessicated and distilled under vacuum. The purity of the sample used is checked by mass spectrometry. The sample is introduced at about 10-7 Torr in the electro-ionization experiment and at 10-5 Torr in the photo-ionization experiment.
The maximum of the CH3F +
ion energy distribution is used as the zero energy calibration point for the ion translational energy scale. The same reference is used during the recording of the electro-ionization efficiency curves of the fragment ions at different retarding potential settings.
For the photoelectron energy scale calibration, Ar and Kr are used. The standards for the ionizing electrons energy scale calibration are the ionization energies of He (24.587 eV) [10], Ne (21.564 eV) [10], Ar (15.759 eV) [10] and/or CH3F (12.533 eV) [5]. Several calibration points were used to check the linearity of the
electron energy scale as well as the appearance of spurious structures. Indeed it is noticed that contact potentials as high as 2.0 V have been measured. Frequent filament replacement was necessary.
All the first derivatives of the electro-ionization efficiency curves presented in this work are repeated at least five times independently for CH3
+
and up to ten times for CH2 +
, this ion being of low intensity in the energy range of the onset up to 20 eV. The energies quoted in the following sections are averaged values and the errors are given by the standard deviation. In the kinetic energy vs. appearance energy diagrams, linear regressions are fitted to the experimental data.
RESULTS
The CH3 +
ion
The ion energy distribution spectra of CH3 +
.
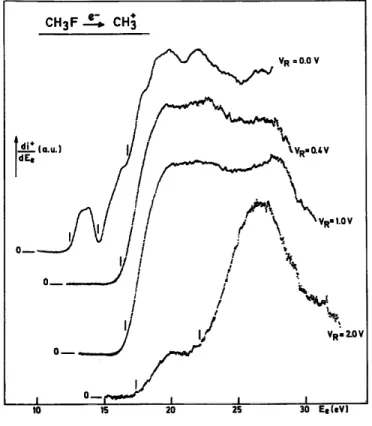
Typical recordings of the first derivative of the retarding potential curves of CH3+ at different electron
energies are presented in Fig. 1. In the energy range of 12.5-14.5 eV, only "thermal" CH3 +
ions are observed. From 17 to 50 eV electron energy, a second translational energy component is present in the distribution, corresponding to energetic CH3+ ions. The position of the maximum of the high energy peak is measured at 0.81
± 0.01 eV and remains constant for increasing electron energies. The broad distribution energy spread is only slightly dependent upon the electron energy, i.e. it extends up to 1.6 eV for 17 eV electrons and to ~ 2.0 eV at 50 eV electron energy.
The ionization efficiency curves of CH3 +
.
A set of first differentiated ionization efficiency curves of CH3+, as. recorded for a few retarding
potential settings, are displayed in Fig. 2.
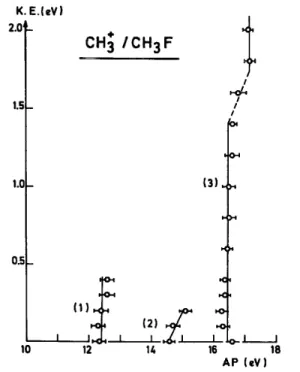
Different onsets are measured (located by vertical bars in Fig. 2) and plotted vs. the CH3 +
Fig. 1. First differentiated retarding potential curves of the CH3+ ion at the electron energies indicated.
Fig. 2. First differentiated ionization efficiency curves of CH3 +
Fig. 3. Kinetic energy vs. appearance energy diagram for CH3 +
.
translational energy. The result is shown in Fig. 3. Three main appearance energies are evidenced, i.e. at 12.3 ± 0.2 eV, 14.6 ± 0.2 eV and 16.4 ± 0.3 eV. Furthermore, two broad maxima are observed at about ~ 20 and 22.5 eV.
The CH2 +
ion
The ion energy distribution spectra of CH2 +
.
First differentiated retarding potential curves of the CH2 +
ion current were recorded for 14-50 eV electron energy. Typical curves are shown in Fig. 4 for 14-30 eV electrons.
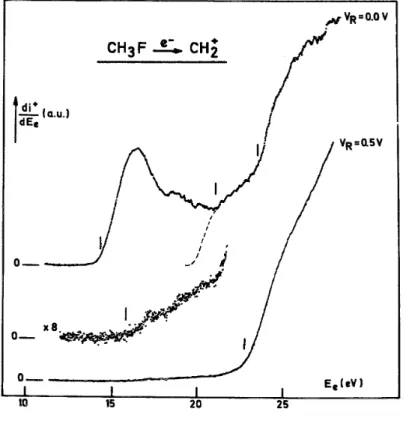
Fig. 5. First differentiated ionization efficiency curves of CH2+ at the retarding potential settings indicated.
Fig. 6. Kinetic energy vs. appearance energy diagram for CH2 +
.
In the explored electron energy range, mainly "thermal" CH2 +
ions are observed. From 25 eV, energetic CH2
+
ions contribute to the translational energy distribution whose high-energy tail extends up to 2 eV. The lack of any discrete structure in the CH2
+
ion energy distribution evidences the absence of N+ ion contributions from the background [11].
The ionization efficiency curves of CH2 +
.
The first differentiated ionization efficiency curves of CH2 +
, as observed for retarding potential settings VR = 0.0 and 0.5 V are shown in Fig. 5. The onset energies are located by vertical bars. Two well-defined onsets
Between these two thresholds, the first derivative shows a minimum and a singular point has been determined at 21.4 ± 0.2 eV. Its meaning will be discussed in the following section.
The onset energy measurements for different retarding potential values, i.e. VR = 0-0.5 eV, are plotted
in a kinetic energy vs. appearance energy diagram which is shown in Fig. 6.
DISCUSSION
The CH3 +
dissociation channel
The first onset energy for the CH3 +
ions is measured at 12.3 ± 0.2 eV. This value is lower than, but, within experimental error, agrees with the appearance energy given by Dibeler and Reese [2], i.e. 12.7 ± 0.5 eV. Tsuda et al. [1] published a RPD ionization efficiency curve of CH3+ and determined an onset energy at 12.6 eV.
Two lower thresholds were reported by these authors at 10.8 and 11.9 eV. No evidence for lower energetic processes are found in the present first differentiated ionization efficiency curve of CH3
+
(see Fig. 2). By mass spectrometric photo-ionization [3], the lowest threshold measured at 12.56 eV for CH3
+
is higher than the present electro-ionization value.
Using the data listed in Table 1, the thermodynamically lowest onsets for the CH3 +
ion formation from CH3F are calculated at 11.2 ± 0.3 eV for the ion pair process
(1)
and at 14.60 ± 0.3 eV for the dissociative ionization process
(2)
The first measured appearance energy can be interpreted only by the occurrence of the ion pair process (1). This is confirmed by (i) the observation of a peak in the first differentiated electro-ionization cross-section of CH3
+
, and (ii) the close agreement between the threshold energies of CH3 +
and F- as measured by photo-ionization [3]. Both ions show the same structures in the same photon energy range of 12.5-14.6 eV.
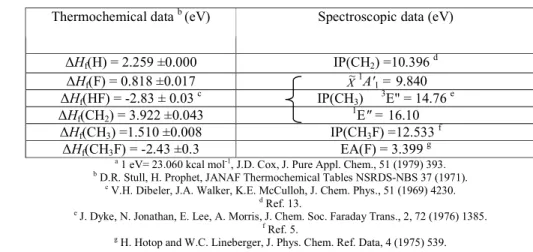
TABLE 1. Thermodynamical and spectroscopic data used in this work a
Thermochemical data b (eV) Spectroscopic data (eV)
∆Hf(H) = 2.259 ±0.000 IP(CH2) =10.396 d ∆Hf(F) = 0.818 ±0.017 X~ 1 A'1 = 9.840 ∆Hf(HF) = -2.83 ± 0.03 c IP(CH3) 3 E" = 14.76 e ∆Hf(CH2) = 3.922 ±0.043 1 E" = 16.10 ∆Hf(CH3) =1.510 ±0.008 IP(CH3F) =12.533 f ∆Hf(CH3F) = -2.43 ±0.3 EA(F) = 3.399 g a
1 eV= 23.060 kcal mol-1
, J.D. Cox, J. Pure Appl. Chem., 51 (1979) 393. b
D.R. Stull, H. Prophet, JANAF Thermochemical Tables NSRDS-NBS 37 (1971). c
V.H. Dibeler, J.A. Walker, K.E. McCulloh, J. Chem. Phys., 51 (1969) 4230. d
Ref. 13. e
J. Dyke, N. Jonathan, E. Lee, A. Morris, J. Chem. Soc. Faraday Trans., 2, 72 (1976) 1385. f
Ref. 5. g
H. Hotop and W.C. Lineberger, J. Phys. Chem. Ref. Data, 4 (1975) 539.
The total excess energy between measured and thermodynamic onsets for process (1), i.e. about 1.1 eV, has to be ascribed to the internal energy of CH3+ and the translational energy carried by both CH3+ and F
-fragments. Electronic excitation of one or both species can be ruled out (see Table 1).
The kinetic energy distribution of CH3 +
observed in the energy range where the ion pair process occurs, shows only thermal and nearly thermal ions (see Fig. 1). The kinetic energy vs. appearance energy diagram relative to this process [Fig. 3, curve (1)], is given by a vertical line extending from 0 to 0.4 eV translational
energy, i.e. the CH3+ threshold energy is independent of its translational energy.
This observation could only be interpreted in two ways. Firstly the CH3 +
ion is produced at threshold with at least 0.4 eV kinetic energy. However, this has to be discarded, the CH3
+
ions showing a kinetic energy distribution of 0-0.4 eV. More likely, the CH3+ ion formation proceeds via a mechanism by which the total
excess energy of 1.1 eV is partitioned into internal and translational energy. By this means, the total kinetic energy involved in process (1) and the internal energy carried by the fragments are distributed in the ranges 0-0.7 eV and 1.1-0.4 eV, respectively.
The second threshold energy measured in the ionization efficiency curve of CH3 +
, is located at 14.6 ± 0.2 eV. This value has to be compared to earlier electro-ionization values of 14.7 ± 0.3 eV [2] and 14.5 eV [1]. This process has not yet been observed by mass spectrometric photo-ionization [3] nor by the photoelectron/photo-ion coincidence experiment [4].
The kinetic energy vs. appearance energy diagram related to this process is given by a straight line curve (2) in Fig. 3 extending over only 0-0.2 eV kinetic energy range. This observation is confirmed by the narrow translational energy distribution observed at 14.5 eV electron energy.
The good agreement between the thermochemical onset of 14.6 ± 0.3 eV and the experimental appearance energy, allows one to ascribe the 14.6 ± 0.2 eV threshold to the dissociation
in agreement with earlier investigations [1,2]. Furthermore, neither translational energy nor internal energy are carried by the fragments at threshold. Above the onset, the excess energy is entirely converted into at most 0.2 X 34/19 = 0.36 eV total translational energy.
The absence of this process in resonant photo-ionization [3] and in photo-electron/photo-ion coincidence experiments [4] would indicate that the transition to the dissociative ionization continuum is strongly forbidden for photon impact.
The absence of this process has been checked by recording the CH3+ photo-ions translational energy
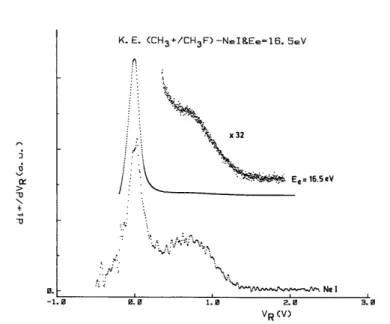
distribution with the He(I) and Ne(I) resonance lines in non-coincidence conditions. The results are shown in Figs. 7 and 8, together with those obtained by electron impact at comparable energies.
In the distributions obtained by both methods, two translational energy components are observed: a "thermal" energy peak and a broad distribution with a maximum at 0.81 eV. The latter distribution corresponds to that observed in photo-electron/photo-ion coincidence experiments. The ratio of the peak areas of thermal CH3
+
and energetic CH3 +
is about 1:1 in the fixed-wavelength photo-ionization experiment. Consequently, the thermal energy peak is a new and a relatively intense contribution which has to be ascribed to CH3
+
photo-ions produced with an appreciable cross-section. A priori, two processes could contribute to the thermal ion peak: (1) the ion pair process and (ii) the process observed at 14.6 eV by electro-ionization.
The ion pair process (1) at 12.3 eV is a resonant process by photo-ioniza-tion and its cross-section at 16.67-16.85 eV [Ne(I)] or 21.22 eV [He(I)] is zero. A contribution of this process to the thermal peak has to be ruled out. Consequently, only the process observed at 14.6 eV will contribute to the thermal CH3
+
ions. As underlined earlier, this process has not been observed by resonant photo-ionization [3] and no coincidences have been measured between thermal CH3+ photo-ions and photo-electrons [4].
In the He(I) photo-electron spectrum of CH3F [5] the first X~ 2
E band shows a very well-developed vibrational structure in the range 12.5-14.5 eV. A second structureless band starts at ~ 16.3 eV. In the photo-ionization efficiency curve of CH3F+ [3], recorded with the He continuum, no auto-ionization structure is visible
in the range 14.5-16.3 eV.
However, the observation of thermal CH3 +
ions in the present experiment is obvious. The CH3F
photo-ionization cross-section, using the He(I) resonance Une, is nearly zero at 14.5 eV in the photo-electron spectrum [5] and no photo-electron/photo-ion coincidence could be observed. Furthermore, it is generally accepted that at 21.22 eV autoionization phenomena are excluded. However, the only argument which could be invoked to explain simultaneously the presence of thermal CH3
+
photo-electron/photo-ion coincidence, is the existence of dissociative autoionization induced both by the He(I) and Ne(I) resonance lines. By such a process, the population of the CH3
+
+ F dissociation continuum at 14.5 eV occurs through radiationless transition and autoionization from resonantly excited neutral CH3F states. The
remaining question is the lack of any CH3+ signal in the photo-ionization efficiency curve of CH3+ in the range
14.6-16.25 eV.
Fig. 7. Comparison of the first differentiated retarding potential curves of the CH3 +
ion as obtained by the He(I) resonance line and 20 eV electrons.
Fig. 8. Comparison of the first differentiated retarding potential curves of the CH3 +
ion as obtained by the Ne(I) resonance line and 16.5 eV electrons.
In work which is still in progress [12], the photo-ionization and dissociation of CH3F has been
reinvestigated using synchrotron radiation. The CH3 +
photo-ionization efficiency curve recorded in the range 12-25 eV photon energy unambiguously shows the existence of the process with an appearance energy at 14.65 eV.
Furthermore, in the CH3F+ photo-ionization efficiency curve several broad peaks are observed, very probably
related to dissociative autoionization continua. The absence of any CH3 +
ion signal at 14.5-16.5 eV in the photo-ionization efficiency curve, as published by Krauss et al. [3], is very probably related to the lack of detection sensitivity or to the intensity of the light source in this energy range.
The third appearance energy of the CH3+ ions is measured at 16.4 ± 0.3 eV, in good agreement with the
electro-ionization value of Dibeler and Krauss [2]. Tsuda et al. [1] do not mention any onset above 14.5 eV. By mass spectrometric photo-ionization, a threshold is measured at 16.25 eV [3].
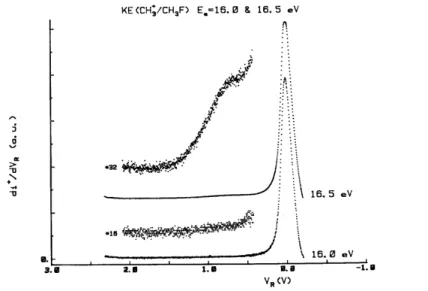
A careful examination of the CH3 +
ion energy distribution as a function of the electron energy shows that the appearance energy of the high energy component of this distribution lies in the range 16.0-16.5 eV, as shown in Fig. 9.
The distribution observed at 16.5 eV has a maximum at 0.8 eV and is spread up to ~ 1.4 eV. The onset energy corresponds to the adiabatic ionization energy of the second ( 2A1 +
2
E) structureless band observed in the CH3F photo-electron spectrum [5]. Eland et al. [4] observed photo-electron coincidences at this energy
with photo-ions "formed with a kinetic energy release of up to 2 eV in the centre of mass (CM), a release of up to 90% of the available energy in the form of translation".
Fig. 9. First differentiated retarding potential curves of CH3 +
at 16.0 and 16.5 eV electron energy.
As shown in Figs. 7 and 8, the translational energy distributions observed with the He(I) resonance line and 20 eV electrons spread up to 1.8 eV, while it extends to 1.4 eV with Ne(I) radiation and 16.5 eV electrons. Consequently, a broadening of only 0.4 eV is observed for an energy increase of 3.4 eV. Altogether, the present experimental results show that most of the translational energy distribution of CH3+ is produced as soon as the
energy of the ionizing particles reaches the CH3F ( 2A1 + 2E) states.
Furthermore, the kinetic energy vs. appearance energy diagram related to this process is shown by a vertical line [curve (3) in Fig. 3]. Such a dependence of the translational energy on the electron energy has to be ascribed to the excess energy partition between internal energy and translational energy.
The only mechanism which could give rise to CH3+ ions at 16.4 eV is (see Table 1)
where the excess energy of about 2 eV with respect to the thermodynamical onset is shared between translational energy of the fragments F and CH3
+
and internal energy υ of CH3 +
. For nearly zero kinetic energy, the internal energy carried by the CH3
+
The break-off observed in the range 16.4-17.1 eV in curve (3) of Fig. 3 could be interpreted by the contribution of a new electronic state of CH3F
+
, e.g. the 2E state.
Two broad and smoothed maxima at about 19.5 and 22.5 eV are observed in the retarding potential range of 0-1.8 eV, at a fairly constant position in energy. This kind of structure is indicative for autoionization. The autoioniz-ing states found at these energies are probably members of Rydberg states converging to the fourth valence-shell ionization limit at 23.5 eV, observed in the He(II) photo-electron spectrum of CH3F [6].
The CH2 +
dissociation channel
The lowest threshold observed in the first differentiated ionization efficiency curve of CH2 +
is measured at 14.3 ± 0.1 eV. A maximum in the ionization cross-section is observed at 16.3 ± 0.1 eV. The CH2+ kinetic
energy distribution, as recorded at these energies, only shows thermal and quasi-thermal ions (see Fig. 4).
The lowest thermodynamical threshold for the production of CH2 +
ions from CH3F is calculated at 13.9
± 0.4 eV for the process
(3)
which is close to the measured onset. As shown in Table 1, the value IP(CH2) = 10.396 eV [13] is used. This
value is an upper limit [13], since the ground state of CH2 +
has been shown to be bent [14].
By measuring the onset energy at different retarding potential settings in the range 0-0.5 eV, the straight line curve (1') in Fig. 6 is obtained. Three lines are drawn, starting from 14.3 eV: (a) the straight line with theoretical slope 19/34, (b) the straight line, neglecting the onset measurement at VR = 0.2 V, with a slope of
0.34, and (c) the straight line accounting for the five threshold energy measurements, with an initial slope 0.16.
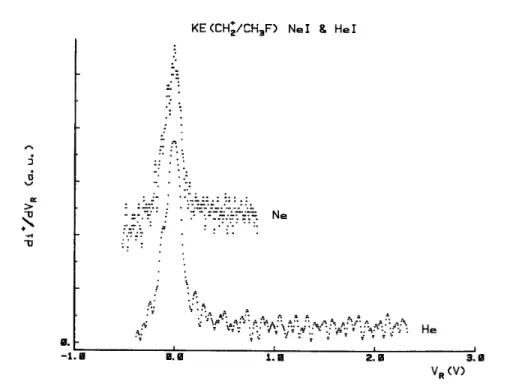
Fig. 10. First differentiated retarding potential curves of CH2 +
obtained by He(I) and Ne(I) resonance lines.
By measuring the position of the maximum at 16.3 eV for different retarding potential settings, the straight Une curve (1') in Fig. 6 is obtained with a slope of 0.17. This maximum disappears for VR = 0.3V, where
a discontinuity is observed in curve (1). This maximum in the first differentiated electro-ionization cross-section would indicate that the CH2
+
ions, with an onset at 14.3 eV, are produced by dissociative autoionization. This observation would be an additional argument for the dissociative autoionization mechanism proposed for the
CH3+ ion formation at about the same energy, i.e. 14.6 eV.
The initial slope (c) of 0.16, instead of 0.56 = 19/34, shows that the excess energy, with respect to the dissociation limit, is converted into internal energy to an extent of 70%, whereas the second slope (b) of 0.34, above the discontinuity indicates that 60% of the excess energy is converted into translational energy.
CH2+ photo-ions were also observed in the mass spectrum of CH3F recorded with Ne(I) and He(I)
resonance lines. Although of low intensity, the kinetic energy spectra of this ion have been recorded and are shown in Fig. 10. Only thermal and nearly thermal ions are observed.
As for the CH3 +
ions with an onset at 14.6 eV, the CH2 +
ions have not been observed in photo-ion/photo-electron coincidence [4]. The explanation of the lack of coincidences for CH2+ ions would be the same
as for the thermal CH3 +
ions: the dissociative autoionization gives rise to both ions.
However, the direct dissociative ionization mechanism could not be entirely discarded on the basis of these arguments. Indeed, the ionization cross-section of the CH3F
+
(X~2E) state is very low near 14 eV and the
CH2 +
ion abundance is small. The photo-ion/photo-electron coincidence signal is expected to be of very low intensity.
Between the thresholds at 14.3 and 23.4 eV, the first differentiated electro-ionization efficiency curve of CH2
+
shows a broad and smoothed maximum around 18-19 eV and a minimum at 21.4 ± 0.2 eV. This latter critical point was measured at different retarding potential settings, and shown in Fig. 6 by a straight line, curve (2), with a slope of 0.5. This value, compared to the expected slope of 0.56, is indicative of total excess energy conversion into kinetic energy. The portion of the ionization efficiency curve, starting at 21.4 eV, could be considered as the tail of a curve related to a process with a lower-lying onset. This is suggested in Fig. 6 by a dashed curve.
On the basis of the data listed in Table 1, the onset of the ion pair process
(4)
will be located at 16.4 ± 0.3 eV and for the dissociative ionization process
(5)
would have its onset at 19.8 ± 0.3 eV.
It is fairly likely to assign the minimum at 21.4 eV to process (5), although the appearance of CH2+ in a
vibronic excited state cannot be ruled out. Bender and Schaeffer, III, [14] calculated a CH2+( 2B1) state at ~
0.13 eV above the ground state. If one considers the isoelectronic BH2 species, the first excited state is found at ~
0.6 eV above the ground state [13]. The dissociative ionization process (5) occurs in an electron energy range where no ionization cross-section is found in the He(II) photo-electron spectrum of CH3F [6], and only
autoionization gives rise to CH2+ ions. The same phenomenon has been invoked for the CH3+ ion production in
the same energy range.
The onset supposed to be at 19.8 eV and corresponding to process (5) is not resolved because of low-lying CH2
+
ion contributions. The above-mentioned ion pair process (4) could certainly not be discarded.
The third onset observed at 23.4 ± 0.1 eV in the ionization efficiency curve of CH2 +
corresponds probably to those ions which contribute to the high energy tail of the translational energy distribution observed for 25 and 30 eV electrons.
The CH2 +
ion intensity for VR > 0.5 V is too low to record in a reasonable time-span the first
differentiated ionization efficiency curves at higher retarding potential settings: e.g. the curve in Fig. 5 for VR =
0.5 V needed about 70 h. It has therefore not been possible to extend the investigation of the kinetic energy vs. appearance energy diagram beyond VR = 0.5 V. The vertical line (3) is probably indicative of CH2+ ions
produced with a minimum amount of kinetic energy at the onset. This amount could not be measured. However, for 25 eV electrons, the maximum translational energy carried by CH2
+
energy, this amount is 1.7 X 34/19 = 3.0 eV.
It has to be noticed that the onset energy of 23.4 ± 0.1 eV is close to the vertical ionization energy of 23.5 eV observed in the He(II) photo-electron spectrum of CH3F [6]. The photo-electron band at this energy,
corresponding to the removal of a 4a1 electron, does not show any structure. The lack of structure could be
interpreted by the dissociative nature of this state.
The minimum threshold energy for this process is 23.4 — 3.0 eV = 20.4 eV. The calculated onset for process (5) is 19.8 ± 0.3 eV. The energy difference of 20.4 - 19.8 eV = 0.6 eV is available for internal energy of CH2
+
, i.e. vibronic energy. Quantum mechanical calculations on the CH2 +
system show the first excited 2B1
state to be at 0.13 eV above the bent ground-state X~2A1 [14].
The most probable interpretation for the CH2+ ion formation at 23.4 eV is the direct dissociative
ionization process (5) via the CH3F+ ionized state at 23.5 eV, where CH2+ is produced with translational energy
at threshold.
CONCLUSIONS
The investigation of the dissociative ionization of CH3F by electro-ioniza-tion and fixed wavelength
photo-ionization was an opportunity (i) to study the problems related to the CH3+ ion formation and (ii) to obtain
new information about the CH2 +
dissociation channel.
The main question is related to the lack of "thermal" CH3 +
ions in the photo-ionization efficiency curve [3], whereas they are detected in the electro-ionization efficiency curve with an onset at 14.5 eV [1,2]. The lack of photo-ion/photo-electron coincidence below 16.5 eV apparently confirms the photo-ionization results [4].
From the present study the conclusion is that no coincidence is expected to be observed because the "thermal" CH3
+
ions appear by dissociative autoionization. These ions are observed in He<I) and Ne(I) photo-ion energy spectra. Furthermore, in photo-ionization work which is still in progress [12], the CH3
+
ions, appearing at 14.5 eV, have been detected. The kinetic energy vs. appearance energy diagram related to the CH3
+
ion formation has been discussed.
For the CH2 +
dissociation channel, the appearance energies, translational energy spectra and the kinetic energy vs. appearance energy diagram were discussed in detail. Most of the CH2
+
ions are produced by dissociative autoionization. For this ion also, no photo-electron/photo-ion coincidence could be observed, using the He(I) resonance line [4].
ACKNOWLEDGEMENTS
This work was performed under the auspices of the Action de Recherche Concertée (A.R.C.) contract with the Belgian Government. The authors wish to thank the Fonds de la Recherche Fondamentale Collective (F.R.F.C.) and the Université de Liège for financial support.
REFERENCES
1 S. Tsuda, C.E. Melton and W.H. Hamill, J. Chem. Phys., 41 (1964) 689. 2 H. Dibeler and R.M. Reese, J. Res. Natl. Bur. Stand., 54 (1955) 127.
3 M. Krauss, J.A. Walker, V.H. Dibeler, J. Res. Natl. Bur. Stand. Sect. A, 72 (1968) 281.
4 J.H.D. Eland, R. Frey, A. Kuestler, H. Schulte and B. Brehm, Intern. J. Mass Spectrom. Ion Phys., 22 (1976) 155. 5 L. Karlsson, R. Jadrny, L. Mattson, F.T. Chau and K. Siegbahn, Phys. Scr., 16 (1977) 225.
7 R. Locht and J. Schopman, Int. J. Mass Spectrom. Ion Phys., 15 (1974) 361. 8 R. Locht and J. Momigny, to be published.
9 I. Lindau, J.C. Helmer and J. Uebbing, Rev. Sci. Instrum., 44 (1973) 265. 10 C.E. Moore, Atomic Energy Levels, Vol. 1, NBS Circ. 467, 1949.
11 R. Locht, J. Schopman, H. Wankenne and J. Momigny, Chem. Phys., 7 (1975) 393. 12 R. Locht and E. Ruhl, to be published.
13 B. Herzberg, Molecular Spectra and Molecular Structure, Vol. 3, Van Nostrand, Princeton, 1967. 14 C.F. Bender and H.F. Schaeffer, III, J. Mol. Spectrom., 37 (1975) 423.