Developing decision-support tools with
economic and environmental interests
for the dairy sector using milk
mid-infrared spectrometry
COMMUNAUTÉ FRANÇAISE DE BELGIQUE UNIVERSITÉ DE LIÈGE – GEMBLOUX AGRO-BIO TECH
Developing decision-support tools with economic
and environmental interests for the dairy sector
using milk mid-infrared spectrometry
Pauline DELHEZ
Dissertation originale présentée en vue de l’obtention du grade de docteur en sciences agronomiques et ingénierie biologique
Promoteurs : Prof. Hélène Soyeurt & Prof. Nicolas Gengler Année civile : 2020
I
Abstract
Maintaining satisfying economic outcomes and limiting environmental impacts are key challenges in dairy farming today and this requires good decision-making regarding actions to make on farms. The analysis of milk by Fourier-transform mid-infrared (MIR) spectrometry provides valuable information on milk composition. This technique has already demonstrated qualities to support decision-making, for example, through the well-established predictions of milk fat and protein contents or the latest development of prediction models for novel traits. However, its full potential remains partly uninvestigated. Hence, the objective of this thesis was to contribute to the development of decision-support tools with economic and environmental interests for the dairy sector using milk MIR spectrometry. The research conducted in the framework of this thesis covered three different approaches of using MIR for decision support: (1) the development of a MIR calibration equation to predict a trait of interest, (2) the development of a test-day model to predict milk MIR spectra for management purposes, and (3) the combination of MIR-predicted data with other data streams as a means of providing additional information for decision-making.
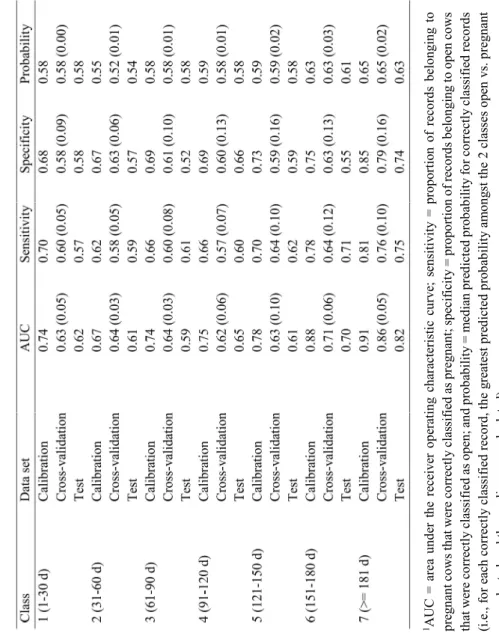
First, we explored different strategies to predict the pregnancy status of dairy cows (pregnant vs. open) in Australia using milk MIR spectra and partial least squares discriminant analysis. Correctly identifying the pregnancy status of cows is imperative for a profitable dairy farm. Early pregnancy could not be detected satisfactorily, but promising results were obtained using MIR spectra recorded 151 days or more after insemination (i.e., mid- and late gestation), with the area under the receiver operating characteristic curve of 0.76 on the testing set. A potential application that needs to be explored further is the development of a screening tool to detect mid- to late-term fetal abortion.
Secondly, we studied the ability of a test-day mixed model to predict milk MIR spectra from first parity Holstein cows for management purposes (e.g., for the detection of problems, simulations, predictions of future data). The spectral data used for modeling originated from the Walloon milk recording database. The average correlation between observed and predicted values of each spectral wavenumber was 0.85 for the modeling set and ranged from 0.36 to 0.62 for different scenarios that corresponded to situations with more or less information known about the cows. Correlations between milk fat, protein and lactose contents predicted from the observed spectra and from the modeled spectra ranged from 0.83 to 0.89 for the modeling set and from 0.32 to 0.73 for the scenarios. These results demonstrated a moderate but promising ability to predict milk MIR spectra using a test-day model. Different improvements of the model are possible before potential practical applications that could have economic or environmental implications for dairy farming, depending on the MIR traits subsequently predicted from the modeled spectra.
II
Thirdly, we investigated the univariate relationships (correlations) between dairy cow enteric methane (CH4) production (g/day) predicted from milk MIR spectra and
42 technico-economic variables from 206 Walloon dairy herds over a period of 8 years. Enteric CH4 is an important part of the carbon footprint of milk production.
Significant correlations ranged between |0.06| and |0.38|. Low MIR CH4 production
tended to be associated with more extensive or suboptimal management practices, which could lead to lower profitability. The observed weak correlations suggest intricate interactions between MIR CH4 and technico-economic variables due to the
use of real farm data with large variability in management practices. This implies the need for further research to unravel these complex relationships for a better understanding of factors associated with CH4 production on dairy farms in order to
better target mitigation strategies.
Lastly, we discussed, in the light of the research carried out in this thesis, strengths as well as issues and considerations regarding the development of decision-support tools using milk MIR. In particular, key strengths of MIR are the low cost and rapidity of the technology as well as the standard procedures for milk sample collection and analysis, allowing the acquisition of MIR data on a large scale for the development of various customized tools to assist decision-making on dairy farms. Issues and considerations covered the prediction of indirect MIR traits, the quality and variability of spectral and reference data, the choice and validation of models, the utilization of MIR indicators, the study of MIR traits in the population, the timing of milk sampling, and the uptake of MIR tools by farmers.
In conclusion, this thesis contributed (1) to establish the first steps of the development of new MIR tools and studies to support decision-making in dairy farming with potential economic and environmental benefits; and (2) to gain insight into the benefits and considerations of using milk MIR for the development of decision-support tools.
III
Résumé
Maintenir des résultats économiques satisfaisants et limiter les impacts environnementaux sont des enjeux essentiels en élevage laitier de nos jours et cela demande des prises de décisions adéquates par rapport aux actions à réaliser dans les exploitations laitières. L’analyse du lait par la spectrométrie moyen infrarouge à transformée de Fourier (MIR) fournit des informations intéressantes sur la composition du lait. Cette technique a déjà démontré des qualités pour accompagner les prises de décisions, par exemple via les prédictions des teneurs en matière grasse et protéine du lait déjà bien établies ou les récents développements de modèles de prédiction pour des caractères nouveaux. Cependant, son plein potentiel reste encore partiellement inexploré. De ce fait, l’objectif de cette thèse est de contribuer au développement d’outils d’aide à la décision avec des intérêts économiques et environnementaux pour le secteur laitier en utilisant la spectrométrie MIR. Les recherches réalisées dans le cadre de cette thèse couvrent trois approches différentes de l’utilisation de la spectrométrie MIR pour l’aide à la décision : (1) le développement d’une équation de calibration MIR pour prédire un caractère d’intérêt, (2) le développement d’un modèle jour de test pour prédire le spectre MIR du lait dans un but de management, et (3) la combinaison de données prédites à partir de la spectrométrie MIR avec d’autres sources de données afin de fournir des informations supplémentaires pour les prises de décisions.
Premièrement, différentes stratégies ont été explorées pour prédire le statut de gestation des vaches laitières (gestantes vs. non gestantes) sur base de spectres MIR du lait collectés en Australie et à l’aide de la méthode d’analyse discriminante par les moindres carrés partiels (PLS-DA). Identifier de façon correcte le statut de gestation des vaches est essentiel pour la rentabilité des exploitations laitières. La gestation à un stade précoce n’a pas pu être détectée de manière satisfaisante, mais des résultats prometteurs ont été obtenus en utilisant des spectres MIR collectés 151 jours ou plus après insémination (c.-à-d. en milieu et fin de gestation), avec une aire sous la courbe ROC de 0.76 pour le jeu de valdiation. Une application potentielle à explorer davantage serait le développement d’un un outil de screening pour alerter quant à de potentiels avortements à des stades moyens à avancés.
Deuxièmement, nous avons étudié la capacité d’un modèle jour de test mixte pour prédire le spectre MIR du lait de vaches Holstein en première lactation dans un but de management (p.ex. détection de problèmes, simulations, prédictions de données futures). Les données spectrales utilisées pour la modélisation proviennent du contrôle laitier en Wallonie. La corrélation moyenne entre les valeurs observées et prédites pour chaque nombre d’onde du spectre est de 0.85 pour le jeu de modélisation et varie entre 0.36 et 0.62 pour différents scénarios correspondant à des situations où on connait plus ou moins d’informations à propos des vaches. Les corrélations entre les teneurs en matière grasse, protéine et lactose prédites sur base du spectre observé et sur base du spectre modélisé varient de 0.83 à 0.89 pour le jeu de modélisation et de 0.32 à 0.73 pour les scénarios. Ces résultats montrent une capacité moyenne mais
IV
prometteuse de prédire le spectre MIR du lait à partir d’un modèle jour de test. Différentes améliorations du modèle sont possibles avant de potentielles applications pratiques qui pourraient avoir des implications économiques ou environnementales selon les caractères prédits à partir du spectre modélisé.
Troisièmement, nous avons analysé les relations univariées (corrélations) entre les émissions de méthane (CH4 ; g/jour) entérique des vaches laitières prédites à partir du
spectre MIR du lait et 42 variables technico-économiques pour 206 troupeaux laitiers Wallon sur une période de 8 ans. Le CH4 entérique constitue une partie importante de
l’empreinte carbone de la production de lait. Les corrélations significatives varient entre |0.06| et |0.38|. Des émissions plus faibles de MIR CH4 ont tendance à être
associées avec des pratiques de management plus extensives ou sous-optimales, qui peuvent conduire à des résultats économiques plus faibles. Les faibles corrélations observées suggèrent des relations complexes entre le MIR CH4 et les variables
technico-économiques du fait de l’utilisation de données réelles issues d’exploitations avec une large variabilité de pratiques de management. Cela implique la nécessité de réaliser des études plus approfondies afin de décrypter ces relations complexes pour une meilleure compréhension des facteurs associés aux émissions de CH4 afin de
mieux cibler les stratégies de réduction des gaz à effet de serre dans les fermes laitières.
En dernier lieu, nous avons discuté, à la lumière des recherches réalisées dans cette thèse, de certains points positifs et points d’attention concernant le développement d’outils d’aide à la décision en utilisant la spectrométrie MIR du lait. Plus particulièrement, les avantages principaux de la spectrométrie MIR sont le coût peu élevé et la rapidité des analyses ainsi que les procédures standardisées pour la collecte et l’analyse des échantillons, permettant l’obtention de données MIR à large échelle afin de développer différents outils personnalisés pour accompagner les prises de décision dans les fermes laitières. Les points d’attention discutés concernent les prédictions de caractères MIR indirects, la qualité et la variabilité des données de référence et des données spectrales, le choix et la validation des modèles utilisés, l’utilisation d’indicateurs MIR, l’étude des caractères MIR dans une population, la fréquence de collecte des échantillons de lait, et l’adoption des outils MIR par les éleveurs.
En conclusion, cette thèse (1) contribue à établir les premières étapes du développement de nouveaux outils et études MIR pour accompagner les prises de décisions en élevage laitier, avec de potentiels bénéfices économiques et environnementaux ; et (2) contribue à une meilleure compréhension des bénéfices et des éléments à considérer lors de l’utilisation de la spectrométrie MIR pour développer des outils d’aide à la décision.
V
Acknowledgments
Firstly, I would like to express my sincere gratitude to the National Fund for Scientific Research (FNRS). This thesis would not have been possible without their financial support through the “Research Fellow” fellowship, and for the international conferences and the research stay in Australia.
I am deeply indebted to my supervisors, Hélène Soyeurt and Nicolas Gengler, for their continuous guidance and support, as well as for sharing their knowledge in their respective fields. This has been crucial to achieve this thesis.
I am very grateful to Jennie Pryce and Phuong Ho from Agriculture Victoria Research (AgriBio, Melbourne) for welcoming me to their research department for 6 months as part of my research stay in Australia, as well as for their precious guidance. I would also like to thank the members of my thesis committee and the members of the jury: Frédéric Dehareng, Didier Stilmant, Jérôme Bindelle, Yves Brostaux, and Phuong Ho, for their insightful comments and suggestions.
Many thanks to Frédéric Colinet for helping me with data on the servers, to Astrid Loriers and Florence Van Stappen from the CRA-W for exchanging information and ideas about DECiDE and environmental aspects of dairy production, and to Eric Froidmont and his team for accepting my presence during experiments of the Grassmilk project at the farm of the CRA-W. I wish to thank Amélie Vanlierde for her explanations about enteric methane emissions and the equations she developed. I am also grateful to Edouard Reding for providing data from the awé accounting database. Moreover, I gratefully acknowledge the co-authors of my publications for their help.
Finally, I would like to offer my special thanks to my colleagues from the SIMa for the very pleasant work atmosphere and for their everyday support.
VI
Table of contents
Abstract ... I Résumé ... III Acknowledgments ...V Table of contents ... VI List of figures... IX List of tables ...X List of abbreviations ... XII1: General introduction ... 1
1. Context: current challenges of dairy farming ... 3
2. The need for new decision-support tools in dairy farming ... 4
3. MIR analysis of milk ... 6
4. Milk MIR for decision support ... 9
5. Research objectives and outline ... 11
6. References ... 12
2: Diagnosing the pregnancy status of dairy cows: how useful is milk mid-infrared spectrometry? ... 19
1. Introduction ... 23
2. Materials and methods ... 24
2.1. Data ... 24
2.2. Data preprocessing... 25
2.3. Modeling strategies ... 26
2.4. Model development and evaluation of performance ... 28
3. Results and discussion ... 29
3.1. Data description ... 29
3.2. Diagnosis of pregnancy status using MIR with different approaches .. 30
4. Conclusions ... 36
5. Acknowledgments ... 37
VII
3: Predicting milk mid-infrared spectra from first parity Holstein cows using a
test-day mixed model with the perspective of herd management ... 41
1. Introduction ... 45
2. Materials and methods ... 46
2.1. Modeling data ... 46
2.2. Preprocessing of modeling MIR spectra ... 46
2.3. Model ... 47
2.4. Spectral wavenumber predictions for the modeling dataset ... 48
2.5. Spectral wavenumber predictions for different scenarios ... 49
2.6. MIR trait predictions ... 50
3. Results and discussion ... 51
3.1. Preprocessing of modeling MIR spectra ... 51
3.2. Variance components ... 53
3.3. Predictions of spectral wavenumbers ... 54
3.4. Predictions of MIR traits ... 56
3.5. Practical use for herd management ... 58
4. Conclusions ... 60
5. Acknowledgments ... 60
6. References ... 60
4: Relationships between milk mid-infrared predicted gastro-enteric methane production and the technical and financial performance of commercial dairy herds ... 65
1. Introduction ... 69
2. Materials and methods ... 70
2.1. Data ... 70 2.2. Relationships study ... 74 3. Results ... 75 3.1. Technical variables ... 75 3.2. Economic variables ... 75 4. Discussion ... 77
VIII
4.2. Relationship with milk composition ... 77
4.3. Relationship with milk yield ... 78
4.4. Relationship with feed ... 78
4.5. Relationship with herd characteristics ... 79
4.6. Relationship with economic results ... 79
4.7. Intensity of the relationships ... 80
5. Conclusion ... 81
6. Acknowledgments ... 82
7. References ... 82
5: General discussion ... 87
1. Strengths of MIR for the development of decision-support tools... 90
1.1. Easy, cheap and large-scale acquisition of MIR data ... 90
1.2. Association and comparability of MIR data ... 90
1.3. A versatile method for the development of customized tools at the herd and animal levels ... 91
1.4. From day-to-day decisions to long-term impacts and strategic decisions ... 92
2. Issues and considerations regarding the development of MIR decision-support tools ... 94
2.1. On the prediction of physiological status-related traits and other indirect MIR traits ... 94
2.2. Data selection ... 96
2.3. Model development ... 101
2.4. Implementation of MIR tools ... 108
3. Conclusion and perspectives... 113
4. References ... 115
IX
List of figures
Figure 1-1. Diagram of a specialized dairy farming system (based on Heinemann,
2009). ... 5
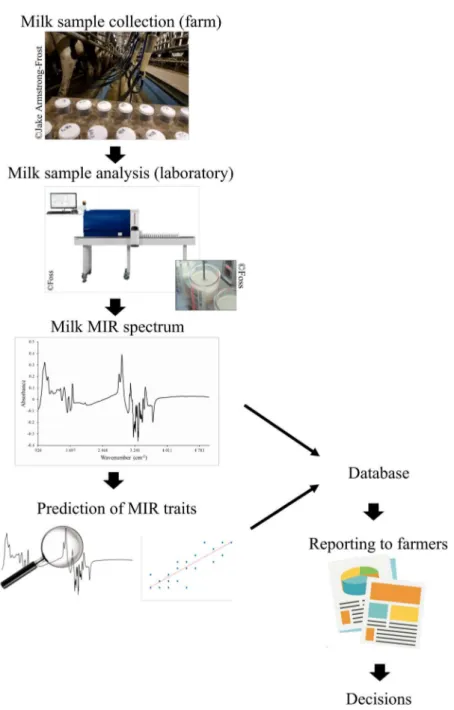
Figure 1-2. Pictorial summary of milk MIR analysis as part of milk recording... 8
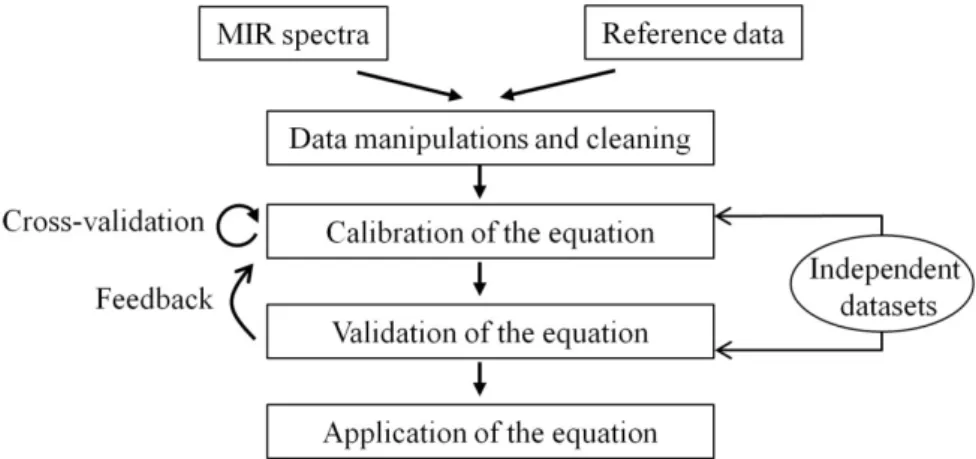
Figure 1-3. Usual steps in the development of a MIR prediction equation. ... 9
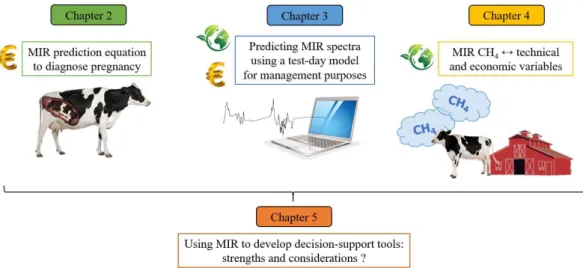
Figure 1-4. Overview of Chapters 2-5 of the thesis. ... 12
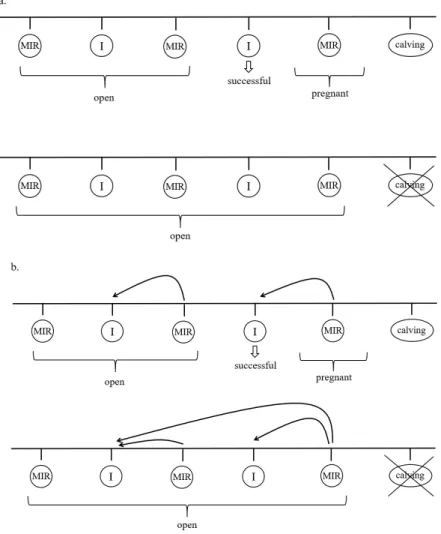
Figure 2-1. (a) Timeline diagram explaining how the pregnancy status (i.e., open or pregnant) was defined for milk mid-infrared spectrum (MIR) records. (b) Timeline diagram explaining the selection of spectra after insemination. The MIR records with open status can be associated with several inseminations. The MIR records with pregnant status are only associated with the successful insemination. I = insemination. ... 25
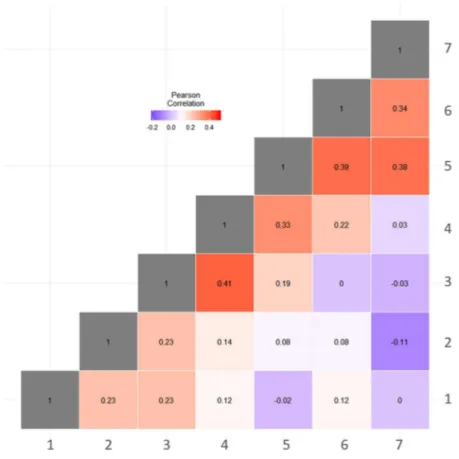
Figure 2-2. Heatmap of correlations between coefficients of the 7 models associated with the classes of records based on the number of days after insemination (class 1 = 1 to 30 d, class 2 = 31 to 60 d, class 3 = 61 to 90 d, class 4 = 91 to 120 d, class 5 = 121 to 150 d, class 6 = 151 to 180 d, class 7 = ≥181 d). ... 36
Figure 3-1. (A) Skewness for each of the 311 selected spectral wavenumbers for the modeling dataset. The continuous line represents the raw spectra; circles represent the derived spectra. (B) Excess kurtosis for each of the 311 selected spectral wavenumbers for the modeling dataset. The continuous line represents the raw spectra; circles represent the derived spectra. ... 52
Figure 3-2. Average correlation between observed and predicted values for the 311 spectral wavenumbers according to the number of principal components selected (A) for the modeling dataset and (B) for the 4 scenarios datasets together. ... 53
Figure 3-3. Percentage of total variance of spectral wavenumbers retained by the model explained by genetic, permanent environmental, herd-test-day and residual effects. ... 54
Figure 3-4. Correlations between observed and predicted values for the 311 spectral wavenumbers for the modeling dataset. Min = minimum; Max = maximum. ... 55
Figure 3-5. Correlations between observed and predicted values for the 311 spectral wavenumbers for the 4 scenarios. ... 56
Figure 4-1. Heatmap of correlations between lactating dairy cow herd_year based milk MIR CH4 production (HYMIR-CH4) and herd_year technico-economic variables. Abbreviations for technico-economic variables are provided in Table 4-1 and Table 4-2. Variable with names ending with ‘.log10’ were log-transformed. White colour means non-significant relationship (P > 0.05)... 76
X
List of tables
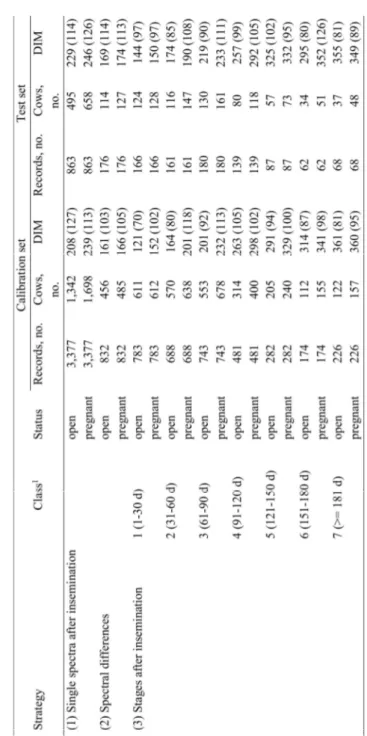
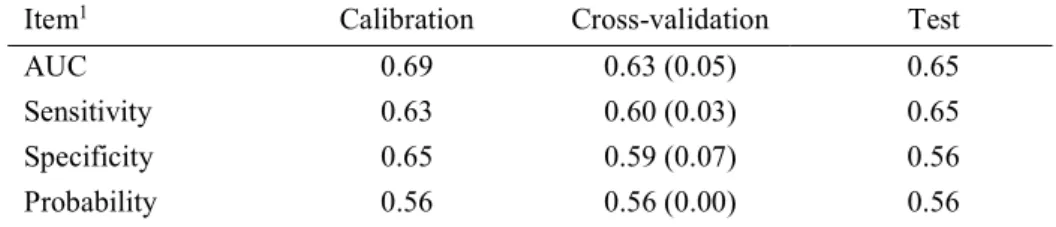
Table 2-1. Number of open and pregnant records and cows, and DIM (mean, with SD in parentheses) for the calibration and test sets for the 3 strategies ... 27 Table 2-2. Strategy 1 (single spectra after insemination): results of partial least squares discriminant analysis for calibration, random cow-independent 10-fold cross-validation (mean, with SD in parentheses), and cow-independent test set ... 31
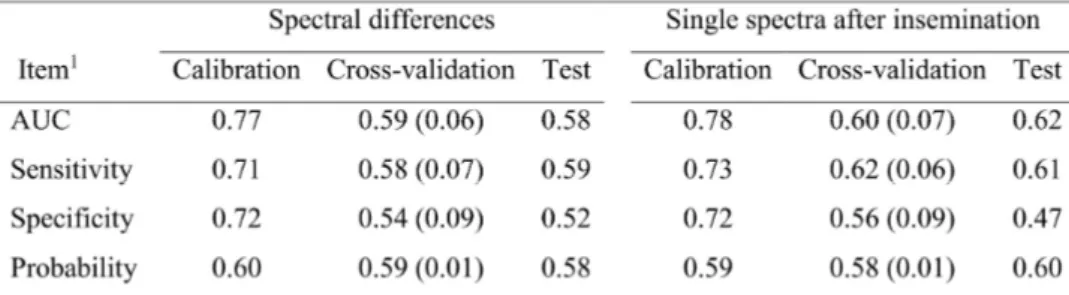
Table 2-3. Strategy 2 (spectral differences): comparison of the results of partial least squares discriminant analysis with spectral differences vs. single spectra after insemination as independent variables for calibration, random cow-independent 10-fold cross-validation (mean, with SD in parentheses), and cow-independent test set ... 32
Table 2-4. Strategy 3 (stages after insemination): results of partial least squares discriminant analysis for calibration, random cow-independent 10-fold cross-validation (mean, with SD in parentheses), and cow-independent test set for the 7 classes of records based on the number of days after insemination1 ... 34
Table 3-1. Description of the 4 scenarios (number of records, cows and herds; effect estimates; and meaning) ... 50 Table 3-2. Descriptive statistics of correlations between observed and predicted values for the 311 spectral wavenumbers for the 4 scenarios ... 55 Table 3-3. Left side: correlations between fat, protein, and lactose contents (g/dL of milk) predicted from observed spectra vs. from spectra modeled from a test-day model (TDM); right side: correlations between fat, protein, and lactose contents (g/dL of milk) predicted from observed spectra vs. modeled directly using a TDM1 ... 57
Table 3-4. Mean (SD in parentheses) for fat, protein, and lactose contents (g/dL of milk) predicted from observed and modeled spectra and root mean square error (RMSE) between fat, protein, and lactose contents predicted from observed vs. modeled spectra for the modeling dataset and the 4 scenarios ... 58 Table 4-1. Description of the technical variables for the 1,024 dairy cow herd_year records ... 71 Table 4-2. Description of the economic variables for the 1,024 dairy cow herd_year records ... 73 Table 5-1. Strategy 3 (stages after insemination): results of different machine learning algorithms for the cow independent test sets for the 2 last classes of records based on the number of days after insemination1 ... 103
Table 5-2. Strategy 2 (spectral differences, cf. Chapter 2): comparison of the results of partial least squares discriminant analysis with classical random 10-fold validation and random cow-independent 10-fold validation (i.e., block cross-validation)1 ... 105
Table 5-3. Correlations between novel MIR traits predicted from the observed spectra and from the modeled spectra for the modeling dataset and the 4 scenarios. For comparison, the results for fat, protein, and lactose contents (extracted from Table 3-3), were added in the first 3 columns ... 106
XI
Table 5-4. Mean (SD into parentheses) for calcium (Ca), potassium (K), citrate, beta-hydroxybutyrate (BHB), lactoferrin, omega-3 fatty acids, omega-6 fatty acids predicted from observed and from modeled spectra for the modeling dataset and the 4 scenarios ... 107 Table A-1. Information about novel traits prediction equations: unit of measurement; project that supported the development of the equation; number of observations (Nobs), mean and SD for the calibration dataset; R² of cross-validation (R²cv); and standard error of cross-validation (SECV) ... 127
XII
List of abbreviations
• ANN: artificial neural network
• AUC: area under the receiver operating characteristic curve • BHB: beta-hydroxybutyrate
• BLUP: best linear unbiased prediction • Ca: calcium
• calf_meat: value of meat production from calves, expressed per cow
• calf_meat.L: value of meat production from calves, expressed per litre fat and protein corrected milk
• calves_price: price of sold calves • CH4: methane
• CI: calving interval
• cm-1: 1/centimetre, wavenumber unit
• CO2: carbon dioxide
• concentrate_feed: kilograms of concentrate equivalents fed to dairy cows per year
• concentrate_feed.L: kilograms of concentrate equivalents fed to dairy cows per litre fat and protein corrected milk
• conserved_forages: percentage of conserved forages in the forage area • cow_meat: value of meat production from cows, expressed per cow
• cow_meat.L: value of meat production from cows, expressed per litre fat and protein corrected milk
• culled_cows_price: price of culled cows • culling_age: age of culled cows
• culling_percent: culling rate • d: day
• DIM: days in milk • DMI: dry matter intake • dL: decilitre
• EU: European Union • FA: fatty acid
• fat_percent: milk fat percentage
• feed_costs: purchased feed costs per cow
• feed_costs.L: purchased feed costs per litre fat and protein corrected milk • first_calving: age at first calving
• fixed_costs: fixed costs per cow
• fixed_costs.L: fixed costs per litre fat and protein corrected milk • forage_area: size (in hectares) of the forage area
• forage_area_costs: variables costs related to the forage area, expressed per cow • forage_area_costs.L: variables costs related to the forage area, expressed per
litre fat and protein corrected milk
• forage_milk: litres of milk per cow produced from forages • FPCM: fat and protein corrected milk
XIII
• g: gram
• Gen: additive genetic effect
• GH: standardized Mahalanobis distance • GHG: greenhouse gas
• grass_milk: litres of milk per cow produced from grass • gross_margin: gross margin per cow
• gross_margin.L: gross margin per litre fat and protein corrected milk • H2: hydrogen
• ha: hectare
• herd_costs: herd costs per cow
• herd_costs.L: herd costs per litre fat and protein corrected milk • herd_year: associated with each herd and year
• HTDr: herd-test-day effect • HTM: herd-test-month effect • HTY: herd-test-year effect
• HYMIR-CH4: methane production for a specific herd and year predicted from
milk Fourier-transform mid-infrared spectra • IR: infrared
• K: potassium • kg: kilogram
• KNN: k-nearest neighbors • l: litre
• LU: livestock unit
• LU.ha: number of livestock units per hectare of forage area • meat.ha: meat production per hectare of forage area • milk.ha: milk per hectare of forage area
• milk_production: value of milk production per cow
• milk_production.L: value of milk production per litre fat and protein corrected milk
• MIR: Fourier-transform mid-infrared
• MIR-CH4: methane production predicted from milk Fourier-transform
mid-infrared spectra • mo: month
• n_calvings: average number of calvings per cow per year • n_cows: number of dairy cows
• n_cows.labour: number of dairy cows per labour supply
• nitrogen_grass: kilograms of nitrogen applied on grasslands per year • no.: number
• Nobs: number of observations • PC: principal component
• PCA: principal component analysis • PE: permanent environmental effect
• PLS-DA: partial least squares discriminant analysis • profit: profit per cow
XIV
• profit.L: profit per litre fat and protein corrected milk • prot_percent: milk protein percentage
• r: correlation
• R²: coefficient of determination
• R²cv: cross-validation coefficient of determination • REML: restricted maximum likelihood
• RMSE: root-mean-square error • ROC: receiver operating characteristic • SCC: somatic cell count
• SD: standard deviation
• SECV: standard error of cross-validation • SF6: sulfur hexafluoride
• SVM: support vector machine • TDM: test-day model
• TMR: total mixed ration • VFA: volatile fatty acid
1
Chapter 1 : General introduction
3
1. Context: current challenges of dairy farming
For centuries, milk and dairy products have been an important source of nutrients for the global population. In the European Union (EU), milk production is the second largest agricultural sector, representing more than 13% of total agricultural outputs in 2018 (Eurostat, 2019). Total milk production was estimated at about 170 million tons per year and there were around 21 million cows in the EU in 2018 (European Commission, 2019a; Eurostat, 2019). However, the European and global dairy sector has been facing many changes and challenges in recent years.
First, there is reduced governmental involvement in regulating agricultural commodity prices worldwide, such as the abolishment of milk quotas in the EU in 2015 and the openness to the world market, or the recent international trade agreements (e.g., EU-Mercosur), leading to fluctuating (typically declining) milk prices to align with global prices (Barkema et al., 2015; DG AGRI, 2017; European commission, 2019b). The fluctuating and low milk price is a major factor in reduced profitability. On top of that, some countries like Belgium are noticing an increase in agricultural land price, mainly driven by an increasing demand for land for non-agricultural uses (La Spina, 2014).
Besides, the trend toward fewer but larger dairy farms continues in the EU and across the globe (Barkema et al., 2015). Since the abolishment of milk quotas, farmers in the EU are facing growing pressures to focus on the economy of scale by increasing the size of their herds (Norton and Berckmans, 2017). At the same time, there is lower involvement of family labour on the farm and more farms depend on non-family labour, often expensive and sometimes less skilled (La Spina, 2014). More animals and less workforce lead to more complex and time-consuming monitoring and management of cows, potentially affecting farm profitability (Norton and Berckmans, 2017).
Additionally, there are increasing regulations related to consumer protection, food safety and quality, sanitary measures (i.e., preventing animal and zoonotic diseases, and reduction of medical treatment), and the environment as well as increasing administrative work (Barkema et al., 2015; Turlot, 2019). Also, the consumers, influencing processors and retailers, are being increasingly concerned with animal welfare, food safety, health, and environmental protection (De Graaf et al., 2016). This requires updated infrastructures, adapted management practices, better monitoring of animals, and tools to control food quality, environmental parameters as well as animal welfare. In this context, farmers can face costs for compliance with regulations, which can impact profitability (DG AGRI, 2017).
Moreover, climate change and environmental disruptions will likely become increasingly important in the future. Global temperature has increased steadily in the last decades and is expected to continue (Allen et al., 2018). In many areas of the world, scientists forecast warmer temperatures year-round, greater variation in precipitations (i.e., periods of drought and excess rainfall) and more severe weather
Developing decision-support tools using milk mid-infrared spectrometry
4
incidents (Seneviratne et al., 2012). Changing climatic conditions lead to more difficult crop and fodder production for feed as well as animal health and welfare issues (e.g., heat stress), also exerting weight on farm profitability (Raitens and Combs, 2019). Also, assessing the environmental impacts of dairy farms (e.g., soil degradation, ecotoxicity, greenhouse gas emissions) is necessary to better target actions to mitigate environmental footprint.
Lastly, there is a need to improve on-farm working conditions and the quality of life of farmers. Farmers seek less physical work, to save time, more and more flexibility in organizing their work (i.e., to adapt to their family life) and to reduce the mental workload by anticipating events such as inseminations or health problems (Hostiou et al., 2017).
Summing up, dairy farming in the EU and across the globe is facing many challenges related to the three pillars of sustainability, i.e., economic, environmental and social aspects (Wezel et al., 2014).
2. The need for new decision-support tools in dairy
farming
In this context, there is an increasing importance of good decision-making regarding actions to make on farms in order to maintain sustainable dairy farming, and there is a need for the development of new management tools to cope with these different challenges.The farmer has a key role in farm decision-making, but he is not the only one to take decisions regarding dairy farming. Several stakeholders (agricultural advisors, feed or fertilizer salesmen, etc) may be involved in the analysis of problems and the selection of appropriate solutions. Also, the authorities can encourage certain practices by specific support, or restrict others as a means of regulation (Meynard et al., 2002).
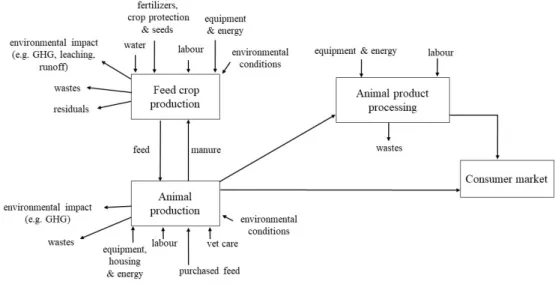
Traditionally, farmers and stakeholders made their decisions based on intuitive methods, experiential learning, experts’ knowledge, or statistics from historical records (Jago et al., 2013). The two last approaches can lead to approximate decisions that can be too generic (i.e., not adapted to each farm and not specific enough for individual cows) and insensitive to the unstable changes in the market and environment. Dairy farms are complex systems with many interacting inputs and outputs. Each type of feed crop or animal has its own set of interacting components upon which observations need to be made, decisions need to be taken, and operations need to be controlled (Figure 1-1, Heinemann, 2009). To deal with decision-making in such complex systems and to customize what actions to make for each specific farm, decision-support tools have been developed to guide the farmers and stakeholders towards the best alternative solutions from an economic, social or environmental point of view. Decision-support tools assist the users in their decision process and support, rather than replace, human judgment (Moureaux, 2016). There are different types of decision-support tools, with many of them being
computer-Chapter 1 : General introduction
5
based. For instance, these can be dynamic tools, whose recommendations vary according to the users’ inputs, and they lead the users through clear steps and suggest optimal decisions (Rose et al., 2016). Other decision-support tools may not be dynamic, but rather descriptive or predictive and act as information sources to improve the evidence base for decisions. These can use field observations and measurements or associated predictions to adjust interventions to the farm (Meynard et al., 2002; Rose et al., 2016).
Figure 1-1. Diagram of a specialized dairy farming system (based on Heinemann, 2009).
Many management decision-support tools have been developed so far to assist dairy farmers and stakeholders. They cover different components of the dairy farming system (Figure 1-1). Examples of operational decision-support tools include tools for fertilizers and manure recommendations (e.g., Valor, CRA-W, valor.cra.wallonie.be; Date N’Prairie, Arvalis, www.datenprairie.arvalis-infos.fr), the assessment of environmental impact (e.g., DeCIDE, CRA-W, decide.cra.wallonie.be), heat detection (e.g., Heatime, SCR,
www.fr.scrdairy.com/cow-intelligence/heatime-hr-systeme.html), feed management (e.g., Eva’lait, INRA,
evalait.bretagne.chambagri.fr), grassland management (e.g., GrassMan, www.grassman.fr) or herd health management (e.g., Parasit'sim, idele.fr/services/outils/parasitsim-outil-de-simulation-du-risque-parasitaire.html).
The availability of high-performance computing resources, new technologies (i.e., precision farming), and mass data in dairy farming are prompting the development of new and more customized decision-support tools (Eastwood et al., 2012; Jago et al., 2013). Among the potential technologies, Fourier-transform mid-infrared (MIR) spectrometry is already routinely used in the dairy industry in many areas of the world to analyze major milk components (e.g., fat, protein, lactose contents) for milk payment and individual milk recording (ICAR, 2017). Some advantages of this
Developing decision-support tools using milk mid-infrared spectrometry
6
technology are the reasonable cost of analysis and rapid testing, allowing for large-scale use. MIR has already demonstrated its ability for the development of some management decision-support tools, which will be discussed later, but its full utility is still partly unexplored.
3. MIR analysis of milk
In this section, we will give a more detailed explanation of the general concept of spectroscopy and spectrometry, Fourier-transform mid-infrared (MIR) spectrometry, and the use of MIR for the analysis of milk.
Spectroscopy is the study of the interaction between matter and electromagnetic radiation. Electromagnetic radiation comprises different regions depending on the wavelengths. The infrared region is lying between the visible and microwave regions (from ~ 800 nm to ~1 mm) and is used to identify and study chemical substances, either solid, liquid, or gaseous. When matter is crossed by the infrared electromagnetic radiation, the bonds between the atoms of a molecule vibrate at a precise frequency, interact with infrared rays having the same frequency and absorb the energy of the rays (Subramanian and Rodriguez-Saona, 2009; Khan et al., 2018). On the basis of supplied radiation energy and the amount passing through or absorbed by the sample, it is possible to determine an absorption spectrum representing the chemical composition of different types of samples (De Marchi et al., 2014). Because of the quantitative aspects of infrared spectroscopy (i.e., measuring the electromagnetic radiation as a means of obtaining information), the word spectrometry is also commonly used (Gengler et al., 2016). The resulting absorption spectrum is commonly expressed in % transmittance or absorbance (i.e., representing the amount of radiation absorbed by the sample) versus wavenumber (i.e., wavenumber (cm-1) is
the inversed function of wavelength, Khan et al., 2018). The transmittance (T) and absorbance (A) are calculated as follows:
T= I/I0 A = log (I0/I) = -log(T)
where I0 is the intensity of light emitted by the source and I is the intensity of light
after passing through the sample (Khan et al., 2018). Expressed in wavenumbers, the infrared region of the electromagnetic radiation ranges from approximately 40 cm-1 to
14,000 cm-1 and is divided into three main portions: near-infrared (4000 to 14000
cm−1), mid-infrared (400 to 4000 cm−1), and far-infrared (40 to 400 cm−1; De Marchi
et al., 2014).
Milk is usually analyzed in the mid-infrared region, and more rarely in the near-infrared region, because the mid-near-infrared region provides the clearest signal (i.e., best signal-to-noise ratio) and more relevant information (Grelet, 2019). Spectrometers currently used for milk analysis are Fourier-transform mid-infrared spectrometers, i.e., the most common type of mid-infrared spectrometer. Unlike dispersive instruments such as monochromators, Fourier-transform mid-infrared spectrometers collect all wavelengths simultaneously. They use different beams containing a combination of different wavelengths of electromagnetic radiation at once and
Chapter 1 : General introduction
7
measure the total beam intensity. Then, data are processed posteriorly using a technique called Fourier-transform to obtain the desired spectrum (Gengler et al., 2016; Khan et al., 2018). The main manufacturers of Fourier-transform mid-infrared spectrometers for milk analysis are Foss (Hillerød, Denmark), Perten Instruments (formerly Delta Instruments, Drachten, the Netherlands) and Bentley (Chaska, MN, USA). These three brands provide MIR spectra with different wavenumber ranges, from 925.66 to 5,010.15 cm−1 for Foss spectrometers, from 649.03 to 3,998.59 cm−1
for Bentley spectrometers and from 397.31 to 4,000 cm−1 for Perten spectrometers
(Grelet, 2019).
The use of milk MIR spectrometry is common in dairy cattle for the analysis of milk of individual cows for milk recording, and also for the analysis of bulk tank milk for milk payment. Figure 1-2 illustrates the process of individual MIR samples analysis as part of milk recording, including a representation of the typical shape of the resulting MIR spectra. Milk samples are collected routinely on farms, usually on a monthly basis, for herds enrolled in milk recording (e.g., every 4 or 6 weeks in the Walloon region of Belgium). Samples are either from the morning milking, the evening milking (usually alternately between test days), or more commonly a mixture of both. At the same time, other useful information is collected for each cow, e.g., test date, animal identification, milk yield, breed, birth date, calving date, pedigree. The samples are then analyzed by a Fourier-transform spectrometer in a certified milk laboratory (ICAR, 2017; awé, 2019). The absorbance peaks of the resulting MIR spectra represent wavenumbers at which significant amounts of mid-infrared radiation were absorbed by the samples. The height or area of a peak is proportional to the concentration of the chemical bond they represent in milk. Hence, after spectral data processing, the milk MIR spectra are used both for a qualitative and quantitative purpose as they indicate the presence of a substance in milk and also the quantity of this substance in milk. Absorbance values at different wavenumbers can be linked to reference values in order to develop calibration equations allowing the prediction of milk traits of interest (Gengler et al., 2016). Spectra and predicted traits are stored in databases and can subsequently be reported to farmers (ICAR, 2017; awé, 2019).
Developing decision-support tools using milk mid-infrared spectrometry
8
Chapter 1 : General introduction
9
4. Milk MIR for decision support
Some major advantages of milk MIR for the development of decision-support tools for dairy farming are the easy collection of milk samples on farms on a large scale, the low cost and rapidity of MIR analyses in the laboratory, the comparability of MIR data within and between farms, and the ability to develop customized tools at the herd and at the animal levels. The advantages of milk MIR will be explained and discussed in more detail in section 1 of Chapter 5, including examples from the research conducted in this thesis.
MIR-based tools directly or indirectly target different aspects of the dairy farming system described in Figure 1-1, such as feed, health and vet care, product processing, or the environmental impact.
Prediction equations are the most commonly developed tools with MIR and can support decision-making at the herd level through bulk tank milk analysis and most commonly at the individual level through milk recording. Figure 1-3 explains the usual steps for the development of MIR prediction equations. Some of these stages are part of the traditional process to develop a decision-support tool. The first usual step is the selection, manipulation, and cleaning of the data. The next stage is the development of the model itself (e.g., calibration of the equation), followed by validation (e.g., application of the equation to an independent dataset) to test the performances of the model on real-world data before the implementation. At the implementation stage, it is important to inform the users about the objectives, benefits, conditions of utilization, and limits of the tool.
Figure 1-3. Usual steps in the development of a MIR prediction equation.
Traditional milk components predicted using MIR calibration equations (e.g., milk fat, protein, lactose, and urea contents) are the most common traits communicated to farmers and used for decision-making. For example, the evolution of fat and protein contents over the lactation and the year is used to detect abnormalities or to make decisions regarding feeding, culling, or breeding. The ratio of fat to protein content in
Developing decision-support tools using milk mid-infrared spectrometry
10
milk is used to detect unbalanced diet: a ratio > 1.5 may indicate that the diet is deficient in energy (i.e., risk of ketosis) and a ratio < 1.1 may indicate that the diet is too rich in energy and not fibrous enough (i.e., risk of acidosis; Koeck et al., 2014; awé, 2020). Monitoring urea content in milk is useful for feeding management and to estimate feed nitrogen efficiency, which is also related to the environmental impact of excessive nitrogen excretion (Bastin et al., 2009).
Besides the conventional milk components such as fat, protein, lactose and urea contents, milk composition is much more complex. Following advances in informatics and exploration of MIR spectra (e.g., using multivariate statistics), the number of studies exploring the use of MIR to predict other informative traits has strongly increased since the mid-2000s (De Marchi et al., 2014). Models have been recently built to attempt to predict fine milk composition, such as fatty acid composition (Soyeurt et al., 2006; De Marchi et al., 2011; Maurice-Van Eijndhoven et al., 2013), protein composition (Bonfatti et al., 2011; Rutten et al., 2011), minerals (Soyeurt et al., 2009) or lactoferrin (Soyeurt et al., 2007). Other research explored MIR to predict milk technological properties, such as milk coagulation and cheese yield (Ferragina et al., 2013; Visentin et al., 2015) or milk acidity (De Marchi et al., 2009). Recent studies also considered MIR to predict novel traits mainly related to the cow physiology, for instance methane (CH4) emissions (Vanlierde et al., 2018), nitrogen
use efficiency (Grelet et al., 2020), body energy status (McParland et al., 2011), body weight (Soyeurt et al., 2019), fertility (Ho et al., 2019), energy intake and efficiency (McParland et al., 2014) or milk components related to physiological pathologies like ketosis (Van der Drift et al., 2012; Grelet et al., 2016). In addition, MIR has been investigated to develop other novel models, for example to have information about the geographical origin of milk (Scampicchio et al., 2016; Caredda et al., 2017) or to detect milk adulteration (Balabin and Smirnov, 2011). Most of these MIR prediction equations have been developed in the framework of research projects. Only few of them have been implemented in practice in some countries and reported to farmers, or are in the process of being deployed, to support management decision-making. For instance, in the Walloon region of Belgium, detection of ketosis using several MIR traits (e.g., β-hydroxybutyrate (BHB), fatty acids, acetone) and milk technological properties (e.g., for farms wishing to diversify production and process milk on the farm) are under study to be included in the milk recording results reported to farmers (C. Bastin, 2020, personal communication). To take another example, in Canada, the Ketolab service provides BHB predictions for ketosis detection, and fatty acids predictions on bulk tank milk have recently been available for farmers for feed management (Valacta, 2011; Santschi et al., 2019). Many other novel traits developed by scientific institutions are promising tools to guide various decisions and to optimize herd management, but they need to be elaborated further to be used as decision-support tools in practice.
In addition to management decision support based on predicted MIR phenotypes, conventional and novel MIR traits are of great interest for genetic and genomic evaluations because of the large amounts of phenotypes available through the use of
Chapter 1 : General introduction
11
MIR (Gengler et al., 2016). Genetic evaluations are important for breeding decisions and some other management decisions (e.g., culling). Also, several studies showed the interest of modeling MIR traits predicted from spectra collected routinely using test-day models (TDM), for instance to predict future values, detect problems by comparing observed and predicted (i.e., expected) values or by evaluating the deviation of herd effects (e.g., Koivula et al., 2007; Bastin et al., 2009; Gillon et al., 2010). As a practical example, in Finland, monthly herd-management effect solutions from TDM of milk, fat and protein yields, and SCC are provided for authorized users such as farmers and dairy advisors to recognize management problems (Koivula et al., 2007).
5. Research objectives and outline
This introductory chapter has shown that dairy farming is facing multiple challenges compromising the sustainability of the sector. Dairy farmers consider the economic viability as the most important pillar of sustainability, while society is increasingly concerned by the environmental aspects (Vandreck, 2018). In this context, milk MIR would be a promising method to guide decisions leading to potential improvement of economic and environmental performances of dairy herds. However, the full utility of MIR is still partly unexplored. Therefore, the aim of this thesis was to contribute to the development of novel decision-support tools with economic and environmental interests for the dairy sector using milk MIR spectrometry. This manuscript consists of a compilation of three published scientific papers, covering different approaches of using MIR for decision support and addressing gaps in the current diversity of MIR tools. An overview of the next chapters is given in Figure 1-4.
The first paper (i.e., Chapter 2) focuses on the use of MIR to diagnose the pregnancy status of dairy cows. It illustrates the development of a calibration equation using milk MIR spectra and considers an economically important trait that has not been successfully predicted with MIR yet. This tool would be dedicated to dairy farmers directly or to dairy advisors who could transfer the outputs to farmers and advise them regarding, for example, mating decisions.
The second paper (i.e., Chapter 3) investigates the use of a test-day mixed model to predict milk MIR spectra with the perspective of herd management. As mentioned earlier in the introduction, there is an interest in modeling MIR traits using test-day models. Depending on the trait, this could contribute to optimizing economic and/or environmental performances of dairy herds. However, given the large number of MIR trait prediction equations, developing separate models for each trait would be time- and resource-consuming. Therefore, modeling directly the whole MIR spectrum and subsequently applying existing MIR calibration equations to the modeled spectra could be a better option. This tool would rather be dedicated to dairy advisors who could interpret the outputs and subsequently give advice to farmers, but also to researchers.
Developing decision-support tools using milk mid-infrared spectrometry
12
The third paper (i.e., Chapter 4) illustrates the implementation of a MIR tool and the interest of combining MIR-predicted data with other sources of data to provide more comprehensive information for decision-making. More specifically, we studied the relationships between milk MIR-predicted enteric CH4 production and the technical
and financial performances of commercial dairy herds. MIR equations to predict enteric CH4 production have recently been developed (e.g., Vanlierde et al., 2016). A
significant part of greenhouse gases emitted on a dairy farm comes from enteric CH4
(e.g., 45% in Belgium), meaning it is an important factor in the carbon footprint of dairy products and a key trait to improve the environmental performances of dairy farms (FPS Public Health, 2018). This study was originally dedicated for research purposes to better understand management practices associated with CH4 production,
with potential implications for decisions at the political level (e.g., regarding climate policies) and subsequently at the farm level.
Chapter 5 discusses the main strengths as well as some issues and considerations regarding the use of milk MIR for the development of decision-support tools, mainly based on the learning acquired through the three research studies developed in this thesis. Lastly, a general conclusion and future prospects are addressed.
Figure 1-4. Overview of Chapters 2-5 of the thesis.
6. References
Allen, M.R., O.P. Dube, W. Solecki, F. Aragón-Durand, W. Cramer, S. Humphreys, M. Kainuma, J. Kala, N. Mahowald, Y. Mulugetta, R. Perez, M. Wairiu, and K.Z. 2018. Framing and Context. In: Global warming of 1.5°C. An IPCC special report on the impacts of global warming of 1.5°C above pre-industrial levels and related global greenhouse gas emission pathways, in the context of strengthening the
Chapter 1 : General introduction
13
global response to the threat of climate change, sustainable development, and efforts to eradicate poverty.
awé. 2019. Règlement général du contrôle laitier.
www.awenet.be/awe/UserFiles/file/asbl/document/Reglement-controle-laitier-2019.pdf
awé. 2020. MyAwenet. www.awenet.be/awe/commun/asbl/gestion/myawenet.php. Balabin, R.M., and S. V. Smirnov. 2011. Melamine detection by mid- and
near-infrared (MIR/NIR) spectroscopy: a quick and sensitive method for dairy products analysis including liquid milk, infant formula, and milk powder. Talanta 85:562–568. https://doi.org/10.1016/j.talanta.2011.04.026.
Barkema, H.W., M.A.G. von Keyserlingk, J.P. Kastelic, T.J.G.M. Lam, C. Luby, J.P. Roy, S.J. LeBlanc, G.P. Keefe, and D.F. Kelton. 2015. Invited review: changes in the dairy industry affecting dairy cattle health and welfare. J. Dairy Sci. 98:7426–7445. https://doi.org/10.3168/jds.2015-9377.
Bastin, C., L. Laloux, A. Gillon, F. Miglior, H. Soyeurt, H. Hammami, C. Bertozzi, and N. Gengler. 2009. Modeling milk urea of Walloon dairy cows in management perspectives. J. Dairy Sci. 92:3529–3540. https://doi.org/10.3168/jds.2008-1904. Bonfatti, V., G. Di Martino, and P. Carnier. 2011. Effectiveness of mid-infrared spectroscopy for the prediction of detailed protein composition and contents of protein genetic variants of individual milk of Simmental cows. J. Dairy Sci. 94:5776–5785. https://doi.org/10.3168/jds.2011-4401.
Caredda, M., M. Addis, I. Ibba, R. Leardi, M.F. Scintu, G. Piredda, and G. Sanna. 2017. Building of prediction models by using mid-infrared spectroscopy and fatty acid profile to discriminate the geographical origin of sheep milk. LWT - Food Sci. Technol. 75:131–136. https://doi.org/10.1016/j.lwt.2016.08.053.
De Graaf, S., E.J. Van Loo, J. Bijttebier, F. Vanhonacker, L. Lauwers, F.A.M. Tuyttens, and W. Verbeke. 2016. Determinants of consumer intention to purchase
animal-friendly milk. J. Dairy Sci. 99:8304–8313.
https://doi.org/10.3168/jds.2016-10886.
De Marchi, M., C.C. Fagan, C.P. O’Donnell, A. Cecchinato, R. Dal Zotto, M. Cassandro, M. Penasa, and G. Bittante. 2009. Prediction of coagulation properties, titratable acidity, and pH of bovine milk using mid-infrared spectroscopy. J. Dairy Sci. 92:423–432. https://doi.org/10.3168/jds.2008-1163. De Marchi, M., M. Penasa, A. Cecchinato, M. Mele, P. Secchiari, and G. Bittante.
2011. Effectiveness of mid-infrared spectroscopy to predict fatty acid composition of Brown Swiss bovine milk. Animal 5:1653–1658. https://doi/org.10.1017/S1751731111000747.
De Marchi, M., V. Toffanin, M. Cassandro, and M. Penasa. 2014. Invited review: Mid-infrared spectroscopy as phenotyping tool for milk traits. J. Dairy Sci. 97:1171–1186. https://doi.org/10.3168/jds.2013-6799.
Developing decision-support tools using milk mid-infrared spectrometry
14
Directorate-General for Agriculture and Rural Development (DG AGRI). 2017. Modernising and simplifying the CAP. Background document. Socio-economic challenges facing EU agriculture.
Eastwood, C.R., D.F. Chapman, and M.S. Paine. 2012. Networks of practice for co-construction of agricultural decision support systems: case studies of precision
dairy farms in Australia. Agric. Syst. 108:10–18.
https://doi.org/10.1016/j.agsy.2011.12.005.
European Commission. 2019a. Milk and dairy products. Accessed Jan. 17, 2020.
https://ec.europa.eu/info/food-farming-fisheries/animals-and-animal-products/animal-products/milk-and-milk-products_en.
European Commission. 2019b. Le nouvel accord UE-Mercosur. L’accord de principe (28 juin 2019).
Eurostat. 2019. Agriculture, forestry and fishery statistics. Statistical books.
Ferragina, A., C. Cipolat-Gotet, A. Cecchinato, and G. Bittante. 2013. The use of Fourier-transform infrared spectroscopy to predict cheese yield and nutrient recovery or whey loss traits from unprocessed bovine milk samples. J. Dairy Sci. 96:7980–7990. https://doi.org/10.3168/jds.2013-7036.
Federal Public Service (FPS) Public Health. 2018. Belgian National Debate on Carbon Pricing: Final Report.
Gengler, N., H. Soyeurt, F. Dehareng, C. Bastin, F. Colinet, H. Hammami, M.L. Vanrobays, A. Lainé, S. Vanderick, C. Grelet, A. Vanlierde, E. Froidmont, and P. Dardenne. 2016. Capitalizing on fine milk composition for breeding and
management of dairy cows. J. Dairy Sci. 99:4071–4079.
https://doi.org/10.3168/jds.2015-10140.
Gillon, A., S. Abras, P. Mayeres, C. Bertozzi, and N. Gengler. 2010. Adding value to test-day data by using modified best prediction method. Proc. ICAR 37th Annu. Meet. 1–8.
Grelet, C., C. Bastin, M. Gelé, J.-B. Davière, M. Johan, A. Werner, R. Reding, J.A. Fernandez Pierna, F.G. Colinet, P. Dardenne, N. Gengler, H. Soyeurt, and F. Dehareng. 2016. Development of Fourier transform mid-infrared calibrations to predict acetone, β-hydroxybutyrate, and citrate contents in bovine milk through a
European dairy network. J. Dairy Sci. 99:4816–4825.
https://doi.org/10.3168/jds.2015-10477.
Grelet, C. 2019. Promoting international prediction models through standardization of milk mid-infrared spectra. Doctoral thesis. Gembloux Agro-Bio Tech, Université de Liège, Belgium.
Grelet, C., E. Froidmont, L. Foldager, M. Salavati, M. Hostens, C.P. Ferris, M.A. Crowe, M.T. Sorensen, J.A.F. Pierna, A. Vanlierde, N. Gengler, G. Consortium, F. Dehareng, M. Salavati, Z. Cheng, A. Fouladi, G. Pollott, M. Bell, M. Vaneetvelde, K. Hermans, and M. Hostens. 2020. Potential of milk mid-infrared
Chapter 1 : General introduction
15
spectra to predict nitrogen use efficiency of individual dairy cows in early lactation. J. Dairy Sci. 103:4435–4445. https://doi.org/10.3168/jds.2019-17910. Heinemann, P.H. 2009. Decision support systems for food and agriculture. Pages
122-135 in Systems analysis and modeling in food and agriculture. K.C. Ting, D.H. Fleisher, L.F. Rodriguez, ed. EOLSS Publishers, Oxford, UK.
Ho, P.N., V. Bonfatti, T.D.W. Luke, and J.E. Pryce. 2019. Classifying the fertility of dairy cows using milk mid-infrared spectroscopy. J. Dairy Sci. 102:10460– 10470. https://doi.org/10.3168/jds.2019-16412.
Hostiou, N., J. Fagon, S. Chauvat, A. Turlot, F. Kling-Eveillard, X. Boivin, and C. Allain. 2017. Impact of precision livestock farming on work and human-animal interactions on dairy farms. A review. Biotechnol. Agron. Soc. Environ. 21:268– 275. https://doi.org/ 10.25518/1780-4507.13706.
International Committee for Animal Recording (ICAR). 2017. Section 2 - Guidelines for dairy cattle milk recording. Int. Comm. Anim. Record., Rome, Italy.
Jago, J., C. Eastwood, K. Kerrisk, and I. Yule. 2013. Precision dairy farming in Australasia: adoption, risks and opportunities. Anim. Prod. Sci. 53:907–916. https://doi.org/10.1071/AN12330.
Khan, S.A., S.B. Khan, L.U. Khan, A. Farooq, K. Akhtar, and A.M. Asiri. 2018. Fourier transform infrared spectroscopy: fundamentals and application in functional groups and nanomaterials characterization. Pages 317-344 in Handbook of materials characterization. S.K. Sharma, ed. Springer International, Switzerland.
Koeck, A., J. Jamrozik, F.S. Schenkel, R.K. Moore, D.M. Lefebvre, D.F. Kelton, and F. Miglior. 2014. Genetic analysis of milk β-hydroxybutyrate and its association with fat-to-protein ratio, body condition score, clinical ketosis, and displaced abomasum in early first lactation of Canadian Holsteins. J. Dairy Sci. 97:7286– 7292. https://doi.org/10.3168/jds.2014-8405.
Koivula, M., J.I. Nousiainen, J. Nousiainen, and E.A. Mäntysaari. 2007. Use of herd solutions from a random regression test-day model for diagnostic dairy herd management. J. Dairy Sci. 90:2563–2568. https://doi.org/10.3168/jds.2006-517. La Spina, S. Quel etat de santé pour notre agriculture wallonne ? Echangeons sur notre
agriculture ! Accessed Jan. 17, 2020.
https://agriculture-natpro.be/2014/04/01/quel-etat-de-sante-de-notre-agricult.
Maurice-Van Eijndhoven, M.H.T., H. Soyeurt, F. Dehareng, and M.P.L. Calus. 2013. Validation of fatty acid predictions in milk using mid-infrared spectrometry
across cattle breeds. Animal 7:348–354.
https://doi.org/10.1017/S1751731112001218.
McParland, S., G. Banos, E. Wall, M.P. Coffey, H. Soyeurt, R.F. Veerkamp, and D.P. Berry. 2011. The use of mid-infrared spectrometry to predict body energy status of Holstein cows. J. Dairy Sci. 94:3651–3661. https://doi.org/10.3168/jds.2010-3965.
Developing decision-support tools using milk mid-infrared spectrometry
16
McParland, S., E. Lewis, E. Kennedy, S.G. Moore, B. McCarthy, M. O’Donovan, S.T. Butler, J.E. Pryce, and D.P. Berry. 2014. Mid-infrared spectrometry of milk as a predictor of energy intake and efficiency in lactating dairy cows. J. Dairy Sci. 97:5863–5871. https://doi.org/10.3168/jds.2014-8214.
Meynard, J.-M., M. Cerf, L. Guichard, M.-H. Jeuffroy, and D. Makowski. 2002. Which decision support tools for the environmental management of nitrogen? Agron. EDP Sci. 23:407–418. https://doi.org/10.1051/agro:2002064.
Moureaux, B. Les OAD vont-ils révolutionner le métier d’agriculteurs ? Accessed Jan. 17, 2020. https://www.arvalis-infos.fr/les-outils-d-aide-a-la-decision-modifient-ils-le-metier-d-agriculteur--@/view-23316-arvarticle.html.
Norton, T., and D. Berckmans. 2017. Developing precision livestock farming tools
for precision dairy farming. Anim. Front. 7:18–23.
https://doi.org/10.2527/af.2017.0104.
Raiten, D.J., and G.F. Combs. 2019. Nutritional Ecology: understanding the intersection of climate/environmental change, food systems and health. Pages 68-80 in: Agriculture for Improved Nutrition: Seizing the Momentum. S. Fan, S. Yosef and R. Pandya-Lorch, ed. CABI International, Boston, USA.
Rose, D.C., W.J. Sutherland, C. Parker, M. Lobley, M. Winter, C. Morris, S. Twining, C. Ffoulkes, T. Amano, and L. V. Dicks. 2016. Decision support tools for agriculture: Towards effective design and delivery. Agric. Syst. 149:165–174. https://doi.org/10.1016/j.agsy.2016.09.009.
Rutten, M.J.M., H. Bovenhuis, J.M.L. Heck, and J.A.M. van Arendonk. 2011. Predicting bovine milk protein composition based on Fourier transform infrared spectra. J. Dairy Sci. 94:5683–5690. https://doi.org/10.3168/jds.2011-4520. Santschi, D.E., D. Warner, and D.M. Lefebvre. 2019. Implementation of a routine FT
‐ IR procedure for fatty acid analysis in bulk tank milk Milk fatty acids : wy do we want them ? ICAR annual conference, Pragues, Czech Republic.
Scampicchio, M., D. Eisenstecken, L. De Benedictis, C. Capici, D. Ballabio, T. Mimmo, P. Robatscher, L. Kerschbaumer, M. Oberhuber, A. Kaser, C.W. Huck, and S. Cesco. 2016. Multi-method approach to trace the geographical origin of alpine milk: a case study of tyrol region. Food Anal. Methods 9:1262–1273. https://doi.org/10.1007/s12161-015-0308-2.
Seneviratne, S., N. Nicholls, D. Easterling, C. Goodess, S. Kanae, J. Kossin, Y. Luo, J. Marengo, K. McInnes, M. Rahimi, M. Reichstein, A. Sorteberg, C. Vera, and X. Zhang. 2012. Changes in climate extremes and their impacts on the natural physical environment. Pages 109-230 Managing the risk of extreme events and disasters to advance climate change adaptation. A special report of working groups I and II of the Intergovernmental Panel on Climate Change (IPCC). ed. Cambridge University Press, Cambridge, UK, and New York, NY, USA. Subramanian, A., and L. Rodriguez-Saona. 2009. Fourier transform infrared (FTIR)
spectroscopy. Pages 145-178 in Infrared spectroscopy for food quality analysis and control. D.W Sun, ed. Academic Press, New York, NY, USA.
Chapter 1 : General introduction
17
Soyeurt, H., P. Dardenne, F. Dehareng, G. Lognay, D. Veselko, M. Marlier, C. Bertozzi, P. Mayeres, and N. Gengler. 2006. Estimating fatty acid content in cow milk using mid-infrared spectrometry. J. Dairy Sci. 89:3690–3695. https://doi.org/10.3168/jds.s0022-0302(06)72409-2.
Soyeurt, H., F.G. Colinet, V.M.R. Arnould, P. Dardenne, C. Bertozzi, R. Renaville, D. Portetelle, and N. Gengler. 2007. Genetic variability of lactoferrin content estimated by mid-infrared spectrometry in bovine milk. J. Dairy Sci. 90:4443– 4450. https://doi.org/10.3168/jds.2006-827.
Soyeurt, H., D. Bruwier, J.-M. Romnee, N. Gengler, C. Bertozzi, D. Veselko, and P. Dardenne. 2009. Potential estimation of major mineral contents in cow milk using
mid-infrared spectrometry. J. Dairy Sci. 92:2444–2454.
https://doi.org/10.3168/jds.2008-1734
Soyeurt, H., E. Froidmont, I. Dufrasne, D. Hailemariam, Z. Wang, C. Bertozzi, F.G. Colinet, F. Dehareng, and N. Gengler. 2019. Contribution of milk mid-infrared spectrum to improve the accuracy of test-day body weight predicted from stage, lactation number, month of test and milk yield. Livest. Sci. 227:82–89. https://doi.org/10.1016/j.livsci.2019.07.007.
Turlot, A. Organisation du travail dans des exploitations wallonnes. Accessed Jan.17, 2020. http://www.cra.wallonie.be/fr/organisation-du-travail-dans-des-exploitations-wallonnes.
Valacta, 2011. Cétolab. https://www.valacta.com/_media/document/858/v2k-22f1-rpt50600f-cetolab-doc-explic-uv-qc-2011-05-6p-pays-port-3.pdf.
Van der Drift, S.G.A., R. Jorritsma, J.T. Schonewille, H.M. Knijn, and J.A. Stegeman. 2012. Routine detection of hyperketonemia in dairy cows using Fourier transform infrared spectroscopy analysis of β-hydroxybutyrate and acetone in milk in combination with test-day information. J. Dairy Sci. 95:4886–4898. https://doi.org/10.3168/jds.2011-4417.
Vandreck, S. 2018. Si les exploitations ne misent pas sur la durabilité, elles sont
vouées à disparaître. Accessed Jan. 17, 2020.
https://www.rtbf.be/info/regions/detail_si-les-exploitations-ne-misent-pas-sur-la-durabilite-elles-sont-vouees-a-disparaitre?id=9979305.
Vanlierde, A., H. Soyeurt, N. Gengler, F.G. Colinet, E. Froidmont, M. Kreuzer, F. Grandl, M. Bell, P. Lund, D.W. Olijhoek, M. Eugène, C. Martin, B. Kuhla, and F. Dehareng. 2018. Short communication: Development of an equation for estimating methane emissions of dairy cows from milk Fourier transform mid-infrared spectra by using reference data obtained exclusively from respiration chambers. J. Dairy Sci. 101:7618–7624. https://doi.org/10.3168/jds.2018-14472. Vanlierde, A., M.L. Vanrobays, N. Gengler, P. Dardenne, E. Froidmont, H. Soyeurt, S. McParland, E. Lewis, M.H. Deighton, M. Mathot, and F. Dehareng. 2016. Milk mid-infrared spectra enable prediction of lactation-stage-dependent methane emissions of dairy cattle within routine population-scale milk recording schemes. Anim. Prod. Sci. 56:258–264. https://doi.org/10.1071/AN15590.
Developing decision-support tools using milk mid-infrared spectrometry
18
Visentin, G., A. McDermott, S. McParland, D.P. Berry, O.A. Kenny, A. Brodkorb, M.A. Fenelon, and M. De Marchi. 2015. Prediction of bovine milk technological traits from mid-infrared spectroscopy analysis in dairy cows. J. Dairy Sci. 98:6620–6629. https://doi.org/10.3168/jds.2015-9323.
Wezel, A., M. Casagrande, F. Celette, J.F. Vian, A. Ferrer, and J. Peigné. 2014. Agroecological practices for sustainable agriculture. A review. Agron. Sustain. Dev. 34:1–20. https://doi.org/10.1007/s13593-013-0180-7.
2
2:
Diagnosing the pregnancy status of dairy
cows: how useful is milk
mid-infrared spectrometry?
Chapter 2: Diagnosing the pregnancy status of dairy cows using milk MIR spectra
21
Adapted from: Delhez, P., P.N. Ho, N. Gengler, H. Soyeurt, and J.E. Pryce. 2020. Diagnosing the pregnancy status of dairy cows: How useful is milk
mid-infrared spectroscopy? J. Dairy Sci. 103: 3264-3274. https://doi.org/10.3168/jds.2019-17473
Outline
Pregnancy is a meaningful trait for dairy farms’ sustainability because of its economic importance. Being able to detect early pregnancy is particularly useful to know if a cow should be re-bred or to forecast calving dates. Previous research achieved limited results in predicting the pregnancy status of dairy cows using MIR and suggested that further research would be needed on this topic. The interest in predicting pregnancy using MIR originates from the fact that pregnancy establishment would result in changing milk composition. Therefore, this chapter investigated innovative strategies to attempt to find a successful approach to diagnose pregnancy using a MIR calibration equation. This study was conducted using milk MIR spectra and records of insemination from Australian dairy cows. The algorithm used to calibrate the equations developed in the article mentioned in this chapter was partial least squares discriminant analysis (PLS-DA). However, alternative machine learning algorithms were also tested and are presented in section 2.3.1 of Chapter 5.