Available online at scholarcommons.usf.edu/ijs
International Journal of Speleology
Off icial Journal of Union Internationale de SpéléologieINTRODUCTION
Carbon dioxide (CO2) is a key component controlling
the karst processes such as limestone dissolution and calcite speleothem growth (Dreybrodt, 1999). The driving force for the latter process is the difference in the CO2 partial pressure between (1) the soil/
upper epikarst, (EK)P
CO2, and (2) the cave atmosphere, (C)P
CO2 (White, 1998; Ford & Williams, 2007). Whereas
a high (EK)P
CO2 (Fairchild et al., 2000; Faimon et al.,
2012a) controls saturation of percolating water with respect to the calcite, the lower (C)P
CO2 is responsible
for dripwater degassing (releasing of the CO2 excess)
(Holland et al., 1964).
The instantaneous CO2 concentration in the cave
atmosphere is the balance of the input and output fluxes. The input CO2 flux may generally include the
direct natural fluxes associated with (i) the diffusion from soils/epikarst, (ii) dripwater degassing (Bourges et al., 2001), perhaps (iii) microbial decay of organic matter in cave sediments, and (iv) the transport of endogenous CO2 in geologically active regions
(Batiot-Citation: Keywords:
Abstract: The evolution of CO2 levels with and without human presence was studied in a selected site
(Gallery Chamber) of the homothermic zone of the Balcarka Cave (Moravian Karst, Czech Republic) during the fall, a period of limited ventilation. There were recognized various factors controlling the cave CO2 levels under different conditions in the exterior and interior. When
visitors were absent, CO2 levels were controlled by the advective CO2 fluxes linked to cave
airflows and reaching up to ~1.5 x 10⁻³ mol s-1. These fluxes exceed by orders of magnitude
the exchanged diffusive fluxes (up to 4.8 x 10⁻⁸ mol s-1) and also the natural net flux (from
1.7 x 10⁻⁶ to 6.7 x 10⁻⁶ mol s-1) imputing given chamber directly from overburden. The natural
net flux, normalized to unitary surface area, was estimated to be 2.8 x 10⁻⁸ to 1.1 x 10⁻⁷ mol m-2
s-1, based on a perpendicular projection area of the chamber of ~60 m2. When visitors were
present, the anthropogenic CO2 flux into the chamber reached up to 3.5 x 10⁻³ mol s-1, which
slightly exceeded the advective fluxes. This flux, recalculated per one person, yields the value of 6.7 x 10⁻⁵ mol s-1. The calculations of reachable steady states indicate that anthropogenic
fluxes could almost triple the natural CO2 levels if visitors stayed sufficiently long in the cave.
anthropogenic and natural CO2; cave ventilation; flux; dynamic model; temperature difference
Received 11 July 2014; Revised 30 January 2015; Accepted 2 March 2015
Lang M., Faimon J. and Ek C., 2015. The relationship between carbon dioxide concentration and visitor numbers in the homothermic zone of the Balcarka Cave (Moravian Karst) during a period of limited ventilation. International Journal of Speleology, 44 (2), 167-176. Tampa, FL (USA) ISSN 0392-6672 http://dx.doi.org/10.5038/1827-806X.44.2.6
The relationship between carbon dioxide concentration and
visitor numbers in the homothermic zone of the Balcarka
Cave (Moravian Karst) during a period of limited ventilation
Marek Lang
1, Jiří Faimon
1, and Camille Ek
21Department of Geological Sciences, Faculty of Sciences, Masaryk University, Kotlářská 2, 611 37 Brno, Czech Republic 2Department of Geology, University of Liège, 4000 Liège, Belgium
Guilhe et al., 2007). The indirect CO2 fluxes can be
derived from air advection from (v) adjacent cave passages/epikarst, or e.g. (vi) a cave river and conduit flow. The anthropogenic flux is connected with (vii) the exhaling of cave visitors (Faimon et al., 2006; Milanolo & Gabrovšek, 2009). The output flux is linked with cave airflow and controlled by cave ventilation (Spötl et al., 2005; Banner et al., 2007; Baldini et al., 2008; Fernández-Cortes et al., 2009).
The cave airflow depends on (1) the cave geometry and (2) the pressure difference resulting from contrasting air densities (de Freitas et al., 1982). Since density is particularly a function of temperature, cave airflows are mostly related to the temperature difference DT = Texterior– Tcave (where Texterior is external air
temperature and Tcave is cave air temperature [°C]) (de
Freitas et al., 1982; Baker & Genty, 1998; Pflitsch & Piasecki, 2003; Russell & MacLean, 2008; Kowalczk & Froelich, 2010; Faimon et al., 2012b). A theoretical background on cave air circulation was given by Cigna (1968) and Wigley & Brown (1971). Based on their geometry, caves may be sorted into two extreme
numbers. The model aims at contributing to a better knowledge of the parameters controlling CO2
levels in a visiting cave under specific conditions of changing ventilation. Overall, the article could help in better understanding recent karst processes.
SITE OF STUDY
The site of study, the Balcarka Cave, is situated in the northern part of the Moravian Karst near the village of Ostrov u Macochy (Faimon et al., 2012c). The sketch map of the cave with characteristic sites and their positions at different altitudes is illustrated in Fig. 1a. The cave was formed in the Devonian limestone of the Macocha Formation. It consists of two levels of narrow corridors, totaling about 350 m in length with chambers rich in speleothem formations. The height distance between both cave levels is about 20 m. The overburden thickness reaches up ~40 m (Fig. 1b). The same distance is probably between the levels of the lowest and highest openings. The complex cave geometry with three known entrances and more hidden openings at different altitudes ensures the dynamic behavior of air circulation. The Gallery Chamber in deeper cave passages (in the second cave level) was chosen as the monitoring site (Fig. 1a). groups: (1) static caves with one entrance and (2)
dynamic caves with two or more entrances at different altitudes (Geiger, 1966; Bögli, 1978). Whereas the static caves are ventilated for half of the season, the dynamic caves ventilate during the whole year by a so-called chimney effect. The transition between static caves and dynamic caves is represented by a statodynamic cave, defined by more than one entrance at the same altitude (Luetscher & Jeannin, 2004b). Some parts of the cave have features of a static cave, whereas other parts behave as a dynamic cave. If DT < 0, upward airflows occur in the cave, i.e., external air enters the cave at the lower entrance and flows out from the cave by the upper entrance. This regime is called the upward airflow ventilation mode (UAF mode). If DT > 0, cave airflows move in the opposite way. In this case, we talk about the downward airflow ventilation mode (DAF mode) (see Faimon et al., 2012a for details). According to the extent of temperature variations in the cave environment, (1) heterothermic zones (passages closer to cave entrances) and (2) homothermic zones (deeper cave passages) are defined (Luetscher & Jeannin, 2004b). Whereas the heterothermic zone is strongly influenced by external temperature, the homothermic zone is characterized by temperature stability. Two different ventilation periods can be distinguished
in cave: (i) the period of active ventilation and (ii) the period of limited ventilation (Faimon et al., 2012b). In the active ventilation period, the duration of the individual ventilation mode exceeds the air residence time in the cave. In such a case, the air in the whole cave is completely exchanged. In the limited ventilation period, the duration of the actual ventilation mode is shorter than the air residence time in the cave. Then the direction of the airflow turns before the cave air is completely replaced by air from the external atmosphere (only the cave-entering passages are ventilated). Previous works on anthropogenically-impacted cave CO2 were presented by,
e.g., Pulido-Bosch et al. (1997), Song et al. (2000), Faimon et al. (2006), Liñán et al. (2008),
Fernández-Cortes et al. (2009), Milanolo & Gabrovšek (2009) or Lario & Soler (2010). In this work, we focus on the anthropogenically-impacted CO2 in the
homothermic zone of the Balcarka Cave, a dynamic cave in the Moravian Karst (Czech Republic). The study was conducted when the ventilation modes changed diurnally and when the cave persisted in the period of limited ventilation. The goal of this work was to propose the dynamic model that would simulate evolution of cave CO2 levels based on
routinely available data: temperatures and visitor
Fig. 1. Balcarka Cave: the sketch map with its position (a) and the altitude diagram of the individual cave passages (b). The letters denote the monitoring sites from the diagram.
The site is part of the homothermic zone. The chamber volume was estimated to ~150 m3. The cave is
seasonally open to tourists with a total attendance of 30,000 to 40,000 persons per year. In the area above the Balcarka Cave, three soil types were identified: Anthrosol, lithic Leptosol, and brown rendzic Leptosol based on the vegetation such as pastures, mixed forest, and karst meadows, respectively (see Faimon et al., 2012c for details). The annual temperature of the external atmosphere at the given site is of ~8°C. The total annual precipitation is ~700 mm.
METHODS
Data were collected during three monitoring campaigns between September and November 2013. A monitoring schedule is given in Table 1. In addition to the number of visitors, the cave CO2 concentrations
and the temperatures of cave air and external air were monitored. Airflow velocities were calculated from the temperature differences (see Faimon & Lang, 2013). Airflow direction was deduced from the sign
Monitoring
Campaign Date [hours]Period Number of tours Visitors totally Campaign I 28-30 Sept. 2013 48 16 265 Campaign II 19-21 Oct. 2013 48 11 176 Campaign III 2-4 Nov. 2013 48 6 124 Table 1. Monitoring schedule (Balcarka Cave, Moravian Karst).
of temperature differences and checked at the cave door positions. The CO2 concentration was measured
in the Gallery Chamber at 1 meter above the cave floor. It was detected by a 2-channel IR-detector FT A600-CO2H (measuring range: 0 to 10,000 ppmv; accuracy: ±50 ppmv + 2 vol. % of measured value in the range of 0 to 5000 ppmv; resolution: 1 ppmv or 0.0001 vol. %) linked to the ALMEMO 2290-4 V5 Ahlborn data logger (Germany). The volume concentrations (in ppmv units) were subsequently recalculated into molar concentration (mol m-3), based on the
Ideal Gas Law and given temperature and pressure,
where P is barometric pressure [Pa], R is the universal gas constant [R = 8.3144621 J kg-1 K-1] and T is temperature [K].
The temperature was logged (i) in the exterior, about 50 m outside the cave, and (ii) inside the cave, about 100 m from the cave entrance. It was measured by COMET S3120 dataloggers (measuring range from - 30 to + 70°C with a precision of ±0.4°C) (TR Instruments Inc., Czech Republic).
The variables were logged at 1-minute step (Campaigns 1 and 3) and 2-minute step (Campaign 2). The number of visitors in an individual tour was registered before their entering the cave. The moment of visitor entry into the monitoring site (due to the visitor moving with guide’s commentary) was delayed by 33 ± 0.1 minutes. The length of stay in the site was 5-20 minutes (8.1 ± 5.9 min on average), based on the guide’s commentary and visitor number. The initial time of interaction of visitors with the cave environment and the length of stay were finely tuned so that they were consistent with the CO2 concentration peak.
The sensitivity analysis was conducted using the program TopRank 6 (2014).
RESULTS
Monitoring Campaign I
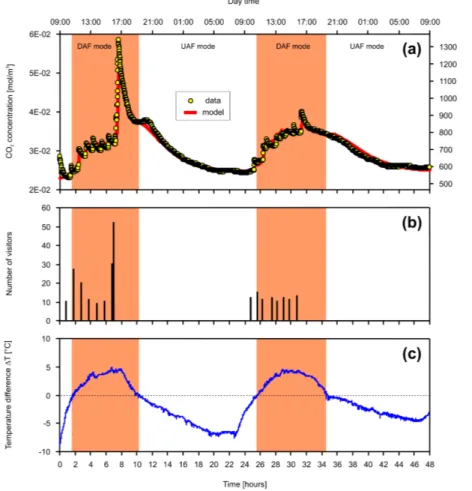
During Campaign I, covering a total of 48 hours (see Table 1 for details), the monitoring was conducted at a temperature difference, DT = Texternal - Tcave, ranging
between -8.8 and 4.9°C (Fig. 2c). Two ventilation modes were identified/predicted: (1) downward airflow ventilation mode (DAF) at positive DT and (2) upward airflow ventilation mode (UAF) at negative DT. The CO2
concentrations in the chamber varied in a wide range depending on the temperature difference and the number of visitors (Fig. 2a). During the DAF modes, enhanced CO2 concentrations of about 3.45 x 10⁻² mol m-3
(800 ppmv) on average were registered. Sharp peaks of the values superimposed on “natural” CO2 levels correspond
very well to attendance and represent the anthropogenic impact on the CO2 concentrations in the chamber.
The heights of peaks corresponded to (i) the number of visitors in individual tours and (ii) staying period in the chamber. In the case of maximum attendance (52 visitors), the peak CO2 concentration reached up to
5.83 x 10⁻² mol m-3 (1350 ppmv). During the UAF mode,
no visitors stayed in the cave. The CO2 concentrations
decreased to 2.50 x 10⁻² mol m-3 (578 ppmv) on average.
Monitoring Campaign II
This 48-hour campaign (see Table 1) ran at a temperature difference DT varying from -9.8 to 10.4°C (Fig. 3c). The CO2 concentrations varied depending
on the temperature difference (DAF mode or UAF mode) and the number of visitors (Fig. 3a). During
Fig. 2. Monitoring of Campaign I (28-30 September 2013; Gallery Chamber, Balcarka Cave). There are data on CO2 concentrations (the red line represents modeled curve) (a), visitor numbers (b), and temperature difference ∆T (c). See text for details.
the DAF modes, natural CO2 concentrations varied
about 3.00 x 10⁻² mol m-3 (700 ppmv). The peak values
corresponding to 37 visitors reached up to 4.52 x 10⁻²
mol m-3 (1040 ppmv). During the UAF mode (without
visitors), the CO2 concentrations decreased to
2.60 x 10⁻² mol m-3 (600 ppmv).
Monitoring Campaign III
This 48-hour campaign (see Table 1) ran at a temperature difference DT ranging from -8.7 to 1.4°C (Fig. 4c). The resulting CO2 concentrations in
the chamber varied in a narrow range depending on the temperature difference and the number of
Fig. 3. Monitoring of Campaign II (19-21 October 2013; Gallery Chamber, Balcarka Cave). There are data on CO2 concentrations (the red line represents modeled curve) (a), visitor numbers (b), and temperature difference ∆T (c). See text for details.
Fig. 4. Monitoring of Campaign III (2-4 November 2013; Gallery Chamber, Balcarka Cave). There are data on CO2 concentrations (the red line is modeled curve) (a), visitor numbers (b), and temperature difference ∆T (c). See text for details.
visitors (Fig. 4a). During the DAF modes, natural CO2 concentrations varied about
3.00 x 10⁻² mol m-3 (693 ppmv) on average.
The peak values (at 32 visitors) reached up to 3.68 x 10⁻² mol m-3 (850 ppmv).
During the UAF mode, when no visitors were in the cave, CO2 concentrations
decreased to 2.50 x 10⁻² mol m-3
(578 ppmv).
DATA ANALYSIS
To evaluate the significant variables/ parameters driving the CO2 concentrations
and to better understand the relations between them, a dynamic model was proposed that would simulate the evolution of CO2 levels in the chamber. The model is
based on the idea that the instantaneous CO2 concentrations are given by balancing
all the CO2 fluxes into/out of the chamber.
The conceptual model is depicted in Fig. 5. It consists of three reservoirs, the chamber of interest and two further adjacent spaces, and six fluxes among them: (1) the direct net natural flux into the Gallery Chamber from its overburden, jN (associated with
e.g. direct diffusion of CO2 from soils/epikarst through
the chamber roof and/or dripwater degassing), (2) the anthropogenic flux jA (stemming from a person exhaling),
(3) the advective input flux jaindv from an adjacent cave
space (driven by ventilation), (4) the advective output flux from the chamber jaoudvt (driven by ventilation), (5) the
diffusive input flux from an adjacent space jdinif, and (6)
the diffusive output flux out of the chamber jdouift. Note that
the advective input/output fluxes from/into adjacent spaces changed with each other with switching of the ventilation mode. The fluxes heading into the reservoir of interest (Gallery Chamber) are taken as positive, the fluxes heading out of the reservoir are negative. The
total CO2 flux into the reservoir, j [mol s-1],
is given by the sum of all individual fluxes, (2) where nCO2 is the total content of carbon
dioxide in the chamber atmosphere [mol], t is time [s], V is the chamber volume [m3],
c is instantaneous CO2 concentration in
the chamber atmosphere [mol m-3], and j i
are fluxes [mol s-1].
The direct flux jN was presumed to be
constant during monitoring; it was found as one of the model parameters.
Anthropogenic CO2 flux, jA, was
quantified as
jA = kA A (3)
where kA is a constant representing an
anthropogenic personal flux [mol s-1] and
The advective fluxes, jaindv and jaoudvt, respectively, were
expressed as a function of concentrations and airflows: jaindv = v cadj (4)
and
jaoudvt = -v c (5)
(6)
where DT = Texterior – Tcave [°C] and kDT is a
proportionality constant [m3 s-1 deg-1/2].
The input and output diffusive fluxes, jdinif, and
jdouift, respectively, were expressed as
(7) (8) and
where D is a diffusion coefficient of CO2 in the cave
atmosphere [m2 s-1], S is the cave cross-section [m2],
and L is the distance, for which the concentration gradient, Dc [m], is given. Eqns. (7) and (8) are relevant for both the DAF and UAF modes.
Based on expected reasonable values of parameters, D ~1.36 x 10⁻⁵ m2 s-1 (Welty et al., 2008), S ~10 m2, L ~100 m, v ~0.04 m3 s-1, V ~150 m3, c a(1)dj ~1.7 x 10⁻² mol m-3, c ~3–6 x 10⁻² mol m-3, c a (2) dj ~2–4 x 10⁻² mol
m-3, the advective fluxes vary in the range of (1.1-1.5)
(9) for the DAF ventilation mode. Eqn. (9) changes into
(10)
Values
Parameters Campaign 1 Campaign 2 Campaign 3 jN [mol s-1] 6.67 x 10⁻⁶ 1.67 x 10⁻⁶ 5.00 x 10⁻⁶ cadj DAF1 [mol m-3] 3.00 x 10⁻² 2.95 x 10⁻² 2.65 x 10⁻² cadj DAF2 [mol m-3] 3.30 x 10⁻² 3.20 x 10⁻² 2.70 x 10⁻² cadj UAF1 [mol m-3] 2.43 x 10⁻² 2.40 x 10⁻² 2.50 x 10⁻² cadj UAF2 [mol m-3] n.u. 2.55 x 10⁻² 2.25 x 10⁻² cadj UAF3 [mol m-3] n.u. 2.80 x 10⁻² n.u.
kA [mol s-1] 6.67 x 10⁻⁵ 4.00 x 10⁻⁵ 5.33 x 10⁻⁵ k∆T DAF [m3 s-1 deg-1/2] 1.50 x 10⁻² 1.67 x 10⁻² 4.83 x 10⁻² k∆T UAF [m3 s-1 deg-1/2] 7.30 x 10⁻³ 7.47 x 10⁻³ 5.83 x 10⁻³
n.u. - not used
Table 2. Regression parameters resulting from the modeling of individual monitoring campaigns (Gallery Chamber, Balcarka Cave).
concentration in the chamber [mol m-3],
and cadj is CO2 concentration in the relevant
adjacent cave space serving as a sourcing reservoir [mol m-3]. As c
adj, ca(2)dj was applied
for the DAF ventilation mode and ca(1)dj was
used for the UAF mode. Based on Faimon & Lang (2013), the volumetric airflow was calculated from temperature differences, where v is the volumetric velocity of airflow through the cave chamber [m3 s-1], c is CO
2
in the case of the UAF mode, due to change in the input advective flux jaindv.
For both the ventilation modes, eqns. (9) and (10) were solved numerically. The little significant diffusive fluxes (the last terms in eqns. 9 and 10) were ignored in modeling for simplicity. Initially, values of the model parameters (jN, cadj, kA, kDT) were roughly set by
trial and error so that the model curve best fit the data set. Important criteria for such fitting were (1) correspondence of data with the model at DT maxima/ minima and at DT = 0 in the periods without visitors and (2) heights of the CO2 peaks at visitor presence.
Consecutively, detail values of the parameters were exactly determined by the least square method. The loss function was minimized by the Levenberg-Marquardt method (Marquardt, 1963). Results of the modeling are presented in Figs. 2, 3, and 4 as thick red lines; the found regression parameters are given in Table 2.
Fig. 5. Conceptual model of CO2 dynamics in the atmosphere of the Gallery Chamber during the DAF ventilation mode (a) and UAF ventilation mode (b).
x 10-3 mol s-1, whereas the diffusive fluxes do not
reach the values of 4.8 x 10⁻⁸ mol s-1.
Inserting all the fluxes into eqn. (2) and rearranging gives
The cadj concentrations varied in the range of
(2.65-3.30) x 10-2 mol m-3 (i.e., 620-770 ppmv) during the
DAF mode and (2.25-2.8) x 10-2 mol m-3 (530-660 ppmv)
during the UAF mode. The kDT values were determined
in the range of (1.50-4.83) x 10-2 m3 s-1 deg-1/2 (DAF
mode) and (5.83-7.47) x 10-3 m3 s-1 deg-1/2 (UAF mode).
The calculated advective fluxes, jadv, (see Table 3)
were consistent with those (1.1-1.5) x 10-3 mol s-1
estimated former.
The kA values were found in the narrow range of
(4.00-6.67) x 10-5 mol s-1 (Table 2). Based on eqn. (6)
and the number of visitors (Fig. 2-4), the instantaneous anthropogenic CO2 fluxes, jA, varied in the ranges:
6.0 x 10⁻⁴ to 3.5 x 10⁻³ mol s-1 (campaign I), 1.2 x 10⁻⁴
to 1.5 x 10⁻³ mol s-1 (campaign II), and 6.9 x 10⁻⁴ to
Direct natural flux (jN) varied in the range of
(1.67-6.67) x 10-6 mol s-1. All fluxes are summarized
in Tables 2 and 3. The chamber total volume V ~150 m3
was used for modeling.
The maximum reachable CO2 concentration under
given conditions is consistent with the steady state, at which the change of concentration in the chamber is zero, dc/dt = 0. For the DAF ventilation mode, during which visitors are in the cave, eqn. (9) yields
Flux Campaign 1 Campaign 2 Campaign 3
jA [mol s-1] 6.0 x 10⁻⁴ to 3.5 x 10⁻³ 1.2 x 10⁻⁴ to 1.5 x 10⁻³ 6.9 x 10⁻⁴ to 1.7 x 10⁻³ jadv (in) [mol s-1] up to 1.1 x 10⁻³ up to 1.5 x 10⁻³ up to 1.3 x 10⁻³ jdif [mol s-1] up to 4.8 x 10⁻⁸ up to 2.7 x 10⁻⁸ up to 1.6 x 10⁻⁸ Table 3. Overview of CO2-fluxes based on modeling (Gallery Chamber, Balcarka Cave).
(11)
(12) and after rearranging,
where css is a steady state of CO
2 concentration in the
chamber [mol m-3].
The effect of the relevant variables (DT and A) and key parameters (jN and cadj) on the cave CO2
concentrations was tested by the standard sensitivity analysis. Generally, the method is used for assessing the contribution of individual driving variables/ parameters to the increment/decrement of the dependent variable (see Saltelli et al., 2004). The analysis was applied to eqn. (12), in which the achievable CO2 level, i.e., the steady state concentration, css, is a
function of relevant driving variables/parameters. The calculation was based on the average values of the kA = 5.3 x 10⁻⁵ mol s-1 and kDT = 2.67 x 10⁻² m3 s-1 deg-1/2
(found by modeling) and the values used for the flux estimating (D ~1.36 x 10⁻⁵ m2 s-1, S ~10 m2, L ~100 m,
v ~0.04 m3 s-1, V ~150 m3, and c a (1)
dj ~1.7 x 10⁻² mol m-3).
The individual inputs for the analysis covered the range of parameters/variables found by modeling (Table 2). Results of the sensitivity analysis are presented in Fig. 6. During the natural regime without visitors (A = 0), the concentrations in adjacent spaces, cadj, have
the most significant effect on CO2 levels (Fig. 6a). The
effect of the temperature difference DT and direct natural flux (jN) are either small or almost negligible, respectively.
For the regime with visitors, the results are very different: the CO2 levels are extremely affected by DT (Fig. 6b). The
variations in DT may almost triple the CO2 level in the
chamber in comparison with the visitor number (A) and even quadruple in comparison with the adjacent space concentrations,ca(2)dj. The role of the direct natural flux is
similarly insignificant as in the regime without visitors. In the case of DT >> 0, the effect of DT diminishes (Fig. 6c).
DISCUSSION
The natural CO2 concentrations between 2 x 10⁻² and
3 x 10⁻² mol m-3 (460 and 700 ppmv) found in the
Balcarka Cave are roughly consistent with the values reported by Spötl et al. (2005) for the Obir Caves (Austria), Baldini et al. (2006) for the Ballynamintra Cave (Ireland) or with those measured by Liñán et al. (2008) in the Nerja Cave (Spain). In contrast, these values are substantially lower than the values of 0.24 mol m-3 (5,500 ppmv)
reported by Buecher (1999) for the Kartchner Caverns (Arizona), 0.36 mol m-3 (8,300 ppmv) presented by Ek &
Gewelt (1985) in the Ste-Anne Cave (Belgium), 1.8 mol m-3
(41,500 ppmv) reported by Bourges et al. (2001) or even 2.68 mol m-3 (62,000 ppmv) given by Batiot-Guilhe et
al. (2007) (Causse d´Aumelas, France). This comparison indicates that the Balcarka Cave belongs to the caves with rather low CO2 levels. The peak CO2 values up to
6 x 10⁻² mol m-3 (1,400 ppmv) linked to the anthropogenic
impact are comparable with the values referred by Dragovich & Grose (1990), Faimon et al. (2006) or Benavente et al. (2011). On the other hand, they do not reach the value ~0.1 mol m-3 (2,300 ppmv) presented by Milanolo &
Gabrovšek (2009). Nevertheless, the anthropogenic impact on the Balcarka Cave environment may be classified as a standard one in comparison with other visiting caves. During all the monitoring campaigns, the cave persisted in the so-called fall period of limited ventilation (Faimon et al., 2012a). This period follows the summer period of active
ventilation that provided enhanced CO2 levels.
Natural influence
The sensitivity analysis (Fig. 6), the preliminary calculations based on eqns. (3) to (8), and the modeling
Fig. 6. Sensitivity analysis: evolution of the CO2 steady state concentrations in the cave chamber based on the variation of individual parameters. The case without visitors (a); the case with visitors at different temperature ranges (b, c).
results (Fig. 3-4, Table 2) showed that natural CO2
levels in the chamber (in the case without visitors) are controlled by the advective CO2 fluxes from
adjacent cave spaces. These fluxes are a function of (1) CO2 concentrations in these spaces, cadj, and (2)
cave airflows controlled by temperature difference, DT = Texterior– Tcave, (Fig. 6a). Based on airflow direction
(controlled by the DT sign), different CO2 fluxes enter
the chamber from different adjacent spaces. The lesser CO2 concentrations are results of the fluxes from the
spaces situated below, closer to the cave entrance (operating as an inputting reservoir during the UAF mode, see Fig. 5a). The higher CO2 concentrations are
transported by the fluxes from deeper/higher-situated cave spaces (operating as an inputting reservoir during the DAF mode, see Fig. 5b).The concentrations ca(2)dj are probably derived from soil/epikarstic CO2; it
is even conceivable that the concentrations represent the CO2 directly “soaked” from the epikarst. Various
sinkholes and shafts filled with porous sediment and representing a section into the karst’s vertical profile may serve as the entrances for such transport. Peak values of the CO2 concentrations measured in the
soils above the Balcarka Cave reach up to 4,500 ppmv (Faimon et al., 2012c). Under the correction for the drill-hole diameter at monitoring (Blecha & Faimon, 2014), the peak values could even reach up to ~6,000 ppmv (2.6 x 10⁻¹ mol m-3). Such values should
fully cover the concentrations predicted by the model, ~3 x 10⁻² mol m-3 (Table 2). It should be emphasized
that the CO2 concentrations in the adjacent space,
ca(2)dj, were not available for direct monitoring because
of (1) uncertainty in the airflow path and (2) inaccessibility of such spaces.The ca(1)dj values predicted
by the model, 2.2-2.8 x 10⁻² mol m-3 (500–650 ppmv)
(Table 2) are in good agreement with the values of about 2.3 x 10⁻² mol m-3 (530 ppmv) ordinarily measured
at the entrance passages of the cave. From the cadj
variations during the campaigns and even during individual monitoring periods (Table 2), it is evident that the parameter is not invariant. However, the 8.8% variation (variation coefficient) during the DAF mode and 7.4% variation during the UAF mode seem to be reasonable and expectable/acceptable ones considering the capacities of CO2 source and
outgoing fluxes.
Similarly to cadj, data on the actual airflows and
its directions were not available. The reason was its extremely low linear velocity and technical difficulties during their monitoring. Therefore, the airflows and their directions were estimated from temperature differences based on eqn. (5) and sign of DT, respectively (see Faimon & Lang, 2013 for details). Based on the regression analysis, the values of kDT were found to
vary in the range of (5.83-7.47) x 10-3 m3 s-1 deg-1/2 for
the UAF mode and (1.50-4.83) x 10-2 m3 s-1 deg-1/2 for
the DAF mode (Table 2). Similar values were found for the Císařská Cave (Moravian Karst) in the UAF mode, but much lesser ones for the same site in the DAF mode (Faimon & Lang, 2013). In fact, kDT is expected
to vary with cave geometry, especially the difference in altitudes of entrances, or length and diameters of the conduits.
The switching between DAF and UAF ventilation modes is principally expected at zero DT, when both the cave and external temperatures are balanced. However, the modeling results indicate that the mode switching could be achieved at non-zero DT. This phenomenon was published by, e.g., de Freitas et al. (1982) or Faimon et al. (2012b), who estimated the switching DT in the range of 0.6 to 1.4°C. The modeling showed comparable values: the individual ventilation modes in the Gallery Chamber most likely switched at |DT| ranging from 0.4 to 3.2 °C (Fig. 3 and 4). This discrepancy may be the result of the non-uniform distribution of temperatures, humidity, and CO2 concentrations throughout the cave (Faimon &
Lang, 2013; Sánchez-Cañete et al., 2013).
The modeling showed that it was potentially suitable for distinguishing the direct net natural fluxes into the chamber from overburden, jN. Generally, the
flux should induce the increment of CO2 levels at/
near zero DT, when the CO2 concentrations in the
chamber are not lowered by ventilation. However, the data do not indicate such an effect. The extremely low flux jN of the orders of 10-6 mol s-1 was identified
(Table 2). The flux is much lower than the advective fluxes (up to 1.5 x 10⁻³ mol s-1). This could mean
that (1) CO2 fluxes into the cave are distributed
un-uniformly following predominant paths, and (2) water degassing in the site is not a dominant source. The rather highest jN value from the observed range that
was found during Campaign I (September) might be a residuum of enhanced CO2 production during the
end of the summer season. Despite the possible un-uniform distribution, the flux jN was approximately
recalculated into the specific flux normalized to a 1 m2 area. Based on the orthogonal projection
plane of the chamber of about 60 m2, such
a flux would correspond to the values from 2.8 x 10⁻⁸ to 1.1 x 10⁻⁷ mol m-2 s-1. These values are
consistent with 7.59 x 10⁻⁸ mol m-2 s-1 presented for the
Císařská Cave by Faimon et al. (2006). On the other hand, the value is much lower in comparison with 1 x 10⁻⁵ mol m-2 s-1 presented by Milanolo &
Gabrovšek (2009).
Anthropogenic influence
According to modeling, the peak anthropogenic CO2
flux into the chamber, jA, reached 3.5 x 10⁻³ mol s-1
depending on the number of visitors. Even though it is a rather higher flux in the modeled system (Table 3), it does not reach the maxima of the natural advective fluxes. The sensitivity analysis showed the extremely strong effect of DT on the resulting cave CO2 concentrations (Fig. 6b). The reason is that cave
ventilation and outputting fluxes are suppressed during the periods at |DT|~0°C, when the chamber CO2 levels are only limited by small diffusive fluxes.
From a mathematical point of view, the low value of the denominator in eqn. (12) at DT = 0°C causes an extreme increase in the css value. However, the time
periods when the cave persists at zero DT are very short, as is visible in the DT data (Fig. 2c-4c). This short time does not allow neither reaching the steady state concentrations, css, nor a significant increase
natural CO2 levels when visitors stayed sufficiently on
site. This indicates how reducing the period of a tour in the cave could substantially contribute to better protection of the cave environment.
The article represents a case study based on data coming from the late summer and fall, when the cave experienced the so-called “fall period of limited ventilation.” This period is characterized by higher natural CO2 levels deeper in the cave that have
persisted from an enhanced summer CO2 production.
A similar study should be undertaken in the spring period of limited ventilation under the conditions of generally low natural CO2 levels resulting from the
winter period of active ventilation. Unfortunately, the cave is closed during the winter season, which did not allow the study of anthropogenic CO2 behavior during
the winter period of active ventilation. Nevertheless, further study during the summer period of active ventilation at enhanced natural CO2 levels will be
worthwhile. The study results may be useful for better cave management: based on our model, the numbers of visitors in groups and individual intervals between the visitor groups may be determined so that they burden the cave environment less in dependence of seasonal conditions. In general, the work may be of interest to karsologists and environmentalists.
ACKNOWLEDGEMENTS
The authors wish to thank three anonymous reviewers for valuable comments. Thank you to Peter Blackie and Philippe Labarbe for critically reading the manuscript. The research was supported by funding from the Masaryk University.
REFERENCES
Baker A. & Genty D., 1998 - Environmental pressures
on conserving cave speleothems: effects of changing surface land use and increased cave tourism. Journal
of Environmental Management, 53: 165-175. http://dx.doi.org/10.1006/jema.1998.0208
Baldini J.U.L., Baldini L.M., McDermott F. & Clipson N., 2006 - Carbon dioxide sources, sinks, and spatial
variability in shallow temperate zone caves: Evidence from Ballynamintra Cave, Ireland. Journal of Cave and
Karst Studies, 68: 4-11.
Baldini J.U.L., McDermott F., Hoffmann D.L., Richards D.A. & Clipson N., 2008 - Very high-frequency and
seasonal cave atmosphere PCO2 variability: Implications
for stalagmite growth and oxygen isotope-based paleoclimate records. Earth and Planetary Science
Letters, 272: 118-129.
http://dx.doi.org/10.1016/j.epsl.2008.04.031
Banner J.L., Guilfoyle A., James E.W., Stern L.A. & Musgrove M., 2007 - Seasonal variations in modern
speleothem calcite growth in Central Texas, USA.
Journal of Sedimentary Research, 77: 615-622. http://dx.doi.org/10.2110/jsr.2007.065
Batiot-Guilhe C., Seidel J.-L., Jourde, H., Hébrard O. & Bailly-Comte V., 2007 - Seasonal variations of CO2
and 222Rn in a mediterranean sinkhole – spring (Causse
d´Aumelas, SE France). International Journal of
Speleology, 36 (1): 51-56.
http://dx.doi.org/10.5038/1827-806X.36.1.5 of the CO2 level in the chamber. For example, data
from Campaign I indicate that the |DT| values are in the range of 0.7 to 8°C for 90% of the time of the monitored period. During this time, the effect of DT is significantly lower; it is comparable with the visitor effect (see Fig. 6c).
The kA constant (see Table 1) corresponds to an
individual personal flux, j(
Apersonal). The mean value,
j(
Apersonal) ~6.7 x 10⁻⁵ mol s-1, is lower than the values of
2.9 x 10⁻⁴ mol s-1 presented by Faimon et al. (2006)
or (2.60–3.35) x 10-4 mol s-1 reported by Milanolo
& Gabrovšek (2009). In general, factors causing differences in the values may be human age (Tormo et al., 2001; Faimon et al., 2006), activity (Iwamoto et al. 1994), and gender (Sciacca et al. 2002).
To quantify the potential anthropogenic impact, the CO2 steady state, css, was calculated for the
maximum number of visitors (Campaign I). If a peak anthropogenic flux jA = 3.5 x 10⁻³ mol s-1 is assumed,
a steady state concentration of css ~0.15 mol m-3
(3471 ppmv) would be reached. This value is roughly comparable with the value presented by Faimon et al. (2006). It shows that the natural CO2 level could
almost be tripled under the condition that visitors were in cave for a sufficiently long period.
The present work should be understood as an attempt to simulate cave CO2 levels based on (1) a
limited/ordinary available data set and (2) a general knowledge on the art of cave microclimatology. The reason for limited data are principal difficulties at the direct measuring of (i) CO2 concentrations at the
adjacent sites and (ii) cave airflows. Therefore, all the missing parameters, jN, cadj, kA, and kDT, were found
indirectly, by modeling. This led to the great fitting of the data by the model on one hand, however, to a limited verification of an inner mechanism of the model by direct measurement on the other hand. Nevertheless, we believe that our approach would be useful for other researchers as a basic tool for the study of cave CO2 dynamics and that the model will
be elaborated in greater detail in the future. CONCLUSIONS
The evolution of CO2 concentrations was studied
in the homothermic zone of the Balcarka Cave, the visiting cave in Moravian Karst (Czech Republic) during the fall period of limited ventilation. The results showed that CO2 levels in the studied cave
site were controlled by different factors depending on given conditions in both the exterior and interior. When no visitors were present, the CO2 levels in the
chamber were controlled by CO2 fluxes from adjacent
cave spaces. These fluxes were controlled by (1) the adjacent spaces’ CO2 levels and (2) airflows driven
by the temperature difference between the exterior and the cave site. When visitors were present, CO2
levels at the site were significantly influenced by the anthropogenic flux dependent on the number of visitors. The immediate increment of CO2 levels in the
chamber depended on the duration of the visit. The model showed that the anthropogenically-impacted steady state concentrations would almost triple the
Fernández-Cortes A., Sanchez-Moral S., Cuezva S., Cañaveras J.C. & Abella R., 2009 - Annual and
transient signatures of gas exchange and transport in the Castañar de Ibor cave (Spain). International Journal
of Speleology, 38 (2): 153-162.
http://dx.doi.org/10.5038/1827-806X.38.2.6
Ford T.D. & Williams P.W., 2007 - Karst Hydrogeology and Geomorphology. Wiley & Sons, Chicester. 562 p. Geiger R., 1966 - The climate near the ground. Harvard
University Press, Cambridge, 628 p.
Holland H.D., Kirsipu T.V., Huebner J.S. & Oxburgh U.M., 1964 - On some aspects of the chemical evolution
of cave water. Journal of Geology, 72: 36-67.
http://dx.doi.org/10.1086/626964
Iwamoto J., Pendergast D.R., Suzuki H. & Krasney J.A., 1994 - Effect of graded exercise on nitric oxide in expired
air in humans. Respiration Physiology, 97: 333-345.
http://dx.doi.org/10.1016/0034-5687(94)90069-8 Kowalczk A.J. & Froelich P.N., 2010 - Cave air ventilation
and CO2 outgassing by radon-222 modeling: How fast
do caves breath? Earth and Planetary Science Letters,
289: 209-219.
http://dx.doi.org/10.1016/j.epsl.2009.11.010
Lario J. & Soler V., 2010 - Microclimate monitoring
of Pozalagua Cave (Vizcaya, Spain): application to management and protection of show caves. Journal of
Cave and Karst Studies, 72 (3): 169-180. http://dx.doi.org/10.4311/jcks2009lsc0093
Liñán C., Vadillo I. & Carrasco F., 2008 - Carbon dioxide
concentration in air within the Nerja Cave (Malaga, Andalusia, Spain). International Journal of Speleology,
37: 99-106.
http://dx.doi.org/10.5038/1827-806X.37.2.2
Luetscher M. & Jeannin P.-Y., 2004b - Temperature
distribution in karst systems: the role of air and water
fluxes. Terra Nova, 16: 344-350.
http://dx.doi.org/10.1111/j.1365-3121.2004.00572.x Marquardt D.W., 1963 - An Algorithm for Least-Squares
Estimation of Nonlinear Parameters. Journal of the
Society for Industrial and Applied Mathematics,
11 (2): 431-441.
http://dx.doi.org/10.1137/0111030
Milanolo S. & Gabrovšek F., 2009 - Analysis of Carbon
Dioxide Variations in the Atmosphere of Srednja Bijambarska Cave, Bosna and Herzegovina.
Boundary-Layer Meteorology, 131: 479-493.
http://dx.doi.org/10.1007/s10546-009-9375-5 Pflitsch A. & Piasecki J., 2003 - Detection of an airflow
system in Niedzwiedzia (Bear) Cave, Kletno, Poland.
Journal of Cave and Karst Studies, 65: 160-173.
Pulido-Bosch A., Martín-Rosales W., López-Chicano M., Rodríguez-Navarro C.M. & Vallejos A., 1997 - Human
impact in a tourist karstic cave (Aracena, Spain).
Environmental Geology, 31 (3/4): 142-149. http://dx.doi.org/10.1007/s002540050173
Russell M.J. & MacLean V.L., 2008 - Management issues
in a Tasmanian tourist cave: Potential microclimatic impacts of cave modifications. Journal of Environmental
Management, 87: 474-483.
http://dx.doi.org/10.1016/j.jenvman.2007.01.012 Sánchez-Cañete E.P., Serrano-Ortiz P., Domingo F. &
Kowalski A.S., 2013 - Cave ventilation is influenced by
variations in the CO2-dependent virtual temperature.
International Journal of Speleology, 42 (1): 1-8. http://dx.doi.org/10.5038/1827-806X.42.1.1
Saltelli A., Tarantola S., Campolongo F. & Ratto M., 2004 - Sensitivity analysis in practice: A guide to
assessing scientific models. (1st ed.). John Wiley &
Sons, Chichester, 232 p. Benavente J., Vadillo I., Liñan C., Carrasco F. & Soler
A., 2011 - Ventilation effects in a karstic show cave
and in its vadose environment, Nerja, Southern Spain.
Carbonates and Evaporites, 26: 11-17.
http://dx.doi.org/10.1007/s13146-011-0050-9 Blecha M. & Faimon J., 2014 - Karst soils: Dependence of
CO2 concentrations on pore dimension. Acta Carsologica,
43 (1): 55-64.
Bourges F., Mangin A. & d´Hulst D., 2001 - Le gaz
carbonique dans la dynamique de l´atmosphére des cavités karstiques: l´exemple de l´Aven d´Orgnac (Ardéche). Carbon dioxide in karst cavity atmosphere dynamics: the example of the Aven d´Orgnac (Ardéche).
Earth and Planetary Sciences, 333: 685-692.
Bögli A., 1978 - Karsthydrographie und physische Speleologie. Springer, Berlin, 292 p.
Buecher R.H., 1999 - Microclimate study of Kartchner
Caverns, Arizona. Journal of Cave and Karst Studies,
61: 108-120.
Cigna A.A., 1968 - An analytical study of air circulation
in caves. International Journal of Speleology, 3: 41-54.
http://dx.doi.org/10.5038/1827-806X.3.1.3
de Freitas C.R, Littlejohn R.N., Clarkson T.S. & Kristament I.S., 1982 - Cave climate: assessment
of airflow and ventilation. Journal of Climatology,
2: 383-397.
http://dx.doi.org/10.1002/joc.3370020408
Dragovich D. & Grose J., 1990 - Impact of tourists on
carbon dioxide levels at Jenolan Caves, Australia: an examination of microclimatic constraints on tourist cave
management. Geoforum, 21: 111-120.
http://dx.doi.org/10.1016/0016-7185(90)90009-U Dreybrodt W., 1999 - Chemical kinetics, speleothem
growth and climate. Boreas, 28: 347-356.
Ek C. & Gewelt M., 1985 - Carbon dioxide in cave
atmospheres. New results in belgium and comparison with some other countries. Earth Surface Processes and
Landforms, 10: 173-187.
http://dx.doi.org/10.1002/esp.3290100209
Faimon J., Štelcl J. & Sas D., 2006 - Anthropogenic CO2
-flux into cave atmosphere and its environmental impact: a case study in the Císařská Cave (Moravian Karst, Czech Republic). Science of the Total Environment,
369: 231-245.
Faimon J., Ličbinská M., Zajíček P. & Sracek O., 2012a -
Partial pressures of CO2 in epikarstic zone deduced from
hydrogeochemistry of permanent dripws, the Moravian
Karst, Czech Republic. Acta Carsologica, 41 (1): 47-57.
Faimon J., Troppová D., Baldík V. & Novotný R., 2012b -
Air circulation and its impact on microclimatic variables in the Císařská Cave (Moravian Karst, Czech Republic).
International Journal of Climatology, 32: 599-623. http://dx.doi.org/10.1002/joc.2298
Faimon J., Ličbinská M. & Zajíček P., 2012c - Relationship
between carbon dioxide in Balcarka Cave and adjacent soils in the Moravian Karst region of the Czech Republic.
International Journal of Speleology, 41 (1): 17-28. http://dx.doi.org/10.5038/1827-806X.41.1.3
Faimon J. & Lang M., 2013 - Variances in airflows during
different ventilation modes in a dynamic U-shaped cave.
International Journal of Speleology, 42 (2): 115-122. http://dx.doi.org/10.5038/1827-806X.42.2.3
Fairchild I.J., Borsato A., Tooth A.F., Frisia S., Hawkesworth C.J., Huang Y., McDermott F. & Spiro B., 2000 - Controls on trace element (Sr-Mg) compositions
of carbonate cave waters: implications for speleothem
climatic records. Chemical Geology, 166: 255-269.
TopRank 6, 2014 - Automated „what-if“ Analysis for
Spreadsheet. Online: http://www.palisade.com/toprank/
[20. 2. 2014]
Tormo R., Bertaccini A., Conde M., Infante D. & Cura I., 2001 - Methane and hydrogen exhalation in normal
children and in laktose malabsorption. Early Human
Development, 65: 165-172.
http://dx.doi.org/10.1016/S0378-3782(01)00219-5 White W.B., 1988 - Geomorphology and hydrology of karst
terrains. Oxford University Press, New York, 464 p. Wigley T.M.L. & Brown M.C., 1971 - Geophysical
applications of heat and mass transfer in turbulent pipe
flow. Boundary-Layer Meteorology, 1: 300-320.
http://dx.doi.org/10.1007/BF02186034
Welty J.R., Wicks C.E., Wilson R.E. & Rorrer G.L., 2008 - Fundamentals of momentum, heat, and mass transfer. (5th ed.). John Wiley & Sons, Inc., New York, 729 p.
Sciacca J., Forbes W.M., Ashton F.T., Lombardini E., Gamble H.R. & Schad G.A., 2002 -Response to
carbon dioxide by the infective larva of three species of parasiti nematodes. Parasitology International,
51: 53-62.
http://dx.doi.org/10.1016/S1383-5769(01)00105-2 Song L., Wei X. & Liang F., 2000 - The influences of cave
tourism on CO2 and temperature in Baiyun Cave, Hebei,
China. International Journal of Speleology, 29 B (1/4):
77-87.
Spötl C., Fairchild I.J. & Tooth A.F., 2005 - Cave air
control on dripwater geochemistry, Obir Caves (Austria): implications for speleothem deposition in dynamically ventilated caves. Geochimica et Cosmochimica Acta,
69 (10): 2451-2468.