Dry-season status, trend and distribution of Konkombouri
elephants and implications for their management, Burkina Faso
Philippe BouchéKonkombouri Ecological Monitoring Programme, Burkina Safari Club BP 5081 Ouagadougou 02, Burkina Faso; email: ph_bouche@yahoo.com
Abstract
Konkombouri Hunting Zone is part of the transfrontier W–Arly–Pendjari ecosystem. Monthly dry-season records from wildlife monitoring show that the free-ranging elephant population increased from month to month with the progression of the dry season and the reduction of water points that still contained water. However, with the arrival of the first important rains, elephant density continued to increase because water and new shoots were available everywhere. In 2005 and 2006 elephant density in the Konkombouri Hunting Zone reached the highest mean dry-season elephant density recorded in West Africa in recent decades. This situation increases the impact on habitat close to water points and heightens human–elephant conflicts.
Résumé
La Zone de Chasse de Konkombouri fait partie de lʼécosystème transfrontalier W–Arly–Pendjari. Le suivi mensuel de la faune en saison sèche montre que la taille des populations vivant dans la Zone de Chasse de Konkombouri augmente de mois en mois tout au long de la saison sèche tandis que le nombre de mare conten-ant de lʼeau diminue. Avec lʼarrivée des premières pluies les densités dʼéléphconten-ants continuent à augmenter car lʼeau et les nouvelles repousses deviennent disponibles partout. En 2005 et 2006 les densités dʼéléphants ont atteint la densité moyenne globale pour toute la saison sèche la plus élevée qui ait été enregistrée en Afrique de lʼOuest ces dernières décennies. Cette situation a pour conséquence, dʼaugmenter du même coup lʼimpact de cette espèce sur les habitats à proximité des points dʼeau, les aménagements hydrauliques et les conflits hommes–éléphants.
Introduction
West Africa shelters the smallest elephant (Loxodonta
africana) population of the African continent (Blanc
et al. 2007). However, the situation can be extremely variable from place to place. This paper studies the recent pattern of elephant density and distribution during the dry season in the Konkombouri Hunting Zone (KHZ). It discusses the impact of these trends on water infrastructures, habitat, and human–elephant conflicts.
Since 1996 and the start of the concession process several methods have been used to assess elephant numbers. An aerial sampling survey method (Norton Griffiths 1978) was used in 1998, 1999 and 2000 (Barry and Chardonnet 1998; Chardonnet et al.
1999; Chardonnet 2000; Bouché et al. 2000; Bouché et al. 2002) to count the elephant population of the Pama Arly complex that includes KHZ. However, the results of all these surveys are questionable to some extent because none of the aircraft used were fitted with a radar-altimeter, creating a variable and undetermined bias in strip width. The aerial total count method (Douglas-Hamilton 1996) was used on the W–Arly–Pendjari (WAP) ecosystem in 2003 (Bouché et al. 2004a), providing for the first time a baseline of the elephant status in the ecosystem. The WAP ecosystem shelters a minimum of 4600 elephants, the largest elephant population in West Africa. Most of this population, around 3000, frequent the Burkina Faso side in the late dry season (Bouché et al. 2004a).
In 1996 the Burkina Faso government decided to reform the wildlife sector and, notably, divide the Burkina Faso side of the WAP ecosystem into blocks, with the exception of the Burkina Faso side of W National Park, to concede management to private partners for 10 years, renewable. The KHZ is one of these blocks. In 1997 KHZ was occupied by more than 70 illegal farms. There were no roads or tracks, except the Tindangou–Arly road, and no water infrastructures. Water was permanent only in the Singou River. As of 1997, farms were moved out of KHZ with the agreement of the communities, 10 water points were created or improved for wildlife, yearly burning was done and an ecological monitoring programme unique in the region was implemented. The main activity of KHZ is game viewing and large game safari hunting. It must be emphasized that the elephant is totally protected by Burkina Faso law and is not a species to be hunted.
Since 1997, wildlife in KHZ has increased through reproduction and immigration from other areas of the ecosystem. In a few years the global mean dry-season density had grown up to 20–25 ungulates/km2 in 2005 (Bouché and Renkens 2005; Bouché 2006), giving KHZ the highest wildlife density of the region.
Study area
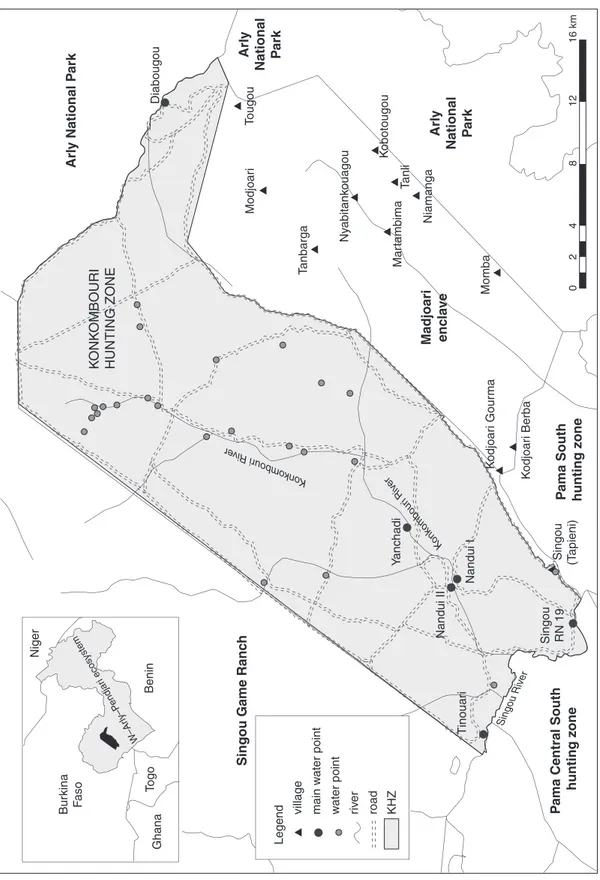
This study was conducted in the Konkombouri Hunt-ing Zone in the east of Burkina Faso, between 9°95´ and 12°85´N and 0°40´ and 3°40´W; it covers 650 km2. This zone is part of the W–Arly–Pendjari ecosystem of 30,000 km2 shared by Benin, Burkina Faso and Niger (Bouché et al. 2004a) (fig. 1). Altitude ranges between 160 m and 250 m above sea level.
Climate is characterized by three seasons: a dry cold season from November to the end of February, a dry hot season from March to the end of May and a rainy season from June to October. During the dry cold season the harmattan wind blows from the north-east and dries out the vegetation, while in the rainy season a monsoon wind blows from the south-west. Mean annual rainfall for the last 12 years has been 945.0 ± 177.81 (SD) mm. Mean annual temperature varies between 30 °C and 34 °C, with extremes of 9 °C and 45 °C.
Water availability is essential for wildlife sur-vival in the KHZ during the dry season. Several riv-ers or streams cross the area. The most important are the Singou River and its tributary, the Konkombouri
(fig. 1). In addition to some waterholes in the Singou riverbed that are permanent even when the river be-comes a trickle in the dry season, six other natural or artificial waterpoints in KHZ always have water.
Habitat is mainly bushy to woodland savanna with Vitellaria paradoxa, Combretum spp., Acacia spp., Anogeissus leiocarpa, Afzelia africana, Burkea
africana, Isoberlinia doka and Terminalia spp., and
woodland savanna with forest galleries along the main rivers with Danielia oliveri, Terminalia spp.,
An. leiocarpa and Khaya senegalensis.
Some villages and communities live along the KHZ boundary in the Madjoari enclave (fig. 1), which is a territorial and administrative division. In 1996, its population was 5810 inhabitants distributed in 11 vil-lages (Bouché et al. 2000). Agriculture is the main ac-tivity. Livestock is another important acac-tivity. Wildlife areas like KHZ are also a source of revenue for local communities through employment in safari hunting and game viewing, through meat, taxes and, unfortunately, also poaching to some extent, even if its impact is quite low in KHZ (Bouché and Renkens 2004).
Method
The distance sampling method (Buckland et al. 1993) by direct ground counts was implemented in 2004 and 2006 in KHZ (Bouché and Lungren 2004a; Bouché 2006). A network of 55 transects representing 339.2 km was walked by 10 teams along transects spaced at 1.5 m to 2 km during four days at the end of April or in early May 2004 and 2006.
Long-term ecological monitoring was done at the end of each month of the dry season, December to May. A road count (Norton-Griffiths 1978; Bothma 2002) along four circuits, totalling 193 km, in KHZ started in 2003 and recorded elephant numbers and their locations (Renkens and Bouché 2003; Bouché and Renkens 2004, 2005, 2006). Because long grass limited visibility, road counts were not done before December, just after bush fires. Road counts were stopped each year at the end of May with the arrival of the rainy season because the roads became unusable, muddy and sometimes flooded. In April 2004 road counts were done at one- to three-day intervals on foot and were considered a combined road count and distance sampling count. Results of both April 2004 counts were compared by a d test (Norton-Griffiths d test (Norton-Griffiths d
Tinouar
i
Nandui II
Nandui
I
Yanchadi Singou (Tapieni)
K odjoar i Berba Momba Niamanga Arl y National P ark Arl y National P ark Arl y National P ark Madjoari enc la ve P ama South hunting zone P
ama Central South hunting zone
Singou Game Ranc
h Tanli K obotougou Ny abitank ouagou Tanbarg a Modjoar i Tougou Diabougou K ONK OMBOURI HUNTING ZONE Konk om bour i Riv er Ko nk ombour i Riv er Singou Riv er Mar tambima K odjoar i Gour ma Singou RN 19 0 2 4 8 12 16 km village Legend Benin Togo Ghana Bur kina Faso W–Ar ly –P endjar i ecosystem Niger main w ater point w ater point riv er road KHZ
Results
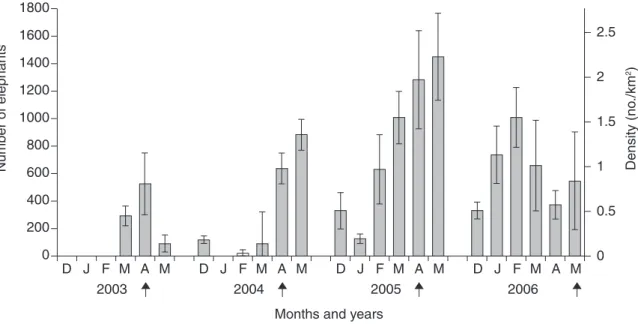
Figure 2 shows the evolution of elephant numbers in KHZ recorded during the six months of each dry season between 2003 and 2006. It also shows that each dry season, elephant density increases progressively from December to May. There was no significant difference between the road count and foot count of April 2004 (d = 0.2476 NS). From one year to the d = 0.2476 NS). From one year to the d
next elephant numbers increased, except in 2006. The mean global densities recorded these last years are reported in table 1.
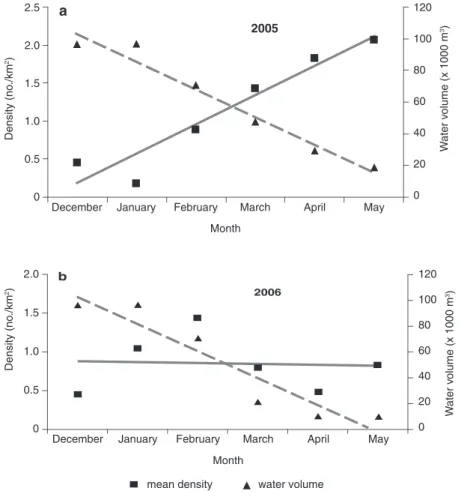
Figure 3, a and a and a b, shows the difference between
elephant trends in 2005 and 2006 in comparison with water availability. In 2005 water availability decreased with the progression of the dry season (r = –0.982; y = –17.594x + 121.06), while in the whole dry season elephants increased (r = 0.955; y = 0.3859x – 0.2085) (fig. 3a). In 2006 the water availability decreased more sharply from March (r = –0.950; y = –21.146x + 124.61), with the consequence that the 2006 dry-season elephant trend was stable at around 0.84 elephant/km2 (r = –0.06; y = –0.0123x + 0.8852) (fig. 3b). 0 D J F M 2003 A M D J F M 2004 A M D J F M 2005 Months and years
A M D J F M 2006 A M 0 0.5 1 1.5 2 2.5 200 400 600 800 1000 1200 1400 1600
Number of elephants Density (no
./km
2)
1800
Figure 2. Estimate of elephant numbers and densities in KHZ from 2003 to 2006 dry-season road counts. The monitoring began in March 2003; this explains the absence of data from December to February 2003. In May, the first rains were so great that only a small part of KHZ was covered, explaining in part the low numbers recorded. Arrows show the beginning of the first important rains.
Table 1. Dry-season mean global estimate, calculated on the pooled dry-season data and area surveyed with 95% confidence interval and coefficient of variation in percentage (CV%) of the estimate for 2003, 2004, 2005 and 2006 dry seasons
Year Estimate (n) Density (n/kmn/kmn 2) CV%
2003 236 ± 85 0.36 ± 0.13 18.1
2004 305 ± 97 0.47 ± 0.15 16.0
2005 821 ± 164 1.26 ± 0.25 11.8
2006 605 ± 263 0.93 ± 0.40 21.8
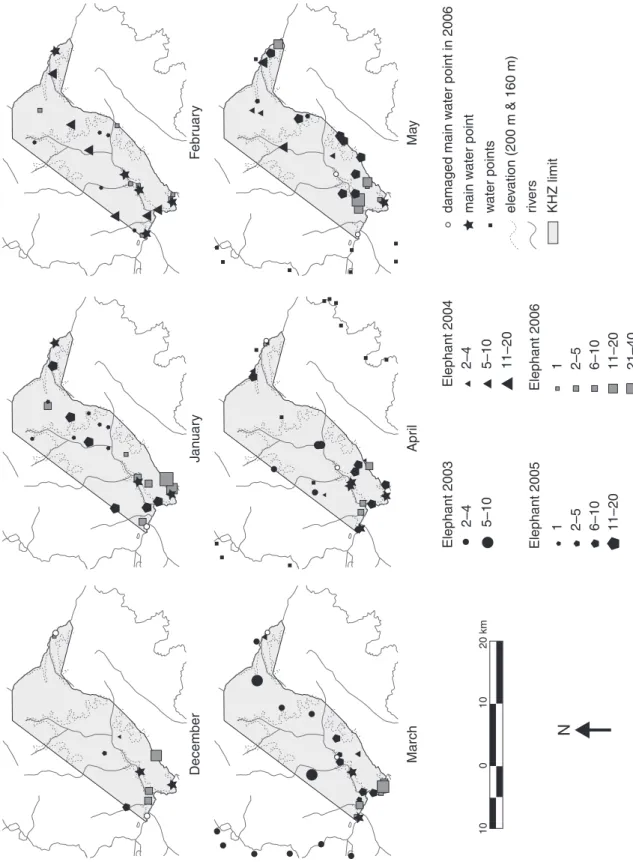
Figure 4 shows the elephant distribution month by month during the dry season. Elephants were more or less evenly distributed throughout KHZ from December to February. In March and April elephants moved back towards the main permanent water points. In 2006, three dams were damaged and the rainfall did not occur in April as in previous years. The April and May elephant distributions were, therefore, different in 2006 from previous years (fig. 4).
Discussion
Numbers and trends
Figure 2 shows that elephant numbers in KHZ are not constant in the dry season from year to year. KHZ is part of an ecosystem of 30,000 km2 in which elephants roam freely. Elephant numbers can vary with time and with the evolution of conditions in KHZ. With the progression of the dry season and the reduction of available water points, elephants concentrate along rivers and streams that still contain water (Bouché et al. 2004a; Bouché and Renkens 2004, 2005).
Elephant density increas-ed in KHZ during the dry season from immigration because elephants found
water and green pasture as well as tranquillity. However, with first rains at the end of April and May, except in 2006, elephant density was still growing with the ar-rival of other elephants from other parts of the ecosystem. The elephant reproduction season begins with the first important rains. KHZ seems to act as a crossroad for WAP elephant reproduction and could explain the sustained elephant increase. Several ʻforeignʼ herds and bulls that did not usually frequent KHZ during the early dry season were observed at that time (Bouché and Renkens 2004, 2005). In KHZ the elephant birth rate is 6.08 ± 0.31% per year (Bouché and Renkens 2004, 2005, 2006). However, it is highly unlikely that the increase between 2004 and 2005 was due to reproduction alone.
At the end of March 2005 all permanent water points still contained an estimated total of 50 x 103 m3 of wa-ter (fig. 3a). With the first rains in April 2005, elephants could find highly nutritious new shoots and sufficient water everywhere (Bouché et al. 2000). The water volume available in the remain-ing water points in April and May 2005 was, therefore, of less importance (fig. 3a).
The situation observed in 2006 was different. Between December and February the trends grew at an equivalent rate of those recorded in 2005, but in March and April, contrary to the previous years, the numbers became lower than in the early dry season. Three major, permanent, water points were damaged by elephants and crocodiles, becoming large muddy areas unusable for wildlife and reducing the carry-ing capacity. Crocodiles dug burrows in the dam that finally let the water leak, limiting the capacity of the water point. The rainy season also began later than in
2005 Month December 0 0.5 1.0 1.5 2.0 2.5
January February March April May 0 20 40 60 80 100 120 W ater vo lume (x 1000 m 3) Density (no ./km 2) a 2006 b Month
mean density water volume December 0 0.5 1.0 1.5 2.0
January February March April May 0 20 40 60 80 100 120 W ater v olume (x 1000 m 3) Density (no ./km 2)
Figure 3. Comparison of elephant trends (solid lines) in relation to water availability (dashed lines) during 2005 and 2006 dry seasons. The 2005 water volume data come from Lungren et al. 2004; the 2006 water volumes were adapted from the same source. Becaue of the three damaged dams, the water was unusable from March to May 2006.
10 0 10 20 km Elephant 2003 2–4 5–1 0 2–4 5–1 0 11–20 1 2–5 6–1 0 11–20 21–40 1 2–5 6–1 0 11–20 Elephant 2004 damaged main w ater point in 2006 main w ater point w ater points ele va tion (200 m & 160 m) riv ers KHZ limit Elephant 200 6 Elephant 2005 N March December Apr il Ja nuar y Ma y F ebr uar y
previous years. In mid-May 2006, despite increasing atmospheric moisture, the rains were still absent.
The absence of a peak count at the end of the 2006 dry season can be explained by the three damaged wa-ter points and the late rainy season, the end of May and early June (fig. 2). In 2006, the first important rains did not occur until after mid-May, while in March the water points contained only 20 x 103 m3 of water (fig. 3b).At that time the volume of water available in the remaining water points apparently was insufficient to satisfy a larger elephant population. It is also possible that elephants moved towards an area in WAP where water resources were more abundant, before those in KHZ totally dried up. This population reduction probably could not be explained by food shortage because leaves on trees were available everywhere each year from December to January, corresponding to the appearance of buds on most of the trees, up to the end of each dry season. The slight increase in elephants recorded in May 2006, like the sustained progression in March and April 2005 (fig. 2), can be partly explained by the increase in atmospheric moisture a few weeks before the arrival of the first rains, allowing new shoots to appear. From personal observation, some plants, such as Andropogon
gaya-nus and Hyparrhenia rufa, produce shoots when they
receive only a litle moisture.
The peak elephant density recorded in April and May 2005 and the mean dry-season elephant density recorded the same year were the highest recorded in West Africa these last decades, compared with other protected areas of the region, such as in Nazinga Game Ranch (Bouché et al. 2004b) or Pendjari Na-tional Park (Tehou 2002; Bouché et al. 2004a; Parc National de la Pendjari 2005).
Important intraseason elephant number variations in KHZ (fig. 2) from the free-roaming elephants in an open, large area support the idea of monitoring the WAP ecosystem as a single entity (Bouché et al. 2004a) and not surveying it piecemeal, as it is often done on the pretext that intervention domains are limited to parts of WAP. Unfortunately, few will combine funds to survey WAP as a single entity, even though some projects have been involved in WAP for a long time.
Distribution
In the early dry season green pasture and water are still available everywhere in the WAP ecosystem (Lungren
et al. 2005b) and the elephants are distributed over the whole area. With the progression of the dry season, elephants concentrate around the main permanent water points. In May with first rains, except in 2006, elephants leave the floodplains along the main rivers and reach the top of the catena on red soils. Red soils are more fertile than the clayey white soils of the floodplains, and new shoots appear more rapidly. Also, heavy rains transform white soils into mud that the elephants try to avoid. The distribution recorded in May 2006 (fig. 4) shows that elephants were still concentrated near the Singou floodplains. With the absence of rains in May 2006, contrary to previous years, the floodplains remained dry, allowing the elephants to roam there near the last available water points. In 2004 and 2005, the rains started in April. And in May 2004 and 2005 the elephants were scattered mainly on the highest lands, above 160 m, to avoid the muddy floodplains and to find new green shoots (fig. 4).
Management implications of high elephant density in Konkombouri
ELEPHANTIMPACTONWATERINFRASTRUCTURES
High elephant density has an impact on water infra-structures, such as artificial pools and ponds, that are at the origin of the recent elephant increase in KHZ. It has been demonstrated that in the middle of the dry season, 150 elephants can visit the same pool succes-sively the same night (Himmelspach 2006). Once they arrive at the pool, elephants erode the banks of the pools by pushing earth into the pool with their feet and knees. Also, from personal observation, play among young animals or bachelors increases this erosion and water turbidity, spoiling it for other species. In three years a pool of 200 x 50 x 2.5 m in the deepest part may lose 1.5 m of depth. A perennial pool then be-comes progressively temporary and after three years it will be unusable in the driest months of March and April (Lungren et al. 2005b).
The best solution is to build one or two reservoir dams to create a lake a few square kilometres in size. A lake has a larger volume of water available for wildlife and would thin the elephant density along a large perimeter and surface (Lungren 2003; Lungren et al. 2005a, 2005b). However, if this solution were technically possible in several places, it would re-quire funds that the concessionaire has not been able to generate (Lungren et al. 2005b). Alternatively, a
permanent water-point network could be expanded to ease the pressure on the current points.
ELEPHANTIMPACTONHABITAT
A deeper study of the elephant impact on vegetation is in preparation. However, first evidence shows that elephant impact seems greatest close to some of the main pools that still contain water in the late hot dry season; elephant impact seems quite low elsewhere. (Ouedraogo 2005). Elephant pressure reaches its maximum close to the permanent water points that represent roughly 25% of the points in the early cool dry season (Lungren et al. 2005b). The pressure on vegetation is critical in these areas during the two last months of the dry season.
If lakes were created, the elephant impact on local vegetation would be diluted, allowing forest galleries to form along their banks. The creation of a lake, especially with several branches, would increase significantly the length of the forest gallery and the ecotone along the perimeter of the new lake, favouring the habitat used by elephants and other spe-cies, such as buffalo (Syncerus caffer brachyceros), bushbuck (Tragelaphus scriptus scriptus), red-flanked duiker (Cephalophus rufilatus rufilatus) and leopard (Panthera pardus) (Lungren 2003; Lungren et al. 2005a, 2005b).
Human–elephant conflict
The recent elephant population increase has had an inevitable impact on human communities along KHZ in the Madjoari enclave because elephants raid crops frequently between July and November (Nakandé 2005). In 2005 crop raiding began in August, while the crops were still at the growing stage. The situation is critical. On one side communities are growing fast from high birth rates and immigration of people from other regions of the country. On the other side the elephant population is growing fast from the quiet and good-quality fire management that provides green pasture and green leaves on trees all year. With the creation of new water structures, elephant density will certainly continue to increase at the end of the dry season.
If conservation efforts are pursued in all protected areas around the Madjoari enclave, the pressure on communities will increase faster. The increasing hu-man population will be surrounded by an increasing elephant population. This will lead to the increase of
conflicts in violence and intensity with more victims on both sides if no adequate measures are taken to limit the immigration of people to the Madjoari en-clave and to solve the problem of the human enen-clave in the middle of a wildlife area. To limit human–elephant conflict, permanent immigration of people foreign to the region should be carefully controlled and limited by local authorities. A concessionaire should continue to help the communities develop their own commu-nity hunting area that the concessionaire could rent and use for foreign game-bird hunters to create sub-stantial revenue for the communities. If local people benefit it will help them tolerate elephant presence; the elephants come from KHZ, where hunter clients enjoy seeing them. In addition to local crop protec-tion and surveillance systems further research on human–elephant conflict should be implemented to find a practical solution to attenuate it.
POACHING
Elephant is a species totally protected by Burkina Faso law. Currently, elephant poaching in Burkina Faso is not a profitable business. To kill an elephant on pri-vately managed land, a poacher team needs several uninterrupted days to cut the animal into pieces and take it out and more days if they have to smoke it. When an elephant is poached in Burkina Faso, ivory is generally not the first goal. First, most elephants in Burkina Faso are tuskless or have small tusks, so a lot of elephants must be killed to collect a significant amount of ivory, increasing the risk of being spotted and arrested. In some parts of Burkina Faso, elephant populations are very small (Bouché and Lungren 2004b), limiting the source of profit. Second, ivory poachers receive a very low price.
Elephant poaching in KHZ is very low or nil. The quiet allows the elephant to roam all over the area, even along the boundary with the Madjoari enclave (Bouché and Renkens 2004). In five years a single dead elephant killed by poachers was reported near Diabougou, north-east of KHZ, coming from Arly National Park (fig. 1). Some people tried to kill ele- phants with poisoned watermelon. However, from all attempts we heard, there is no evidence that an elephant died by this method. Some people use single-shot 12-gauge single-shotguns against elephants to defend their fields during crop raiding. However, this weapon has a limited impact on an adult elephant, except if brenek bullets are used very close to the animals.
Conclusion
Surveys show that since 1999, the elephant population seems stable. However, wildlife monitoring shows that the reality is far more complex. The free-ranging elephant population size is variable from month to month in the dry season. While one could think that elephant densities would decrease with the progression of the dry season, the reverse was observed. The mean dry-season elephant density increased in KHZ, in 2005 and 2006 reaching the highest densities recorded in West Africa in these last decades, increasing the impact of this species on habitat close to water, water infrastructures, and heightening the number of human–elephant conflicts.
Acknowledgements
I wish to thank all our partners who in one way or another have contributed to implementing or fund-ing surveys in the Konkombouri Huntfund-ing Zone: the Ministry in Charge of Environment, the Direction de la Faune and the wildlife officers, AFD (Agence Française de Développement), AWHDA (African Wildlife Husbandry Development Association), IUCN (World Conservation Union) National Office, PAUCOF (Projet dʼAppui aux Unités de Conserva-tion de la Faune). I would like to thank M. Moumouni Dermé, Director of Burkina Safari Club, without whom the ecological monitoring would never exist, and Ms Doris Renkens, who alone led the first part of the data collection in 2003 and 2004.
The Konkombouri Long-Term Ecological Moni-toring Programme is funded by Burkina Safari Club and Philippe Bouché.
References
Bailey NTJ. 1995. Statistical methods in biology, 3rd ed. Cambridge University Press, Cambridge. 255 p. Barry I, Chardonnet B. 1998. Recensement aérien de la
faune de lʼUnité de Conservation dʼArly. Résultats et commentaires. Ministère de lʼEnvironnement et de lʼEau. Burkina Faso. 24 p.
Blanc JJ, Barnes RFW, Craig CG, Dublin HT, Thouless CR, Douglas-Hamilton I, Hart JA. 2007. African ele- phant status report 2007: an update from the African Elephant Database. Occasional Paper of the IUCN Species Survival Commission No. 33. IUCN, Gland, Switzerland. 284 p.
Bothma J du P. 2002. Counting wild animals. In: Bothma J du P, ed. Game ranch management, 4th ed. Van Schaik Publishers, Pretoria, South Africa. p. 335–357. Bouché Ph. 2006. Recensement pédestre des grands
mam-mifères de la Zone de Chasse de Konkombouri, Burkina Faso. Rapport provisoire no. PMZCK/2006/02. Burkina Safari Club, ADEFA. 37 p.
Bouché Ph, Heymans J-C, Lungren CG, Ouedraogo LK. 2000. Recensement aérien des animaux sauvages dans les concessions de faune de lʼEst. Ministère de lʼEnvironnement et de lʼEau, UICN, Burkina Faso. Bouché Ph, Lungren CG. 2004a. Recensement pédestre
des grands mammifères de la Zone de Chasse de Konkombouri, Burkina Faso, Avril 2004. Rapport no. PMZCK/2004/02. Burkina Safari Club/ADEFA/ PAUCOF/AFD. 48 p.
Bouché Ph, Lungren CG. 2004b. Les petites populations dʼéléphant du Burkina Faso—statut, distribution et déplacement. Pachyderm 37:84–91.
Bouché Ph, Lungren CG, Ouedraogo LK. 2002. Statut et tendances des effectifs dʼéléphants dans les aires protégées de lʼEst du Burkina Faso. Pachyderm 32:49–54.
Bouché Ph, Lungren CG, Hien B, Omondi P. 2004a. Re-censement aérien total de lʼEcosystème W–Arly–Pend-jari–Oti-Mandouri–Kéran (WAPOK). CITES-MIKE, ECOPAS, PAUCOF, Benin, Burkina Faso, Niger, Togo. 114 p.
Bouché Ph, Lungren CG, Hien B. 2004b. Recensement aérien total de la faune dans lʼécosystème naturel Po– Nazinga–Sissili (PONASI). CITES-MIKE, Burkina Faso. 95 p.
Bouché Ph, Renkens D. 2004. Suivi de la Faune de la Zone de Chasse de Konkombouri, Burkina Faso, décembre 2003–mai 2004. Rapport no. PMZCK/2004/02. Burkina Safari Club. 114 p.
Bouché Ph, Renkens D. 2005. Suivi de la Faune de la Zone de Chasse de Konkombouri, Burkina Faso, décembre 2004–mai 2005. Rapport no. PMZCK/2005/02. Burkina Safari Club. 160 p.
Bouché Ph, Renkens D. 2006. Suivi de la Faune de la Zone de Chasse de Konkombouri, Burkina Faso, décembre 2005–mai 2006. Rapport no. PMZCK/2005/02. Burkina Safari Club. 102 p.
Buckland ST, Anderson DR, Burnham KP, Laake JL. 1993. Distance sampling: estimating abundance of biological populations. Chapman and Hall, London, reprinted 1999 by RUWPA, University of St Andrews, Scotland. 446 p.
Chardonnet B. 2000. Etude des effectifs et de la répartition saisonnière des éléphants des aires classées de lʼEst du Burkina Faso. Pachyderm 28:16–31.
Chardonnet B, Rouamba P, Barry I, Ouedraogo A, Na-coulma P. 1999. Suivi écologique aérien des aires classées des bassins de lʼArly et du Singou. Ministère de lʼEnvironnement et de lʼEau, Burkina Faso. 124 p. Douglas-Hamilton I. 1996. Counting elephant from the air:
total counts. In: Kangwana K, ed., Studying elephants. Handbook No. 7. African Wildlife Foundation, Nairobi. p. 31–41.
Himmelspach Ch. 2006. Etude de la fréquentation de deux mares par la faune de la Zone de Chasse de Konkombouri dans lʼEst du Burkina Faso. Rapport no. PMZCK/2006/01. Burkina Safari Club et Université de Liège. 37 p.
Lungren CG. 2003. Réflexions sur lʼhydraulique faunique. ADEFA, Ouagadougou, Burkina Faso. 3 p.
Lungren CG, Lungren D, Lungren L. 2005a. Etude de faisa-bilité pour lʼaménagement des points dʼeau pérennes dans la Forêt Classée et Réserve Partielle de Faune de la Comoé-Léraba, Burkina Faso. Association Intervil-lageoise de Gestion des Ressources Naturelles et de la Faune Comoé–Léraba (AGEREF-CL). Banfora, Burkina Faso. 144 p.
Lungren CG, Ouedraogo F, Bouché F, Lungren L, Zida C, Légma M. 2005b. Etude sur les ressources en eau du Complexe Arly–Pama–Arly–Wamou. ADEFA/UICN, Ouagadougou, Burkina Faso. 237 p.
Nakandé A. 2005. Etude des conflits hommes–éléphants dans la Réserve Partielle de Pama. Unpublished re-port.
Norton-Griffiths, M. 1978. Counting animals, 2nd ed. African Wildlife Foundation, Nairobi.
Ouedrago I. 2005. Contribution à la conception dʼune carte de végétation de la Zone de Chasse de Konkombouri. Burkina Safari Club, MECV, PAUCOF, 39 p.
Parc National de la Pendjari. 2005. Plan dʼaménagement et de gestion 2004–2013. CENAGREF, GTZ. 83 p. + annex.
Renkens D, Bouché Ph. 2003. Suivi de la faune de la zone cynégétique de Konkombouri, mars–mai 2003. Rapport no. PMZCK/2003/01. Burkina Safari Club, Burkina Faso. 46 p.
Tehou A. 2002. Les éléphants Loxodonta africana dans la Réserve de la Biosphère de la Pendjari, nord-est République du Bénin : abondance, densités et répartition spatiale. Pachyderm 33:64–68.