1
Effect of volume-fraction dependent agglomeration of nanoparticles on
the thermal conductivity of nanocomposites: applications to epoxy
resins, filled by SiO2, AlN and MgO nanoparticles
H. Machrafi*1,2, G. Lebon1, C.S. Iorio2
1
Université de Liège, Thermodynamics of Irreversible Phenomena, Allée du 6-Août, 19, 4000 Liège, Belgium
2Université Libre de Bruxelles, Physical Chemistry, Av. Roosevelt 50, 1050 Brussels, Belgium
*Corresponding author: H.Machrafi@ulg.ac.be & Hatim.Machrafi@ulb.ac.be
Abstract. A thermodynamic model for transient heat conduction in ceramic-polymer nanocomposites is proposed. The model takes into account particle’s size, particle’s volume fraction, and interface characteristics with emphasis on the effect of agglomeration of particles on the effective thermal conductivity of the nanocomposite. The originality of the present work is its basement on extended irreversible thermodynamics, combining nano- and continuum-scales without invoking molecular
dynamics. The model is compared to experimental data using the examples of SiO2, AlN
and MgO nanoparticles embedded in epoxy resin. The analysis is limited to spherical nanoparticles. The dependence of the degree of agglomeration with respect of the volume fraction of particles is also discussed and a power-law relation is established through a kinetic mechanism and experiments performed in our laboratory. This relation is used in
2
our theoretical model, resulting into a good agreement with experiments. It is shown that the effective thermal conductivity may either increase or decrease with the degree of agglomeration.
Keywords: A. Nano particles; A. Polymer-matrix composites; B. Thermal properties; C. Modeling; D. Scanning electron microscopy
1. Introduction
Polymeric nanocomposites are used in a broad variety of applications and industrial domains such as microelectronic packaging, coatings, adhesives and fire-retardant. In thermal applications, the often low thermal conductivity of the polymeric matrix is typically increased by dispersing in the host matrix inorganic fillers, such as aluminium nitride (AlN) [1,2], boron nitride (BN) [3] and carbon nanotubes [4], or
more specifically, ceramic fillers, such as aluminum oxide (Al2O3) [5]. Another way is
to design a new material where the material orientation is controlled [6, 7]. When fillers are used, to determine their influence on the thermal conductivity of nanocomposites, it is required to set up models that predict the behavior of the thermal conductivity as a function of several parameters [8].
In the case of micro-particles, Fourier’s law of heat conduction provides a valuable approach. However, in presence of nanoparticles, Fourier’s law is no longer applicable and new models should be developed to include small space scales. Several formalisms have been proposed which describe how bulk thermal properties are influenced by the addition of nanoparticles. Principally, molecular dynamics approaches
3
based on phonon’s Boltzmann transport equation [9-11] or ad-hoc semi-analytical formulations [12, 13] have been developed. The original aspect of the present work is that it is based on Extended Irreversible Thermodynamics (EIT) [14]. The basic foundation of this theory is to elevate the heat flux and higher order fluxes to the rank of independent variable at the same ground as the temperature. The theory is well suited to cope with non-local effects, which are important when the space scale becomes comparable or smaller than the mean free path of the phonons. In the present paper, EIT will be coupled to the effective medium approach (EMA) [15-17], which allows to assimilate the nanocomposites, which are heterogeneous materials, to effective homogenized media.
In the foregoing, we examine the significance of various effects on the effective thermal conductivity of the system, namely the particle’s shape and size, the volume fraction of particles, and the boundary matrix-particle interface resistance. We focus also on the influence of nanoparticles’ clusters and their progressive agglomeration. For the sake of simplicity, the particles are supposed to be spherical and monodisperse. Many experiments have been performed on investigating the role of agglomeration [18-22], which will therefore be given a special attention. The majority of models taking into account nanoparticles’ agglomeration introduce an agglomerate radius that is kept fixed [23] or consider a change in agglomerate’s size due to aging [21], without examining the influence of volume fraction on the degree of agglomeration. This point will receive a particular attention in this work and a relation between the degree of agglomeration and the particle volume fraction will be established experimentally. This relation will be used as one of the inputs in our model in order to predict the effective thermal conductivity.
The paper is organized as follows. In Section 2, we reformulate the EMA to take into account the presence of agglomeration. This is followed by a short description of
4
EIT. In Section 3, the effect of agglomeration on the effective thermal conductivity of the nanocomposites is investigated. The theoretical model is illustrated by means of three
particulate nanocomposites, namely SiO2, AlN and MgO.particles embedded in
diepoxide-bisphenol-A, hereafter named epoxy. Section 4 is devoted to experimental data about the morphology of the nanoparticles and the correlation between the degree of agglomeration and the volume fraction. The final matching between theoretical and experimental date is presented in Section 5. Conclusions are drawn in Section 6.
2. Theoretical model
After giving a general description the effective medium approach, we present a modified version taking into account the possibility of formation of agglomeration of nanoparticles Afterwards, we briefly recall the derivation of the effective heat conductivity of the host matrix and the individual nanoparticles.
2.1. Effective Medium Approach
Our main purpose is to model heat transport associated to dispersion of nanoparticles in a bulk material, called the matrix. The description of such a heterogeneous two-component medium can be simplified by appropriately homogenizing it, as described within the effective-medium approach, first introduced by Maxwell [24] in the framework of electrical conductivity. Following the lines of thought of Hasselman
[25] and later on by Nan et al [26], the effective heat conductivity of the
5
= ( ) ( )
( ) ( ) . (1)
In this equation, k is the heat conductivity coefficient, subscripts and refer to the
matrix, and suspended particle respectively, is the volume fraction of the particles and is a dimensionless parameter related to the particle-matrix interface given by
= / , (2)
where is the radius of the nanoparticle, is the thermal boundary resistance coefficient
and the so-called Kapitza radius. Throughout the present analysis, it is assumed that
the nanoparticles are characterized by a diffusive surface, meaning that the direction of phonons after impact is independent of the direction of the impacting phonons, this is justified as the interface between matrix and agglomerates is generally rougher than that between the individual particles and the matrix. The roughness of the surface can be macroscopically simulated by introducing a surface parameter, called the specularity, . We would use instead of the nanoparticle radius a so-defined specular nanoparticle radius:
, ≡ . Purely diffusive surfaces, which is the case in our work, are characterized
by = 0. If the surface is perfectly smooth, one would have → 1. In the latter case, the
thermal boundary resistance would be completely negligible. In the case of diffusive
interfaces ( = 0), R writes as [16]
6
with standing for the volumetric heat capacity and for the group velocity.
2.2. Effect of agglomeration
To account for the formation of nanoparticles in nanofluids or nanocomposites in the form of aggregates, Chen et al. [18] introduced a modification in the conventional Hamilton-Crosser model [27], by first substituting by the agglomerate volume fraction
, defined as
= , (4)
where , is the agglomerate radius and a fractal index. has typical values of 1.6∼2.5
for aggregates of spherical nanoparticles and 1.5∼2.45 for those of rod-like nanoparticles depending on the type of aggregation, chemistry environment, particle size and shape, and shear flow conditions [28]. The value for is often taken equal to 1.8 and since the thermal conductivity appears to depend only weakly on its value [18, 28-31], we will here work with this value.
In presence of agglomerates, Chen et al [18] propose to modify expression (1) of the effective thermal conductivity as follows
= ( ) [( ) ]
7
wherein has been replaced by and by , the agglomerate thermal conductivity.
For a binary mixture of homogeneous spherical inclusions (recall that we approximate the nanoparticles in this study as spheres), the mean field approach [32] leads to the result
= 3 − + 2 − + 8 + 3 − + − 2
(6)
where = is the volume fraction of particles in the aggregates. In absence of
agglomeration, for which there is only one particle per aggregate, one has = 1 and
reduces to , as it should.
2.3. Effective thermal conductivity of the matrix and the nanoparticles
To close the problem, it remains to determine the expressions of and .
According to the classical Boltzmann-Peierls kinetic theory, the heat conductivity of the
matrix is given, at fixed reference temperature ( ), by
= (1/3)( Λ )| . (7)
wherein Λ is the mean free path of the phonons in the matrix. Following Matthiesens’
rule, it is of the form
=
8
with Λ , designating the contribution from the bulk and Λ , the supplementary
contribution arising from collisions at the agglomerate-matrix interface, the latter being given by [16],
Λ , = 4 , /3 . (9)
Note that this expression differs from the one given in [16] in that the agglomerate volume
fraction is used instead of and the agglomerate radius instead of the radius .
We are now left with the determination of . Instead of using an expression
similar to Eq. (9) for , we propose a new closed-form formula,
= ( ), (10)
consisting in a constant value multiplied by a correction factor ( ), which takes
into account the nano scale of the particles through the Knudsen number defined
below. The quantity is the thermal conductivity, at a given reference temperature, of
the bulk material of which the nanoparticle is composed of
= , | , (11)
its expression being analogous to ( 9) for the matrix, i.e.
9
With the difference that now the mean free path is the bulk one (so that Λ = Λ , ), the
contribution of the collisions are hidden in the correction factor ( ). The latter will be
determined from EIT and depends on the radius of the particle and on the mean free path
of the phonons inside the particle, Λ , , so that it is rather natural to define the Knudsen
number as
≡ Λ , / , . (13)
At nanoscales, heat transport is mostly influenced by non-local effects. The classical Fourier law
= − , (14)
relating the heat flux vector to the temperature gradient is not applicable at small
time and spatial scales. In order to account for small scale times or high frequencies, Fourier’s law has been generalized by Cattaneo [14] under the form
+ = − , (15)
with designating the relaxation time of the heat flux and the time derivative.
Unfortunately, Cattaneo’s relation is not able to cope with non-local effects which are dominant at small length scales. These non-local effects are elegantly introduced in the
framework of EIT by appealing to a hierarchy of fluxes ( ), ( ), ..., ( ) with ( )
identical to the heat flux vector , ( ) (a tensor of rank two) is the flux of , ( ) the
10
represent the higher moments of the velocity distribution. Omitting non-linear contributions in the fluxes, the hierarchy of equations can be cast in the form (see for more details chapter 4 in Ref. 4)
∇ − + ∇ ∙ ( )= ( ), (16)
∇ ( )− ( )+ ∇ ∙ ( ) = ( ), ( = 2,3, …), (17)
wherein , and are phenomenological coefficients related to the relaxation times,
correlation lengths and transport coefficients, respectively. Equation (16) is a generalization of Cattaneo’s law (15). We now consider an infinite number of flux variables and apply the spatial Fourier transform
( , ) = ∫ ( , ) ⋅ (18)
to the whole set of equations (16) and (17), with the Fourier transform of , the spatial variable, the time and the wavenumber. This operation leads to the following time-evolution equation for the heat flux:
̅( ) ( , ) + ( , ) = − ( ) ( , ), (19)
where ̅( ) = / designates a renormalized relaxation time depending generally on
while the quantity of interest in our study, namely the –dependent heat conductivity ( ) is given by the continued-fraction
11
( ) =
⋯
, (20)
with the correlation length defined by = /( ). To obtain the result (20), it
was assumed that the relaxation times ( > 1) corresponding to higher order fluxes
are negligible with respect to , which is a hypothesis generally well admitted in kinetic
theories. In the present problem, there is only one dimension, namely , so that it is
natural to define ≡ 2 / . By selecting the correlation lengths as = , with
= /(4 − 1) and identified as the mean free path independently of the order of
approximation [33], in the asymptotic limit ( → ∞), the continued fraction (20) reduces
to
=
( )− 1 , (21)
leading finally to the following expression for the factor ( ):
( ) =
( )− 1 . (22)
We have now collected all the ingredients allowing us to determine the effective heat conductivity (5) of the system nanoclusters /matrix. We further proceed by applying our model to practical situations with different nanoparticle types embedded in a host material.
12
3. Preliminary considerations
3.1. Outline
The systems examined in this work are respectively SiO2, AlN and MgO
nanoparticles embedded in an epoxy resin. The material properties of these components are given in Table 1.
Table1: Material properties for bulk materials at room temperature ( )
Material Heat capacity
[MJ/(m3K)]
Group velocity [m/s]
Mean free path [nm] Epoxy resin 1.91a 2400a 0.11b SiO2 1.687c 4400c 0.558c AlN 2.7d 6980d 51e MgO 3.32f 7028g 4.76h aReference [34]
bCalculated from Λ = 3 / by considering = 0.168 Wm-1K-1 from Reference [20]
cReference [35] dReference [36]
eCalculated from Λ = 3 / by considering = 319 Wm-1K-1 from Reference [36]
fCalculated from experimental correlation given in Reference [37]
gCalculated from = 3 / Λ by considering = 37 Wm-1K-1 from Reference [38]
hInterpolation from data at pages 625 and 626 from Reference [38]
Note that the values in Table 1 have been obtained in the framework of the so-called “dispersion model” [39] where it is admitted that the phonons have different energies and
13
velocities due to their dispersion. In a previous work [40], we have studied the SiO2
-epoxy mixture in absence of agglomeration, i.e. by using the present model with =
and = . Satisfactory agreement with experiments [20] was observed. For the sake
of comparison, the results are recalled in Fig. 1(a) for a particle radius = 10 nm. It is
clear that for this system, the dependence with respect to agglomeration is negligible and will therefore no longer be discussed in the following. In contrast, in the case of the mixture AlN-epoxy [20], the theoretical model fails to fit the experimental data as shown
in Fig. 1(b) for a primary particle radius = 11 nm: the experimental values are larger
than those predicted by the model.
Fig. 1. Effective thermal conductivity as a function of the volume fraction for a (a)
SiO2-epoxy and (b) AlN-epoxy system in absence of agglomeration. Experimental data
from [20] are represented by the symbol ▲.
It may be asked whether the discrepancies noted for AlN/epoxy are not due to the effect of particle agglomeration. This is indeed confirmed by the results commented in Section 3.3. In relation with the formation of clusters, an important parameter is the agglomerate radius, sometimes, called the gyration radius, which therefore, deserves further comments. 0.00 0.02 0.04 0.06 0.08 0.10 0.16 0.18 0.20 0.22 0.24 k e ff W m 1 K 1 0.00 0.02 0.04 0.06 0.08 0.10 0.16 0.18 0.20 0.22 0.24 k e ff W m 1 K 1
14
3.2. On the agglomerate gyration radius
When the density of nanoparticles distributed in a matrix becomes important, the particles have a tendency to coagulate and, as in colloid suspensions, lead to the formation of clusters. Assuming that such clusters fit into a virtual sphere, we can define the
agglomeration gyration radius , as the radius of such a virtual sphere. Using Eq. (4),
we are able to find the agglomerate radius as a function of the particle radius.
The results of Fig 1.a indicate that SiO2 particles hardly agglomerate and therefore
, ≈ , the same observation being made in [20] but this represents a rather
exceptional situation. In the case of Al2O3 particles dispersed in water, Chen et al [19].
propose , ≈ 3 , while Anoop et al [22] take , = 5 . Other authors [21] reported
for < , < 4 . In the case of Si/Ge nanocomposites, Behrang et al [23] use , =
5 . Rheology experiments [18] predict , = 3.34 for TiO2 dispersed in ethylene
glycol with similar values obtained for Al2O3 dispersed in the same alcohol [20]. In the
forthcoming, we consider AlN and MgO nanoparticles for which experimental gyration radii have been measured in our laboratory (see Section 4).
3.3. Numerical results and a first comparison with experimental data
The results for the effective thermal conductivity as a function of the particle volume fraction of the original particles for several values of the agglomerate radii are presented in Fig. 2 for AlN and MgO nanoparticles embedded in epoxy resin, respectively. To assess the role of the agglomeration, we have also drawn the curves
15
corresponding to absence of clustering for which , = . It appears from the selected
examples that heat conductivity increases with the volume fraction of the nanoparticles as a consequence of a larger specific interface area between particles and matrix. The formation of clusters has a different effect according to the size of the cluster. For a fixed value of the volume fraction, it is a factor of enhancement of the thermal conductivity up to a gyration radius a little bit larger than the diameter of the particles but beyond this limit, this doping effect is inversed because it corresponds to a reduction of the interface area. A more detailed discussion will follow later on.
Fig. 2. Effective thermal conductivity versus the original particle volume fraction for
AlN/epoxy (left) and MgO/epoxy (right) at several agglomerate radii , , with =
30 for AlN and = 11 for MgO. The curves represent our model and the
symbol ▲ denotes experimental values [20].
By comparison with experimental data, our model is shown to predict satisfactory agreement at low volume fractions < 10%. In the case of AlN particles, the best agreement
is reached for , ≳ 2 at low volume fractions (φ < 0.01) and for , ≈ 3.5 at
higher volume fractions. For MgO particles, a good accord is found for , ≈ 2 at low
volume fractions ( < 0.02) and for , ≈ 5 at higher density. When the volume
0.00 0.02 0.04 0.06 0.08 0.10 0.20 0.25 0.30 k e ff W m 1K 1 0.00 0.02 0.04 0.06 0.08 0.10 0.12 0.14 0.20 0.25 0.30 0.35 0.40 k e ff W m 1 K 1 , = , = 2 , = 2.5 , = 3 , = 4 , = , = 2 , = 2.5 , = 4 , = 6
16
fraction of the nanoparticles is small, the particles will have less chance to collide with each other and the formation of agglomerates is less important. As the volume fraction is raising, the interaction between the nanoparticles is increased and so do the agglomerate radii. A further validation of our model is given in the next section wherein it is compared which experimental data obtained in our laboratory.
4. Experimental and theoretical investigation of the degree of agglomeration
4.1. Nanoparticle morphology characterization
As a preliminary, it is interesting to discuss the morphology of the nanoparticles. In that respect, we have performed scanning electron microscopy (SEM), obtaining images of the nanoparticles at different zooms. The nanoparticle powders are first sputter-coated in gold and then placed on a graphite support into a specimen chamber. Fig. 3 reproduces the SEM-images of AlN and MgO.
17
Fig. 3. SEM images of AlN (upper) and MgO (lower) with zooms of 500x, 5,000x and 50,000x, from left to right.
The observations indicate that AlN exhibits a very compact structure and many large agglomerates are present with a narrow distribution. The structure of MgO is, on the other hand, less compact. Also the clusters of MgO appear to have a larger distribution with a weaker agglomeration. The particle shapes of both materials are the more visible in Figure 4 with a larger zoom. These images may also useful to draw some information about the size of the particles.
18
Fig. 4 shows that the AlN nanoparticles are clearly discernable having quasi-regular shapes of cubic-spheroidal type, while the MgO nanoparticles seem to be close to regular spheroidal shapes. These observations justify that at least within a first approximation, we identify in our theoretical model that the particles are taken as rigid spheres, with a given size distribution. As for the particle sizes, we can from Fig.4 obtain a mean value for the pseudo spheres’ radii. It is found that the mean particle size values
(taken as the equivalent diameter 2 ) is 54 ± 14 nm for AlN and 53 ± 22 nm for MgO.
This confirms the larger size distribution of MgO with respect to AlN.
4.2. Correlation between degree of agglomeration and volume fraction
The results of Fig. 2 suggest that there exists a strong correlation between the
gyration radius , and the volume fraction . Note that is determined at the stage
before the polymerization step occurs [20] by dispersing the nanoparticles into the fluid
matrix, which is often water-based. To determine the validity of the relation , ( )
expressing the volume-fraction dependence of the gyration radius, we follow a simplified protocol which consists in dispersing the nanoparticles in a solvent, say ethanol or water without any dispersion agent and measuring the agglomerate radius distribution versus the initial particle volume fraction (the volume fraction’s values shows an error less than 1%). Our procedure refers to [20] wherein the AlN and MgO nanoparticles are first dissolved in ethanol and then sonicated to break up in large agglomerates. The nanoparticles are then dispersed in the epoxy resin by shear force mixing. The solvent is afterwards evaporated and the composite is mixed with a hardener via mechanical stirring prior to degassing. Finally, the mixture is cured, obtaining the polymer nanocomposite.
19
What is of importance, is that the nanoparticles are first dissolved in a solvent with a given volume fraction. In [20], the solvent is ethanol, but water is also often used, presenting similar characteristics [41] (see also [42] for polymer/clay nanocomposites). It appears that after dispersing the nanoparticle/solvent mixture within the epoxy resin, the size of the particles does not change significantly during curing [42]. We can thus safely approximate the particle size distribution as still being mainly established in the solvent. Therefore, for our study, it is sufficient to analyze the agglomeration behavior of the nanoparticles in the solvent at different volume fractions. We select water as the solvent because of the limitations of our particle size measuring device, working exclusively with water. We used a Shimadzu (SALD-7500) nano particle size analyzer that uses laser diffraction to determine the particles size distribution. Fig. 5 provides two examples of the Nanosizer output for AlN and MgO particles, the volume fraction being fixed equal to 0.1.
Fig. 5. Particle size (2 , ) distribution of AlN (left) and MgO (right) at = 0.1.
Fig. 5 shows a narrower distribution for AlN than for MgO. For visibility purposes, and also because these graphs represent intermediate results, the error bars have
0 2 4 6 8 10 12 14 16 1 0 30 50 70 90 1 3 0 1 7 0 2 3 0 3 1 0 4 2 0 5 8 0 7 8 0 1 0 6 0 1 4 4 0 1 9 5 0 2 6 5 0 3 6 0 0 N u m b er o f p ar ti cl es [ % ] Particle size [nm] 0 1 2 3 4 5 6 7 8 9 10 1 0 30 50 70 90 1 3 0 1 7 0 2 3 0 3 1 0 4 2 0 5 8 0 7 8 0 1 0 6 0 1 4 4 0 1 9 5 0 2 6 5 0 N u m b er o f p ar ti cl es [ % ] Particle size [nm]
20
been deleted. From the above particle size distributions, we are able to calculate the mean
particle radius ( , ) for each volume fraction. Knowing the initial particle size ( ), we
can trace the degree of agglomeration ≡ , / with a certain standard deviation
(indicated by error bars), against the volume fraction ( = 1 means no-agglomeration).
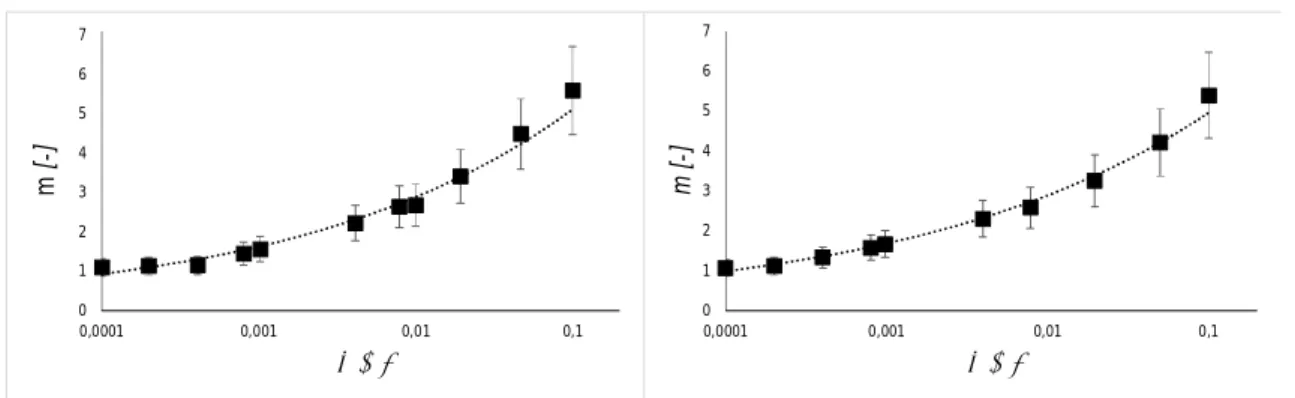
The results are presented in figure 6.
Fig. 6. Degree of agglomeration against the nanoparticle volume fraction for AlN (left) and MgO (right). The symbol ■ denotes the experimental findings and the dashed line is a trend line.
The above results indicate that the agglomerate radius increases with the volume fractions. Such an influence of the suspension’s concentration on the particle size distribution, and consequently the degree of agglomeration, is also observed in [43]. Our next task is to determine the fitting law coping with the experimental data. It is shown in the appendix that a suitable expression for the volume-fraction dependence of the degree of agglomeration is provided by a power law in the form
= . (23) 0 1 2 3 4 5 6 7 0,0001 0,001 0,01 0,1 m [-] j [-] 0 1 2 3 4 5 6 7 0,0001 0,001 0,01 0,1 m [ -] j [-]
21
Fitting the trend line (23) with the experimental findings from figure 6 leads to the values of the parameters and , given in table 2. It is worth to stress that the values of the parameters are of the same order of magnitude for both systems.
Table 2. Fitting parameters for the degree of agglomeration
AlN MgO
9.0 8.5
0.25 0.23
5. Final validation of dependence of the effective thermal conductivity versus the volume-fraction-dependent agglomeration
The main interest of (23) is that it allows to represent the effective thermal conductivity exclusively in terms of the initial particle volume fraction, without making loose assumptions about the degree of agglomeration. Now, figure 7 shows the effective thermal conductivity, adapted for the volume-fraction-dependent agglomeration gyration radius, as a function of the volume fraction. For comparison, the effective thermal conductivity, not taking into account the agglomeration effect, is given as well.
22
Fig. 7. Effective thermal conductivity as a function of volume fraction (dashed line), using the fitted relation (23) between the agglomerate radius and the volume fraction for AlN-epoxy (left) and MgO-epoxy (right). The solid line refers to absence of agglomeration in the model and the symbol ▲ represents the experimental values from
[20], with = 30 and 11 nm for AlN and MgO, respectively.
Fig. 8. Effective thermal conductivity as a function of volume fraction (dashed line), using the fitted relation (23) between the agglomerate radius and the volume fraction for AlN-epoxy. The solid line refers to absence of agglomeration in the model and the symbol ▲ represents the experimental values from [44] (left) and [45] (right), respectively, with
= 50 nm.
The results reported on Figs.7 and 8 indicate a good agreement between our model
and experience. Note especially that the sharp increase at 0 < < 0.01 for AlN is well
0.00 0.02 0.04 0.06 0.08 0.10 0.12 0.14 0.16 0.18 0.20 0.22 0.24 0.26 0.28 0.30 k e ff W m 1 K 1 0.00 0.02 0.04 0.06 0.08 0.10 0.12 0.14 0.16 0.18 0.20 0.22 0.24 0.26 0.28 0.30 k e ff W m 1 K 1 0.00 0.02 0.04 0.06 0.08 0.10 0.12 0.14 0.16 0.18 0.20 0.22 0.24 0.26 0.28 0.30 k e ff W m 1 K 1 0.00 0.02 0.04 0.06 0.08 0.10 0.12 0.14 0.16 0.18 0.20 0.22 0.24 0.26 0.28 0.30 k e ff W m 1 K 1
23
represented by our model, stemming from expression (23). One important conclusion is that it is imperative to take into account the dependence of the agglomeration radius on the volume fraction in the study of agglomeration effects on the thermal conductivity of nanocomposites.
Another observation is in form. Fig. 2 indicate that, at fixed -values, the effective
thermal conductivity first increases with the degree of agglomeration , and, after
reaching a maximum value, at ≈ 2.5, it starts decreasing towards a constant value. This
may be interpreted by the fact that for weak degrees of agglomeration, the dimension of
the particles remains small whence a large and a large values of (see Eq. (21)); by
increasing the size of the agglomerate, the interface between the agglomerate and the host-matrix is increased and subsequently, the thermal boundary resistance leading to a decrease of the thermal conductivity.
To illustrate the property that agglomeration may either contribute to an increase or a decrease of the heat conductivity, we have represented in Fig. 9 the effective thermal
conductivity (normalized with respect to = 1) as a function of the degree of
agglomeration for three values of the volume fraction; = 0.01, 0.05 and 0.1. It is
observed that heat conductivity first increases linearly with the degree of agglomeration, reaches a maximum at the percolation threshold and finally decreases. The raising of conductivity with size (at nanoscale) was confirmed by many authors [46-51] in the case of epoxy resin with various fillers and by Prasher et al [31, 52] in the case of nanofluids.
The increase of at small -values may be explained because of the weak
agglomeration of the particles so that the regime is that of dispersed primary particles. In this case, the effective heat conductivity is increasing with the size of the nanoparticles [53] because of the smaller thermal interfacial resistance between particles and matrix
24
(see relation (2)). However, after reaching a peak, at larger -values (say cluster radii
larger than the diameter of the original particles), the influence of agglomeration becomes dominating; the contact area of the agglomerates themselves becomes smaller, which leads to less heat conduction between the agglomerates and the matrix. Moreover, the contact area of the particles within the agglomerates is raising, which causes a larger boundary resistance due to more phonon collisions (see relations (2) with (7)-(9)), which reduces the heat conduction within the agglomerates as well. Hence, the effective heat
conductivity decreases altogether with increasing size at larger -values. These results
are in agreement with those reported in Fig. 2 as well as an experimental study by Moreira
et al. [54]. Note that there is a maximum value of which corresponds to = 1, i.e.
= . Making use of the result (4), it is easily checked that the maximum of m is
= = . (24)
after that D has been selected as given by = 1.8.
Fig. 9. Effective normalized thermal conductivity of the AlN-epoxy (left) and MgO (right) systems as a function of the degree of agglomeration , for three volume fractions
1 2 3 4 5 6 7 1.0 1.1 1.2 1.3 1.4 1.5 m kn ef f 1 2 3 4 5 6 7 1.0 1.1 1.2 1.3 1.4 1.5 m kn ef f = 0.01 = 0.05 = 0.1 . 7 = 0.01 = 0.05 = 0.1 . 7
25
= 0.01, 0.05 and 0.1. Dots represent the normalized values taken from Fig. 7 at the corresponding volume fractions.
As expected, the sensibility of versus agglomeration is the most important at
high particles densities. The dots are the normalized effective thermal conductivity values determined from our theoretical model (see figures 7 and 8) at the corresponding volume fractions. If it is wished to increase the effective thermal conductivity of the nanocomposites discussed in this paper, the results of Fig. 9 indicate that the degree of agglomeration (or the agglomeration radius) should be decreased, this can for instance be achieved in practice by adding surfactants [55, 56]). One should however remain cautious
to avoid to reduce beyond the maximum critical value ≈ 2.5.
The above results are in good agreement with the experimental ones obtained by Kochetov et al. [20] based on Transmission Electron Microscopy (TEM) micrographs. For AlN and MgO dispersed in epoxy resin with particle radii of 30 and 50, and 11 nm, respectively, it follows from [20, 44, 45] that the nanocomposite agglomerate radii are at maximum 200 and 50 nm, respectively. This leads to maximum degrees of agglomeration
of approximately = 6 and 5, which is in good accord with the results of Fig. 9.
6. Conclusions
The objective of this work is twofold. Firstly, to determine to which extent the nanocomposites investigated in the present work do agglomerate and, secondly, to study the influence of agglomeration on the effective thermal conductivity. The effective
26
medium approach (EMA) is used to homogenize the medium whereas the particle-matrix interaction is modelled on the bases of extended irreversible thermodynamics (EIT). Besides agglomeration, other effects are taken into account as particle size, particle volume fraction and thermal boundary resistance. The particles are supposed to be of spherical form and the analysis has been limited to purely diffusive scattering of phonons on the interface, we have already checked in a previous work [40] that the role of specularity of the surfaces is only minute for the kind of nanoparticles studied in this work. Extension to particles of different shapes will not raise fundamental difficulties and will be explored in the future.
With respect to similar works on the subject, we wish to point out two original contributions. The first one is linked to the use of EIT leading to the establishment of relation (22), the second one is that the degree of agglomeration is explicitly expressed as a (power-law) function of the volume fraction (see Eq. (23)). To our knowledge, such an effect was not taken into account so far.
The present model has been validated against experimental data in the case of
SiO2, AlN and MgO nanoparticles embedded in an epoxy matrix. It is shown that the
SiO2-epoxy system does not exhibit significant agglomeration, whereas for the two other
systems, clustering is relevant. Some of the results are based on experiments performed in our laboratory. As expected, the degree of agglomeration increases with the volume fraction. It follows also from our analysis that, at a fixed volume fraction, the effect of agglomeration is either to increase or to decrease the effective thermal conductivity: at
loose agglomeration, tend to increase, while for more compact agglomerates, a
decrease occurs. A similar behavior was noticed by Behrang et al. [23] and Moreira et al. [54].
27
Acknowledgements
The authors gratefully acknowledge Ir. Patrizio Madau at the “Materials engineering characterization, synthesis and recycling” group of ULB, and Ir. Jean-Charles Dupin and Dr. Christophe Minetti at the “Chemical-Physics” group of ULB for the experimental measurements. H.M. and C.S.I acknowledge partial supports from BelSPo (PRODEX programme) and from NATO – Science for Peace and Security – Programme with grant number 984961. G.L. acknowledges support from the collaborative project Bruxelles - Wallonie - Québec through grant RI 15, biennium 2015-2017.
Appendix: Aggregative growth
The present appendix provides a qualitative demonstration of the most suitable mathematical form for the volume-fraction dependence of the degree of agglomeration. We start by considering a simple kinetic mechanism called “aggregative growth” [57]. Accordingly, the kinetics of agglomeration are governed by the following equations
+ → , (A1)
28
where stands for the nanoparticles and for the agglomerate. The “nucleation rate”, defined as the rate of the first agglomerate formed from the initial nanoparticles, is given by
− = [ ] , (A3)
with the rate constant of nucleation and the square brackets denote the molar
concentration. Note that the term in (A3) stands for the consumption of due to
nucleation only. The “agglomerative growth rate”, defined as the rate of the agglomerates growing due to more adhering nanoparticles, is given by
− = [ ][ ] , (A4)
wherein kg is the rate constant of agglomerate growth. Note that in (A4) stands for the
consumption of due to agglomerates’ growth only. Similar relations can be written for the formation rate of the agglomerate. From (A1) and (A2), we deduct the mass balance
[ ] = [ ] − 2[ ] , (A5)
where the subscript “0” stands for the initial value, noting that at the beginning no
agglomerate is present, i.e. [ ] = 0. The factor “2” stems from the ratio : ≡ 2: 1, so
that conservation of mass imposes to double the concentration of . It follows from (A5)
29
= [ ] + [ ][ ]. (A6)
Making use of the initial conditions [ ]| = [ ] = 0 and [ ]| = [ ] , and relation
(A5), the solution of equation (A6) is given by
[ ] = [ ]
[ ]
[ ] (A7)
It is easy to verify from (A7) that for → ∞, [ ] = [ ] . This shows that the
concentration of the agglomerates presents a maximum and this is also true for its size. More interesting, it is seen that the final agglomerate concentration depends on the initial nanoparticle concentration. This indicates that the agglomerate size (and therefore also the degree of agglomeration) is a function of the initial volume fraction of the nanoparticles. We can define the number of nanoparticles in an agglomerate at a given
time, , by the proportionality law
= [ ]
[ ] , (A8)
with the final number of nanoparticles in the agglomerate. Of course, for → 0, =
0 and for → ∞, = . The factor 2 stems from the mass balance (A5). However, the
30
sonicated, will not reach but rather an intermediate value so that equation
(A8) should rather be written as
= [ ]∗
[ ] , (A9)
where [ ]∗< [ ] /2. A relation between the agglomerate’s size and the number of
nanoparticles in the agglomerate can be postulated as
∝ , (A10)
with ≠ 1/3 ( = 1/3 corresponds to spherical particles and the agglomerate of
spherical form as well), meaning that the agglomeration is fractal [58]. Moreover, is a constant composed out of material constants and geometrical data, being of no importance for the present development. Coupling equations (A9) and (A10) results in
∝ ∝ [ ]
[ ]∗ . (A11)
We note also that [ ] ∝ (which is indirectly also observed by [59] as ∝ ) and
that ∝ . This brings us to the conclusions that the most suitable fitting for the
experimental results in Fig. 6 is the power law given by (23).
31
[1] Xie, SH, Zhu BK, Li JB, Wei XZ, Xu ZK. Preparation and properties of polyimide/aluminum nitride composites, Polym Test 2004; 23: 797–804.
[2] Xu Y, Chung DDL. Increasing the thermal conductivity of boron nitride and aluminum nitride particle epoxy-matrix composites by particle surface treatments, Compos Interf 2000; 7: 243–56.
[3] Agarwal S, Khan MMK, Gupta RK. Thermal conductivity of polymer
nanocomposites made with carbon nanofibers, Polym Eng Sci 2008; 48: 2474–2481. [4] Wong CP, Bollampally RS. Comparative study of thermally conductive fillers for use in liquid encapsulants for electronic packaging, IEEE Trans Adv Pack 1999; 22: 54–59.
[5] Han Z, Wood JW, Herman H, Zhang C, Stevens GC. Thermal Properties of Composites Filled with Different Fillers, Int. Symp. Electrical Insulation (Vancouver) 2008; pp. 497–501.
[6] Fukushima K, Takahashi H, Takezawa Y, Hattori M, Itoh M, Yonekura M. High thermal conductive epoxy resins with controlled high-order structure [electrical
insulation applications], Conf. Electrical Insulation and Dielectric Phenomena (Boulder CO) 2004; pp. 340–343.
[7] Miyazaki Y, Nishiyama T, Takahashi H, Katagiri JI, Takezawa Y. Development of highly thermoconductive epoxy composites, Conf. Electrical Insulation and Dielectric Phenomena (Virginia Beach, VA) 2009; pp 638–641
[8]. Ordonez-Miranda J, Alvarado-Gil JJ. Thermal conductivity of nanocomposites with high volume fractions of particles, Compos Sci Techn 2012; 72: 853-857.
32
[9] Tian WX, Yang RG. Phonon transport and thermal conductivity percolation in random
nanoparticle composites, Comput Model Eng Sci 2008; 24: 123–141.
[10] Tian WX, Yang RG. Effect of interface scattering on phonon thermal conductivity percolation in random nanowire composites. Appl Phys Lett 2007; 90: 263105–263108. [11] Yang RG, Chen G, Dresselhaus SM. Thermal conductivity of simple and tubular nanowire composites in the longitudinal direction, Phys Rev B 2005; 72: 125418– 125424. [12] Prasher R. Thermal boundary resistance of nanocomposites, Int J Heat Mass Tran 2005; 48: 4942–4952.
[13] Jou D, Casas-Vazquez J, Lebon G. Extended Irreversible Thermodynamics, 4rth edition, New York, Dordrecht, Heidelberg, London: Springer, 2010.
[14] Cattaneo C, Sulla conduzione del calore, Atti Seminario Matematico e Fisico delle Università di Modena 1948; 3: 83-101.
[15] Nan CW, Birringer R, Clarke DR, Gleiter H. Effective thermal conductivity of particulate composites with interfacial thermal resistance. J Appl Phys 1997; 81: 6692– 6699.
[16] Minnich A, Chen G. Modified effective medium formulation for the thermal conductivity of nanocomposites, Appl Phys Lett 2007; 91: 073105–073107.
[17]Tavman IH, Akinci H. Transverse thermal conductivity of fiber reinforced polymer
composites, Int Comm Heat Mass Transfer 2000; 27; 253–261.
[18] Chen H, Witharana S, Jin Y, Kim C, DingY. Predicting thermal conductivity of liquid suspensions of nanoparticles (nanofluids) based on rheology, Particuology 2009; 7: 151–157.
33
[19] Chen H, Ding Y, Tan C. Rheological behaviour of nanofluids, New Journal of Physics 2007; 9: 367-390.
[20] Kochetov R, Korobko AV, Andritsch T, Morshuis PHF, Picken SJ, Smit JJ.
Modelling of the thermal conductivity in polymer nanocomposites and the impact of the interface between filler and matrix, J Phys D: Appl Phys 2011; 44: 395401.
[21] Timofeeva EV, Gavrilov AN, McCloskey JM, Tolmachev VV. Thermal
conductivity and particle agglomeration in alumina nano-fluids: experiment and theory, Phys Rev 2007; 76: 061203.
[22] Anoop KB, Kabelac S, Sundararajan T, Das SK. Rheological and flow characteristics of nanofluids: Influence of electroviscous effects and particle agglomeration, J Appl Phys 2009; 106: 034909.
[23] Behrang A, Grmela M Dubois C, Turenne S, Lafleur PG. Influence of particle-matrix interface, temperature, and agglomeration on heat conduction in dispersions, J Appl Phys 2013; 114: 014305.
[24] Maxwell JC, Treatise on Electricity and Magnetism, Oxford: Clarendon, 1881. [25] Hasselman DPH, Johnson LF. Effective Thermal Conductivity of Composites with Interfacial Thermal Barrier Resistance, J Compos Mater 1987; 21: 508-515.
[26] Nan CW, Birringer R, Clarke DR, Gleiter H. Effective thermal conductivity of particulate composites with interfacial thermal resistance, J App. Phys 1997; 81: 6692. [27] Hamilton RI, Crosser OK. Thermal conductivity of heterogeneous two component systems, Ind Eng Chem Fund 1962; 1: 187-191.
[28] Wang BX, Zhou LP, Peng XF. A fractal model for predicting the effective thermal conductivity of liquid with suspension of nanoparticles, Int Heat Mass Transfer 2003; 46:2665–2672.
34
[29] Barnes HA, Hutton JF, Walters K. An introduction to rheology, Amsterdam; Elsevier Science: 1989.
[30] Goodwin JW, Hughes RW. Rheology for chemists—An introduction. Cambridge: Baker & Taylor Books: 2000.
[31] Prasher R, Evans W, Meakin P, Fish J, Phelan P, Keblinski P. Effect of
aggregation on thermal conduction in colloidal nanofluids, Appl Phys Lett 2006; 89: 143119.
[32] Hui PM, Zhang X, Markworth AJ, Stroud D. Thermal conductivity of graded composites: Numerical simulations and an effective medium approximation, J Mat Sci 1999; 34: 5497-5503.
[33] Hess S. On nonlocal constitutive relations, continued fraction expansion for the wave vector dependent diffusion coefficient, Z Naturforsch 1977; 32a: 678-684. [34] Duong HM, Yamamoto N, Bui K, Papavassiliou DV, Maruyama S, Wardle BI. Morphology Effects on Nonisotropic Thermal Conduction of Aligned Single-Walled and Multi-Walled Carbon Nanotubes in Polymer Nanocomposites, J Phys Chem C 2010; 114: 8851-8860.
[35] Zeng T, Chen G. Phonon Heat Conduction in Thin Films: Impacts of Thermal Boundary Resistance and Internal Heat Generation, J Heat Transfer 2001; 123: 340-347. [36] Zhao Y, Zhu C, Wang S, Tian JZ, Yang DJ, Chen CK, Cheng H, Hing P. Pulsed photothermal reflectance measurement of the thermal conductivity of sputtered
aluminum nitride thin films, J Appl Phys 2004; 96: 4563.
[37] Harri DC, Cambrea LR, Johnson IF, Seaver RT, Baronowski M, Gentilman R, Nordahl, CS, Gattuso T, Silberstein S, Rogan P, Hartnett T,.Zelinski B, Sunne W, Fest E, Pois WH, Willingham CB, Turri G, Warren C, Bass M, Zelmon DE, Goodrich SM.
35
Properties of an Infrared-Transparent MgO:Y2O3 Nanocomposite, J Am Ceram Soc
2013; 96: 3828–3835.
[38] Carter CB, Norton MG. Ceramic Materials: Science and Engineering. New York; Springer 2007.
[39] Chen G. Thermal conductivity and ballistic-phonon transport in the cross-plane direction of superlattices, Phys Rev B 1998; 57: 14958.
[40] Machrafi H, Lebon G.Effective Thermal Conductivity of Spherical Particulate
Nanocomposites: Comparison with Theoretical Models, Monte Carlo Simulations and Experiments, Int Nanosc 2014; 13: 1450022.
[41] Šupová M, Martynková GS, Barabaszová K. Effect of Nanofillers Dispersion in Polymer Matrices: A Review, Sci Adv Mat 2011; 3: 1-25.
[42]Ammala A, Bell C, Dean K. Poly(ethylene terephthalate) clay nanocomposites:
Improved dispersion based on an aqueous ionomer, Compos Sci Techn 2008; 68: 1328-1337.
[43] Nolte H, Schilde C, Kwade A. Determination of particle size distributions and the degree of dispersion in nanocomposites, Compos. Sci. Techn. 2012; 72: 948-958. [44] Choudhury M, Mohanty S, Nayak SK, Aphale R. Preparation and characterization of electrically and thermally conductive polymeric nanocomposites, J. Min. Mat. Char. Engin. 2012; 11: 744-756.
[45] Kochetov R, Andritsch T, Lafont U, Morshuis PHF, Picken SJ, Smit JJ. Thermal behaviour of epoxy resin filled with high thermal conductivity nanopowders, IEEE Electr. Ins. Conf. 2009: 524-528.
[46] Fu, YX, He ZX, Mo DC, Lu SS. Thermal conductivity enhancement of epoxy adhesive using graphene sheets as additives. Int. J. Thermal Sci. 2014; 86: 276–283.
36
[47] Fu YX, He ZX, Mo DC, Lu SS. Thermal conductivity enhancement with different fillers for epoxy resin adhesives, App. Thermal Eng. 2014; 66: 493-498.
[48] Wang Z, Qi R, Wang J, Qi B. Thermal conductivity improvement of epoxy composite filled with expanded graphite, Ceramics Int. 2015; 41: 13541-46.
[49] Zhou T, Wang X. Cheng P, Wang T, Xiong D, Wang X, Improving the thermal conductivity of epoxy resin by the addition of a mixture of graphite nanoplatelets and silicon carbide microparticles, eXpress Polym. Lett. 2013; 7(7): 585-594.
[50] Hong JP, Sun SW, Hwang T, Oh JS, Hong C, Nam JD. High thermal
conductivity epoxy composites with bimodal distribution of aluminum nitride and boron nitride fillers, Thermochimica Acta 2012; 537: 70–75.
[51] Yu W, Xie H, Yin L,Zhao J, Xia L, Chen L Exceptionally high thermal conductivity of thermal grease: Synergistic effects of graphene and alumina Int J. Thermal Sci. 2015; 91: 76-82.
[52] Prasher R, Phelan PE, Bhattacharya P. Effect of aggregation kinetics on the thermal conductivity of nanoscale colloidal solutions (nanofluid), Nano Lett. 2006; 6(7): 1529-1534.
[53] Lebon G, Machrafi H, Grmela M. An extended irreversible thermodynamic modelling of size-dependent thermal conductivity of spherical nanoparticles dispersed in homogeneous media. Proc. Roy. Soc. A 2015; 471:20150144.
[54] Moreira DC, Braga NR, Sphaier LA, Nunes LCS, Size effect on the thermal intensification of alumina-filled nanocomposites, J. Comp. Mat. 2016, DOI: 10.1177/0021998315624253.
37
[55] Gómez-Graña S, Hubert F, Testard F, Guerrero-Martínez A, Grillo I, Liz-Marzán LM, Spalla O. Surfactant (Bi)Layers on Gold Nanorods, Langmuir 2012; 28: 1453-1459.
[56] Jones OG, Mezzenga R. Inhibiting, promoting, and preserving stability of functional protein fibrils, Soft Matter 2012; 8: 876- 895.
[57] Finney EE, Shields SP, Buhro WF, Finke RG. Gold nanocluster agglomeration kinetic studies: Evidence for parallel bimolecular plus autocatalytic agglomeration pathways as a mechanism-based alternative to an Avrami-based analysis, Chem Mater 2012; 24: 1718−1725.
[58] Yon J, Bescond A, Ouf FX. A simple semi-empirical model for effective density measurements of fractal aggregates, J Aero Sci. 2015; 87: 28–37.
[59] Krishnan A, Xu LR. A simple effective flaw model on analyzing the nanofiller agglomeration effect of nanocomposite materials, J Nanomaterials 2011; 2012: 483093.