UNIVERSITÉ DE SHERBROOKE
Faculté de génie
Département de génie civil
DÉVELOPPEMENT DES BÉTONS
AUTOPLAÇANTS À FAIBLE TENEUR EN
POUDRE, ÉCO-BAP: FORMULATION ET
PERFORMANCE
DEVELOPMENT OF LOW-POWDER
SELF-CONSOLIDATING CONCRETE, ECO-SCC:
DESIGN AND PERFORMANCE
Thèse de doctorat
Spécialité: génie civil
Behrouz ESMAEILKHANIAN
Jury: Kamal H. KHAYAT (directeur)
Olafur H. WALLEVIK (consultant)
Ammar YAHIA
Richard GAGNÉ
i
RÉSUMÉ
Même si le béton est un matériau relativement vert, le volume astronomique de béton produit à travers le monde chaque année met le secteur de la construction en béton parmi les contributeurs important au réchauffement climatique. Le constituant le plus polluant du béton est le ciment en raison de son processus de production qui dégage, en moyenne, 0,83 kg de CO2 par kg de ciment.
Le béton autoplaçant (BAP), un type de béton qui peut remplir le coffrage sans vibration externe, est une technologie qui peut offrir une solution aux problèmes de développement durable de l'industrie du béton. Cependant, toutes les exigences de la maniabilité du BAP proviennent d'une teneur en poudre plus élevé (par rapport au béton conventionnel), ce qui peut augmenter le coût de la construction et de l'impact environnemental du BAP pour certaines applications. Le BAP écologique, Éco-BAP, est un développement récent combinant les avantages du BAP tout en ayant une teneur en poudre significativement plus faible. La teneur en poudre maximale de ce béton, destinée à la construction du bâtiment et aux applications commerciales, est limitée à 315 kg/m3. Néanmoins, la conception de l’Éco-BAP peut être difficile, car un équilibre délicat entre
les différents ingrédients de ce béton est nécessaire pour garantir un mélange satisfaisant. Dans ce programme de doctorat, l'objectif principal est de développer une méthode systématique pour la formulation de l’Éco-BAP. Puisque l'effet de groupe des particules (EGP) est un paramètre clé pour la conception des mélanges l’Éco-BAP stables, et que ce phénomène est peu connu, dans la première phase de cette recherche, l’EGP est étudié. Cette partie se concentre sur l'influence de la granulométrie sur l’EGP et la stabilité des mélanges de modèle ainsi que des BAPs. Dans la deuxième phase, le protocole de formulation est développé, et les propriétés des mélanges obtenus, à l’état frais ainsi que l’état durcis, sont évaluées. Étant donné que l'évaluation de la robustesse est cruciale pour la production du béton à grande échelle, dans la dernière phase de ce travail, la robustesse d'un des mélanges les plus performants de la Phase II est examinée.
Basé sur les résultats obtenus, nous constatons que l'augmentation de la fraction volumique d'une classe mène à une meilleure stabilité de cette classe. Cela contribue également à une EGP supérieure du squelette granulaire et à une stabilité plus élevée du système. Il a été montré qu'une granulométrie continue dans lequel la fraction volumique de chaque classe est plus grande que la classe consécutive plus grossière peut augmenter l’EGP. En utilisant une telle granulométrie, la fluidité d’un mélange du BAP pourrait être augmentée sans compromettre la résistance à la ségrégation. Un indice de prédiction du potentiel de la ségrégation de particules suspendues dans un fluide à seuil a été proposé. Dans la deuxième phase de la thèse, une méthode de conception en cinq étapes pour l’Éco-BAP a été développée. Le protocole de formulation commence par la détermination des teneurs en poudre et de l'eau, suivie par l'optimisation des fractions volumiques du sable et des gros granulats selon un modèle idéal de granulométrie (Funk et Dinger). La composition de poudre est optimisée dans la troisième étape afin de minimiser la demande en eau tout en garantissant une performance adéquate à l'état durci. Le dosage du superplastifiant (SP) est déterminé dans l’étape suivante. La dernière étape s’agit d’évaluer le potentiel du réchauffement climatique des mélanges développés. Les mélanges de l’Éco-BAP optimisés répondent à toutes les exigences à l'état frais pour le BAP. La résistance à la compression à 28 jours de ces mélanges est dans la fourchette cible de 25 à 35 MPa. En outre, les mélanges montrent des performances suffisantes en termes de retrait de séchage, la résistivité électrique, et la résistance contre gel-dégel pour les applications visées. La performance écologique des Éco-BAPs produis a été satisfaisante. Il a été démontré dans la dernière phase que la robustesse de l'Éco-BAP est généralement bonne en ce qui concerne les variations de
ii
Mots-clés: Béton autoplaçant écologique; Effet de groupe des particules; Formulation;
iii
ABSTRACT
Although concrete is a relatively green material, the astronomical volume of concrete produced worldwide annually places the concrete construction sector among the noticeable contributors to the global warming. The most polluting constituent of concrete is cement due to its production process which releases, on average, 0.83 kg CO2 per kg of cement. Self-consolidating concrete
(SCC), a type of concrete that can fill in the formwork without external vibration, is a technology that can offer a solution to the sustainability issues of concrete industry. However, all of the workability requirements of SCC originate from a higher powder content (compared to conventional concrete) which can increase both the cost of construction and the environmental impact of SCC for some applications. Ecological SCC, Eco-SCC, is a recent development combing the advantages of SCC and a significantly lower powder content. The maximum powder content of this concrete, intended for building and commercial construction, is limited to 315 kg/m3. Nevertheless, designing Eco-SCC can be challenging since a delicate balance
between different ingredients of this concrete is required to secure a satisfactory mixture. In this Ph.D. program, the principal objective is to develop a systematic design method to produce Eco-SCC. Since the particle lattice effect (PLE) is a key parameter to design stable Eco-SCC mixtures and is not well understood, in the first phase of this research, this phenomenon is studied. The focus in this phase is on the effect of particle-size distribution (PSD) on the PLE and stability of model mixtures as well as SCC. In the second phase, the design protocol is developed, and the properties of obtained Eco-SCC mixtures in both fresh and hardened states are evaluated. Since the assessment of robustness is crucial for successful production of concrete on large-scale, in the final phase of this work, the robustness of one the best-performing mixtures of Phase II is examined.
It was found that increasing the volume fraction of a stable size-class results in an increase in the stability of that class, which in turn contributes to a higher PLE of the granular skeleton and better stability of the system. It was shown that a continuous PSD in which the volume fraction of each size class is larger than the consecutive coarser class can increase the PLE. Using such PSD was shown to allow for a substantial increase in the fluidity of SCC mixture without compromising the segregation resistance. An index to predict the segregation potential of a suspension of particles in a yield stress fluid was proposed. In the second phase of the dissertation, a five-step design method for Eco-SCC was established. The design protocol started with the determination of powder and water contents followed by the optimization of sand and coarse aggregate volume fractions according to an ideal PSD model (Funk and Dinger). The powder composition was optimized in the third step to minimize the water demand while securing adequate performance in the hardened state. The superplasticizer (SP) content of the mixtures was determined in next step. The last step dealt with the assessment of the global warming potential of the formulated Eco-SCC mixtures. The optimized Eco-SCC mixtures met all the requirements of self-consolidation in the fresh state. The 28-day compressive strength of such mixtures complied with the target range of 25 to 35 MPa. In addition, the mixtures showed sufficient performance in terms of drying shrinkage, electrical resistivity, and frost durability for the intended applications. The eco-performance of the developed mixtures was satisfactory as well. It was demonstrated in the last phase that the robustness of Eco-SCC is generally good with regards to water content variations and coarse aggregate characteristics alterations. Special attention must be paid to the dosage of SP during batching.
v
ACKNOWLEDGEMENTS
This Ph.D. program was undertaken under the supervision of a team of highly knowledgeable and considerate scientists without the continuous assistance of whom such project would never be the same as it is now. Hence, I hereby gratefully appreciate the entire technical, intellectual, and financial support that I received from my principal supervisor, Professor Kamal H. Khayat. I also appreciate all the aid and support that I was given by Dr. Olafur H. Wallevik as my technical advisor. I should also especially thank Dr. Wallevik and his team in ICI Rheocenter for their incredible hospitality and care which made my visit to Iceland even more magnificent. My special thanks and appreciation goes to Dr. Ammar Yahia for years of help and support and collaboration in every aspect during my PhD even though he had no obligation to do so. Most importantly, he provided financial and technical help for the first phase of this work (Chapter 4) among other things. He is not just a professor or a colleague, but also my good friend.
I would like to thank Dr. Paco Diederich and Dr. Dimitri Feys, both as my friends and collaborators who each helped me with technical aid and sometimes physical work during the different stages of this Ph.D.
My specific gratitude goes to all of my friends, colleagues, and professors in the concrete group, particularly: Masoud Hosseinpoor, Daddy Kabagaire, Olivier Bonneau, Jorge Maurilio Rivera Torres, Marika Faucher-Roy, Karim, David Harbec, the technicians of the concrete laboratory: Johan Gass, Sylvain Roy, Claude Faucher, Rajko Vojnovic, and Josée Bilodeau. I also thank the staff of the Université de Sherbrooke who have assisted me a lot during my program. I cannot appreciate enough the continuous support and infinite patience of my much-loved girlfriend, Ana, who has been a constant source of energy and motivation for me during this journey. Thank you very much honey.
Last but not least, my deepest sentiments of appreciation and love flies to my beloved mother who is my main supporter and source of inspiration and whose love and help in every single field of my life was the primary reason I could be here and start this Ph.D. in the first place. I also thank gratefully my dear father for his intellectual and financial support and my two brothers for their encouragements and collaborations.
vii
TABLE OF CONTENTS
CHAPTER 1 INTRODUCTION ... 1
1.1 Definition and objective of research ... 4
1.2 Originality ... 4
1.3 Outline of document ... 5
CHAPTER 2 BACKGROUND ... 7
2.1 Environmental impact of concrete ... 7
2.2 Reduction of CO2 emissions per unit volume of concrete ... 8
2.2.1 Optimization curves ... 10
2.2.2 Particle packing models ... 11
2.3 Design methods for eco-friendly SCC ... 13
2.3.1 Mix design method proposed by [Hunger, 2010] for lean SCC ... 14
2.3.2 Mix design method developed by [Fennis, 2010] for Eco-concrete ... 17
2.3.3 Eco-SCC design criteria according to [Mueller, 2012] ... 22
2.4 Performance of Eco-efficient concrete ... 24
2.4.1 Properties in fresh state ... 24
2.4.2 Hardened state properties ... 26
2.5 Particle lattice effect ... 32
2.6 Robustness ... 36
2.6.1 Definition and assessment of robustness ... 36
2.6.2 Parameters affecting robustness ... 39
2.6.3 Robustness of Eco-SCC ... 42
2.7 Needed research ... 43
CHAPTER 3 EXPERIMENTAL PROGRAM ... 47
3.1 Study of the PLE ... 48
3.1.1 Phase I-A: stability of model materials (homogeneous approach) ... 48
3.1.2 Phase I-B: stability of model materials (heterogeneous approach) ... 50
3.1.3 Phase I-C: stability of SCC ... 50
3.2 Development of a systematic method to achieve Eco-SCC mixtures... 52
3.2.1 Materials ... 53
3.2.2 Testing program ... 54
3.3.1 Materials ... 56
3.3.2 Experimental procedure ... 57
CHAPTER 4 INFLUENCE OF PARTICLE LATTICE EFFECT ON STABILITY OF SUSPENSIONS: APPLICATION TO SELF-CONSOLIDATING CONCRETE ... 61
Avant-propos ... 61 4.1 Abstract ... 63 4.2 Introduction ... 63 4.3 Methodology ... 66 4.4 Experimental program ... 67 4.4.1 Model materials ... 67
4.4.2 SCC mixtures and corresponding mortars ... 70
4.4.3 Rheological measurements ... 72
4.5 Results ... 74
4.5.1 Homogeneous suspending fluids ... 74
4.5.2 Heterogeneous suspending fluids ... 78
4.5.3 Influence of coarse aggregate PSD on stability and PLE of SCC ... 80
4.6 Discussions ... 82
4.6.1 Characterization of the PLE potential of a PSD ... 82
4.6.2 Segregation Criterion ... 84
4.6.3 Other factors influencing the settlement of aggregate in SCC ... 86
4.7 Conclusions ... 87
CHAPTER 5 MIX DESIGN APPROACH FOR LOW-POWDER SELF-CONSOLIDATING CONCRETE: ECO-SCC – CONTENT OPTIMIZATION AND PERFORMANCE ... 89
Avant-propos ... 89
5.1 Abstract ... 91
5.2 Introduction ... 91
5.2.1 Background ... 91
5.2.2 Design of Eco-SCC: challenges ... 94
5.3 Experimental program ... 96
5.3.1 Materials ... 96
5.3.2 Testing procedure ... 97
5.4 Proposed design method ... 98
5.4.1 Powder and water contents ... 98
TABLE OF CONTENTS ix
5.4.3 Volumetric proportions of powder materials ... 101
5.4.4 Chemical admixtures ... 102
5.4.5 Global warming potential assessment ... 104
5.5 Results and discussion ... 104
5.5.1 Proportioned Eco-SCC mixtures ... 104
5.5.2 Fresh properties of optimized Eco-SCC mixtures ... 111
5.5.3 Rheology of Eco-SCC mixtures ... 113
5.5.4 Compressive Strength ... 114
5.5.5 Drying shrinkage ... 114
5.5.6 Durability ... 117
5.5.7 Eco-Efficiency ... 118
5.6 Conclusions ... 121
CHAPTER 6 ROBUSTNESS OF ECO-SCC ... 123
6.1 Effect of water variation ... 125
6.1.1 Fresh state ... 125
6.1.2 Properties in hardened state... 135
6.2 Influence of SP fluctuation ... 136
6.2.1 Properties in fresh state ... 137
6.2.2 Hardened state performance ... 146
6.3 Effect of coarse aggregate properties ... 147
6.3.1 Fresh state properties ... 147
6.3.2 Properties in hardened state... 150
6.4 Robustness area of studied Eco-SCC mixture ... 151
6.5 Concluding remarks ... 151
CHAPTER 7 CONCLUSIONS AND FUTURE WORK ... 153
7.1 Conclusions ... 153
7.2 Future research ... 156
7.3 Conclusions (français) ... 157
APPENDIX A SUPPLEMENTS TO CHAPTER 4 ... 161
A.1 Discussions ... 161
A.2 Stability-based mix design approach ... 165
APPENDIX B GUIDELINES FOR DESIGN OF ECO-SCC (DELIVERABLES) ... 167
xi
LIST OF FIGURES
Figure 3-1 Overview of different phases of the Ph.D. study ... 47
Figure 3-2 Testing procedure for Phase I-A ... 49
Figure 3-3 Configuration of segregation box ... 50
Figure 3-4 General procedure followed for Phase I-B ... 51
Figure 3-5 Main steps in Eco-SCC mix design procedure ... 52
Figure 3-6 Gravel (left) and CA2 (right) particle shapes and textures ... 57
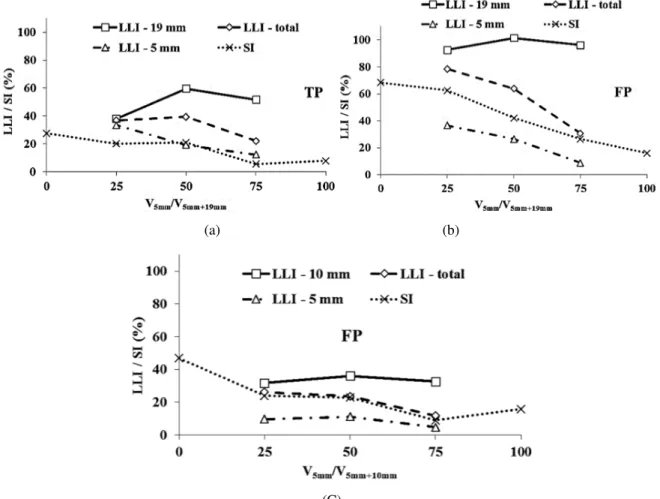
Figure 4-1 Influence of volume ratio between particle classes on SI and LLI of binary granular skeletons (a) non-consecutive classes in TP and (b) non-consecutive classes in FP, and (c) consecutive classes in FP ... 75
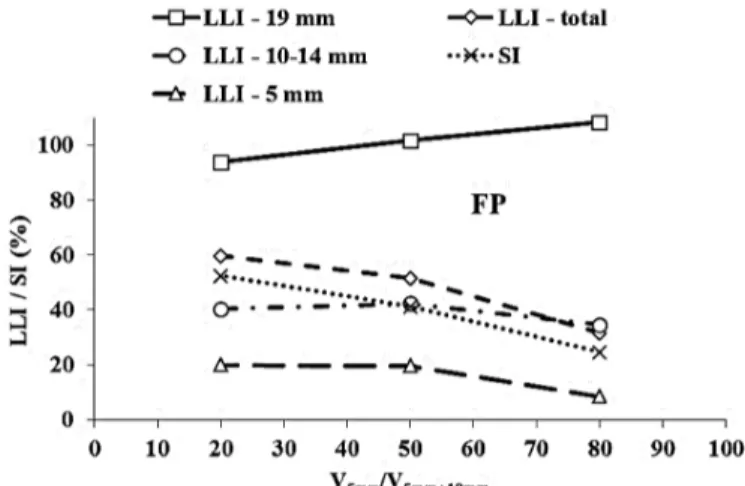
Figure 4-2 Effect of volume ratio between 5 and 19 mm particle classes on SI and LLI of polydisperse granular skeletons (middle class volume constant) in FP ... 76
Figure 4-3 Effect of variation of middle class volume on SI and LLI of polydisperse granular skeletons in FP ... 77
Figure 4-4 Influence of coarse particle volume fraction on SI and LLI ... 78
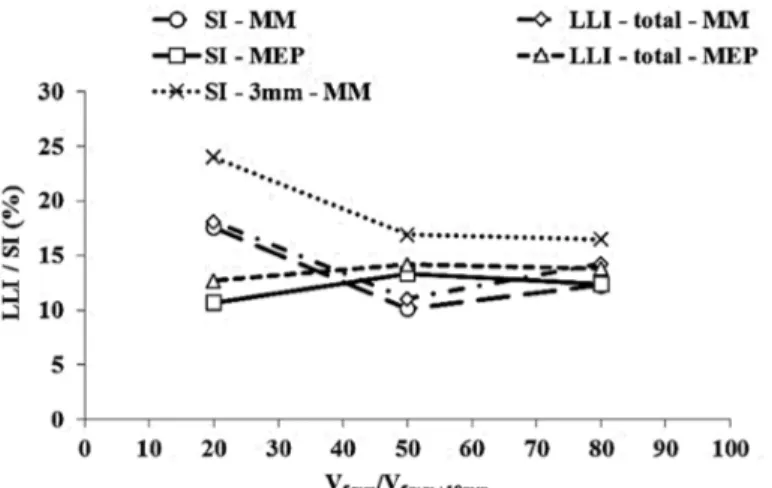
Figure 4-5 Influence of volume ratio between 5 and 19 mm particle classes on SI and LLI of polydisperse granular skeletons suspended in the MM (middle class volume constant) ... 79
Figure 4-6 Comparison between the LLI and SI of similar granular skeletons suspended in the MM and in the MEP ... 80
Figure 4-7 Effect of the variations of PSD on the SI and LLI of SCC mixtures ... 81
Figure 4-8 Relationship between the lattice factor and the LLI ... 83
Figure 4-9 A global parameter controlling the stability of suspensions of particles ... 86
Figure 5-1 Particle size distribution of solid materials ... 96
Figure 5-2 General procedure to determine the powder composition of Eco-SCC... 103
Figure 5-3 Summary of the proposed mix design procedure for Eco-SCC... 105
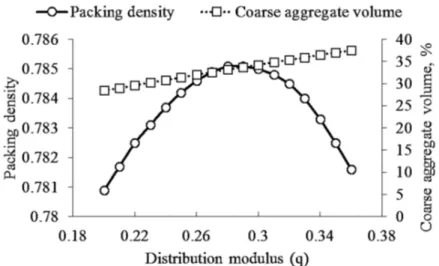
Figure 5-4 Relationship between packing density, coarse aggregate volume, and distribution modulus (q) ... 107
Figure 5-5 Effect of cement replacement by SCMs and fillers on the rheological properties of pastes ... 107
Figure 5-6 Flow time as a function of SP content for pastes to determine saturation point.... 109
Figure 5-7 Global warming potential of investigated Eco-SCC mixtures ... 109
Figure 5-8 SP demand for different mixtures ... 112
Figure 5-9 Rheograph comparing rheological properties of the studied Eco-SCC mixtures to different proposed rheological limits ... 114
Figure 5-10 Powder efficiency analysis of studied Eco-SCC mixtures ... 120
Figure 5-11 CO2 intensity indicator of studied Eco-SCC mixtures ... 120
Figure 6-1 Effect of water content variation on slump flow and SP demand of Eco-SCC ... 126
Figure 6-2 Relative variation of SP demand with water content ... 127
Figure 6-3 Influence of water alterations on passing ability of Eco-SCC (J-Ring test) ... 127
Figure 6-4 Relative variation of slump flow - J-Ring with water content ... 128
Figure 6-5 Variations of V-funnel flow time with fluctuations of water content of Eco-SCC ... 129
Figure 6-7 Effect of water content variability of Eco-SCC on (a) Sieve stability index, (b)
T-Box PDI ... 130
Figure 6-8 Relative variations of stability of Eco-SCC with water content for (a) sieve stability and (b) T-Box tests ... 132
Figure 6-9 Variations in (a) yield stress, (b) plastic viscosity of Eco-SCC with alterations in water content ... 133
Figure 6-10 Relative variability of (a) yield stress and (b) plastic viscosity with fluctuations of water content ... 134
Figure 6-11 Influence of water content changes on the compressive strength of Eco-SCC ... 135
Figure 6-12 Comparison of drying shrinkage strains for Eco-SCC mixtures with varied water contents ... 136
Figure 6-13 Variation in electrical resistivity of Eco-SCC with fluctuations in water content ... 137
Figure 6-14 Influence of SP content variations on the slump flow of Eco-SCC ... 138
Figure 6-15 Relative variations of slump flow of Eco-SCC with SP dosage fluctuation ... 138
Figure 6-16 Effect of SP alterations of Eco-SCC on the J-Ring test ... 139
Figure 6-17 Relative variation of slump flow - J-Ring of Eco-SCC with SP dosage ... 140
Figure 6-18 Variation of V-funnel flow time of Eco-SCC mixtures with changes in SP dosage ... 140
Figure 6-19 Relative changes in the V-funnel flow time of the studied Eco-SCC mixture with SP content variation ... 141
Figure 6-20 Influence of SP dosage variations on (a) sieve stability index, and (b) T-Box PDI for Eco-SCC ... 142
Figure 6-21 Relative alteration of a) sieve stability and b) T-Box tests with variation of SP content for Eco-SCC ... 143
Figure 6-22 Effect of SP content variations on (a) yield stress, and (b) plastic viscosity of Eco-SCC ... 144
Figure 6-23 Relative variations of a) yield stress and b) viscosity of the reference Eco-SCC mixture with SP fluctuation ... 145
Figure 6-24 Effect of SP variations on the compressive strength of Eco-SCC ... 146
Figure 6-25 Influence of SP dosage alterations on the electrical resistivity of Eco-SCC ... 146
Figure 6-26 Robustness area for the studied Eco-SCC mixtures ... 151
Figure A-1 Monodisperse marbles sedimentation ... 161
Figure A-2 Influence of coarse particle volume fraction on segregation (monodisperse case) ... 162
Figure A-3 Effect of fine marbles volume fraction on the stability of coarse marbles ... 162
Figure A-4 Comparison between the effects of suspending fluid rheology and PSD on (a) PLE and (b) segregation of binary granular skeletons... 163
Figure A-5 Effect of particle packing density on (a) PLE and (b) segregation of granular mixtures ... 164
xiii
LIST OF TABLES
Table 1-1 SCC classification in terms of powder content (ICI Rheocenter) [Wallevik et al., 2014]
... 2
Table 2-1 General mix design elements of the mixtures considered for robustness study by [Mueller et al., 2016] ... 43
Table 3-1 Particle combinations used in the PLE study of model suspensions ... 49
Table 3-2 Coarse aggregate PSD used in the study of PLE on SCC ... 52
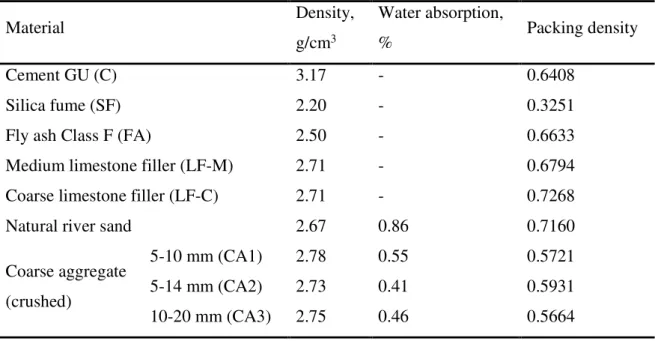
Table 3-3 Properties of materials used in Phases II and III ... 53
Table 3-4 Pastes studied for powder composition optimization... 54
Table 3-5 Testing plan for Eco-SCC mixtures studied in Phase II ... 55
Table 3-6 Variations applied to the reference mixture studied for robustness ... 56
Table 4-1 Properties of suspending fluids ... 68
Table 4-2 Material proportions and fresh properties of studied SCC mixtures... 72
Table 5-1 Mixture proportions of investigated Eco-SCC mixtures along with environmental impact of each component ... 110
Table 5-2 Fresh properties of the investigated mixtures ... 111
Table 5-3 Compressive strength and electrical resistivity of investigated mixtures at various ages ... 115
Table 5-4 Drying shrinkage of Eco-SCC mixtures ... 117
Table 6-1 Eco-SCC mixture proportions studied for robustness ... 124
Table 6-2 Fresh properties of Eco-SCC mixtures with varied coarse aggregate characteristics ... 148
Table 6-3 Relative changes in the fresh properties of the Eco-SCC mixtures with varied coarse aggregate characteristics ... 149 Table 6-4 Hardened properties of Eco-SCC mixtures with altered aggregate characteristics 150
1
CHAPTER 1
INTRODUCTION
Although concrete is a green material, its substantial worldwide production still places concrete industry among the important contributors to global warming through CO2 emissions. The
release of CO2 during cement clinker production is an environmental issue associated with the
material concrete [Damineli et al., 2010; Flatt et al., 2012; Malhotra, 2002, 2006; Mehta, 2002; Proske et al., 2013; Yang et al., 2013]. Even in the modern day cement plants that employ alternative fuels and optimized calcination processes, the production of 1 ton of cement emits between 0.66 to 0.82 ton of CO2 into the atmosphere [Turner and Collins, 2013]. Thus, designing
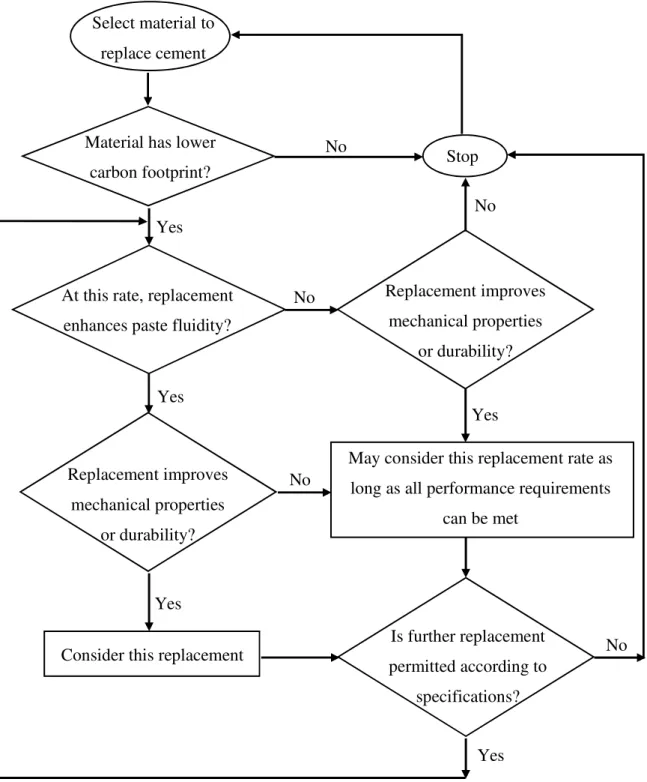
concretes with lower environmental impact has become an important mission for the industry in the recent decades. There are two general approaches to produce such type of so-called ‘Ecological (Eco) concrete’ [Habert and Roussel, 2009]. The first approach is based on increasing the powder content (cementitious materials + filler finer than 125 µm) per unit volume of concrete to improve mechanical properties and durability of concrete. In this manner, the total volume of needed concrete can be reduced (smaller sections are required), and the service life can be extended, both of which can contribute to reduce the total CO2 emissions.
The second strategy involves reducing the use of cementitious materials while keeping the same level of performance for the mixture. This is usually achieved by replacing cement (as the most pollutant ingredient of concrete in terms of CO2 emissions) with supplementary cementitious
materials (SCM), such as fly ash (FA) or silica fume (SF). It can also be done by decreasing the total amount of powder materials in a unit volume of concrete mixture by means of an optimized particle packing density. The choice of which method to employ depends mostly on the type of element and application. These two approaches may be combined as well.
Self-Consolidating Concrete (SCC) is a type of concrete that can flow and fill the formwork under its own weight and without external vibration and with no excessive segregation. Producing SCC normally requires higher powder content (cement content) and lower water-to-powder ratio (w/p), compared to conventional concrete, to achieve the self-consolidating features [Khayat, 1999]. This high powder content and low w/p results in relatively high compressive strength and durability aspects that are not always necessary for normal commercial and residential applications. In this respect, the detrimental ecological impacts associated with SCC is even more critical not to mention the undesirable increased unit
production cost. Thus, the use of SCC in the aforementioned applications is less advantageous in terms of sustainability due to environmental and economic issues [Figueiras et al., 2009]. In this regard, an Ecological SCC (Eco-SCC) with a low powder content could be of great interest since it embodies the advantages of both self-consolidation and ecology while reducing the cost of materials [Mueller et al., 2014].
In the literature, the term Eco-SCC is not well defined and is globally used to address SCCs with reduced cement content. Generally, in such research works there is no limits on the amount of powder materials. The approach adopted in the present Ph.D. work is based on the classification of SCC mixtures with respect to powder content according to the ICI Rheocenter [Wallevik et al., 2014] as presented in Table 1-1. Thus, Eco-SCC in this research refers to a type of SCC with total powder content lower than 315 kg/m3 and 28-day compressive strength within
the range of 25 to 35 MPa. Eco-SCC is designed to be used in ready-mix applications where normal durability characteristics suffice, such as residential and commercial construction. This concept was proposed for the first time by [Wallevik et al., 2009], and the pilot project was carried out by [Mueller, 2012].
Table 1-1 SCC classification in terms of powder content (ICI Rheocenter) [Wallevik et al., 2014]
SCC type Powder content
Rich SCC 575 kg/m3
Regular powder content SCC 515 ± 40 kg/m3
Lean SCC 425 ± 40 kg/m3
Green SCC 355 ± 40 kg/m3
Eco-SCC ≤ 315 kg/m3
EcoCrete-SCC ≤ 260 kg/m3
EcoCrete-Xtreme ≤ 220 kg/m3
The main strategy to produce Eco-SCC is to minimize the powder content by particle size optimization and to reduce the use of cement by SCMs / fillers replacement. This strategy not only results in lower emissions per unit volume, but also promotes the reuse of industrial co-products (sustainable materials). Many of the residual co-products from industries, such as SF, FA or ground granulated blast-furnace slag (GGBS), have characteristics that can positively influence concrete properties [Kraus et al., 2009; Lachemi et al., 2003]. Similarly, limestone
1.1 Definition and objective of research 3
filler (LF) is shown to have the capacity to replace cement up to a certain limit (usually between 10 to 15% of the mass of cement) and enhance the fresh properties without significant influence on the performance in hardened state [Ghezal and Khayat, 2002; Ye et al., 2007]. Nonetheless, designing complex concrete mixtures, such as Eco-SCC, and ascertaining that these mixtures exhibit appropriate material properties and satisfy the requirements demands a large number of experiments if traditional design methods are employed. This is mostly due to the delicate balance that should exist between the contents of different constituents of modern concrete mixtures if such concrete is to exhibit satisfactory performance. This process can be accelerated if a performance‐based design procedure capable of taking into consideration the properties of constituent materials is used. Such method of design should be devised to ensure concrete mixtures with satisfactory fresh properties as well as required hardened performance. A general mixture optimization method developed in this manner is a significant contribution to the wider application of Eco-concrete and specially Eco-SCC [Mueller, 2012].
Any SCC mix design must meet three important criteria in the fresh state: flowability, passing ability, and segregation resistance or stability [Khayat, 1999]. Obtaining the last one in the case of Eco-SCC is challenging due to the high fluidity (low yield stress and plastic viscosity) of the paste mainly originating from the high w/p of Eco-SCC. The w/p of Eco-SCC is intrinsically high since the powder content is low, and in order to obtain the minimum matrix volume necessary to attain self-consolidation, it is unavoidable to increase the water content. Note that the water demand may be reduced by means of air-entrainment, but this results in low plastic viscosity of the matrix.
Thus, the stability of the mixture needs to be mainly provided by the granular skeleton, i.e. sand and coarse aggregate particles. An important phenomenon affecting the stability level of a granular skeleton is the particle lattice effect (PLE). PLE means that the settlement of a single particle in a given fluid is different from that of a group of particles (two or more particles) [Bethmont, 2005; Bethmont et al., 2009]. The PLE is controlled by the particle-size distribution (PSD) and rheological properties of the suspending medium. However, PLE is not a well-investigated parameter in the literature since few researchers carried out detailed studies on how this phenomenon actually takes place in a concrete mixture and enhances stability. Knowing that PLE is suggested to be the key parameter in assuring the stability of Eco-SCC [Wallevik et al., 2009], the importance of this phenomenon to maximize stability of the granular skeleton in
Eco-SCC is therefore investigated in this thesis. It should be borne in mind that stabilizing admixtures or viscosity modifying agents (VMA) can increase, to some extent, the stability of SCC mixtures (including Eco-SCC) by increasing the plastic viscosity of the mixture [Khayat, 1998]. However, in case of Eco-SCC, the stability design of the mixture should not solely rely on the use of such admixtures.
1.1 Definition and objective of research
In the current research work, an attempt is made to achieve Eco-SCC mixtures, as defined in Table 1-1, with minimal trial and error experiments, i.e. a systematic design procedure taking into account the properties of available material. The approach adopted here is to produce Eco-SCC with low CO2 footprints via reduction of the cement and total powder contents relative to
ordinary SCC. The specific objectives of this work are as follows:
- Phase I: an extensive experimental program is undertaken to understand the underlying principles of PLE. More specifically, the objective of this part is to determine the effect of PSD on PLE and segregation of suspensions. The studied suspensions include model materials (glass beads mixed with limestone paste) as well as SCC mixtures.
- Phase II: this step involves the development of a global mix design procedure to produce Eco-SCC. An important parameter to determine here is the PSD of sand and coarse aggregate. This choice is partially based on the results obtained from the first stage (PLE study). Once the design method is established, various properties of the developed Eco-SCC mixtures, such as fresh properties, mechanical characteristics, and durability aspects of optimized Eco-SCC mixtures are examined
- Phase III: the last part of the study deals with the robustness of the Eco-SCC mixtures produced with the proposed protocol. This phase is particularly essential for the production of Eco-SCC in ready-mix plants.
1.2 Originality
As discussed earlier, Eco-SCC can be made with a powder content as low as normal vibrated concrete. However, no systematic mix design procedure is proposed to achieve this type of concrete. Hence, in this investigation, it is strived to find a systematic and global method to
1.3 Outline of document 5
design Eco-SCC. Although the method developed in this dissertation is generally adopted from the literature, there are some novel features that are proposed here. The applicability of the proposed protocol to design Eco-SCC is examined for the first time. It must be noted that the developed protocol is useful for the design of normal SCC as well.
Apart from the design method, as the particle lattice effect is a key factor for proper design of Eco-SCC, a comprehensive study on the effect of this phenomenon on stability of suspensions is undertaken which may contribute to a more successful design of ordinary SCC as well. The results of this part provide an extensive insight into the mechanism of PLE phenomenon. Consequently, the influencing parameters are determined which can be used to maximize the stability of the SCC mixtures. Based on the outcome of this research, two new indices are proposed. The first one allows to compare the lattice effect potential of different PSDs to be used in a given suspending medium. The second index deals with the prediction of the final state of segregation of a suspension of particles in a fluid as a function of both particles and the suspending fluid properties. Both indices are powerful tools to design novel Eco-SCC materials (or SCC in general) with adequate stability.
1.3 Outline of document
This dissertation is comprised of eight chapters, as explained in brief subsequently. The introduction places the subject of the Ph.D. project in context by stating the need for this research based on the shortcomings of the literature. The definition and objectives of the research program as well as the original contributions are presented in this chapter. Chapter 2 provides an overview of the pertaining literature with regards to different subjects addressed in this work. Results of the work from various researchers are compared and analyzed, and the shortcomings are highlighted.
The next chapter focus on the experimental program and the methodology employed in this dissertation for each of the three aforementioned phases. Chapters 4, 5, and 6 present the results and analysis obtained from the experimental program. Chapters 4 and 5 are in paper format while Chapter 6 is presented in a conventional manner. Appendix A provides some further discussions about Chapter 4 that could not be included in that chapter (paper) due to space limits of the journal. Chapter 7 deals with the conclusions drawn from this Ph.D. research project along
with some recommendations for future works. The final chapter provides general guidelines for increasing the stability of SCC, in general, through a better use of PLE and for the design of Eco-SCC.
7
CHAPTER 2
BACKGROUND
This chapter depicts the state of literature with respect to the subject of the research work, i.e. development of Eco-SCC. First, a discussion about the environmental impact of concrete and the strategies to reduce such impact is presented. The focus of this part is on equivalent CO2
emissions (e-CO2), and how such emissions can be reduced by means of mix design
optimization (Sections 2.1 and 2.2). Afterwards, the mix design procedures proposed by different researchers to produce Eco-concrete, lean or green SCC, and Eco-SCC are described and compared (Section 2.3). The fresh and hardened properties of the resulting concrete mixtures are stated as well (Section 2.4). These methods lay the foundation for the design method developed in the current work. Chapter 2 is continued with an overview of the PLE phenomenon and its influence on the stability of suspensions (Section 2.5). The final part of the literature review concentrates on the robustness of concrete, especially SCC (Section 2.6). The chapter is concluded with an analysis of the shortcomings of the literature and the derivation of research needs for this Ph.D. project (Section 2.7).
2.1 Environmental impact of concrete
Concrete is an overall eco-friendly material. Apart from ordinary portland cement (OPC) and chemical admixtures, all other ingredients of concrete have very low environmental impact. The issue arises from the sheer global production of concrete making this industry an important contributor to the global warming. The CO2 emissions from this sector corresponds to around
7% of the annual global emissions [Flatt et al., 2012; Purnell and Black, 2012; Turner and Collins, 2013; Yang et al., 2013].
Cement manufacturing is responsible for the majority of CO2 footprint of the concrete industry
[Malhotra, 2002]. The production of 1 kg of OPC clinker can release 0.83 kg of CO2 on average
[“The cement sustainability initiative (CSI). Cement industry energy and CO2 performance:
getting the numbers right”, 2013; Turner and Collins, 2013]. Considering the fact that well above two billion tons of OPC is produced worldwide annually [Aïtcin, 2000; Damtoft et al., 2008], such emissions become quite significant. Over the recent decades various strategies have been adopted by the cement industry to mitigate the global warming potential (GWP) of OPC
[Mehta, 2002]. Such endeavors include, for instance, the use of alternative fuels during the calcination process and replacement of OPC clinker with SCM and / or fillers to produce blended binders [Damtoft et al., 2008; Flatt et al., 2012; Malhotra, 2002; Mehta, 2002]. These measures resulted in a decrease in the environmental impact of OPC and therefore concrete. Other methods of reducing the CO2 emissions of concrete is by optimization of the mix design
which is of more interest to the present study [Kim et al., 2013].
There are two general approaches to reduce the total CO2 emissions of concrete with regards to
mix design [Habert and Roussel, 2009]. One strategy involves decreasing the use of OPC by minimizing the total powder content and substituting clinker by SCM and / or filler while maintaining the same class of performance [Bilodeau and Malhotra, 2000; Proske et al., 2013]. The other method consists of increasing the amount of cementitious materials (CM), including OPC, per unit volume, in order to improve the mechanical performance and service life of the concrete and thus reduce the total volume of concrete required to construct a certain structure [Aïtcin, 2000; Damtoft et al., 2008; Habert and Roussel, 2009]. In some applications, the combination of both strategies may be employed. Design of Eco-SCC is based on the first approach, and therefore this point of view is elaborated subsequently.
2.2 Reduction of CO
2emissions per unit volume of concrete
Substituting OPC with fine alternative materials is a common method to attain Eco-concretes [Damtoft et al., 2008; Flatt et al., 2012]. Replacing OPC can be implemented by either mixing (or co-grinding) the cement clinker with alternative powder materials in the factory or by replacing some of the OPC with other powder materials such as GGBS, FA, SF, and LF powder in the fresh concrete mixture [Long et al., 2015; Rosković and Bjegović, 2005]. Nevertheless, the volumes of fines which can be added to concrete are limited by the design codes. These limitations are to control the side effects of clinker substitution, such as increased setting time or reduced compressive strength [Damtoft et al., 2008; Felekoğlu, 2008].
The second method is adopted for this dissertation since it allows for a more flexible choice of powder composition based on optimization results. Cement-replacing powder materials can be divided into two categories: SCMs and fillers. An SCM can be defined as reactive particles that actively produce a binding structure between the aggregate and the inert particles. In addition to
2.2 Reduction of CO2 emissions per unit volume of concrete 9 the binding ability, such particles can improve the properties of the concrete by increasing the packing density of the mixture and decreasing the water demand, if used properly (filler effect). The SCMs fall into three groups: hydraulic binders, latent hydraulic materials, and pozzolanic materials. Depending on the type of binder used, a concrete mixture can develop a quite different microstructure resulting in a considerably variable fresh and hardened behavior compared to an OPC [Damtoft et al., 2008; Flatt et al., 2012; Mohammed et al., 2013].
Fillers can be defined as inert fine particles which do not actively form cement gel. Even though such materials do not directly participate in the hydration process, they help improving the formation and orientation of cement gel crystals by providing nucleation sites where cement gel can settle. As a result, a better bonding structure between cement gel and aggregates is attained, and the cement matrix around the aggregates in the interface zone becomes denser [Moosberg-Bustnes et al., 2004]. Fillers can enhance the particle packing density of the powder composition as well resulting in a lower water demand or an improved workability [Mňahončáková et al., 2008; Moosberg-Bustnes et al., 2004; Poppe and De Schutter, 2005; Topçu and Uğurlu, 2003; Uysal et al., 2012; Ye et al., 2007]. In addition to the reduction of OPC employment in a concrete mixture by replacement, it is beneficial to minimize the total powder content (all particles smaller than 125 µm excluding fines from sand) of mixtures to further decrease the amount of OPC and thus CO2 emissions.
Optimizing the granular skeleton so that the volume of voids is minimized leads to a lower amount of paste needed to fill in such voids resulting in a lower powder demand in the concrete mixture (while keeping w/p constant). In this way, the concrete can still attain sufficient strength [Damtoft et al., 2008; Flatt et al., 2012; Proske et al., 2014]. Hence, this method is utterly useful for designing Eco-concretes. The two most common techniques to optimize PSD are as follows: 1. Optimization curves: different particle size-classes are combined in a manner that the overall PSD shows the least deviation from a target optimized PSD curve (see 2.2.1).
2. Particle packing models: these are analytical models that calculate the total packing density of a mixture based on the geometry of the combined particle classes. Here, the total PSD of the particles is optimized to reach the highest packing density (see 2.2.2).
2.2.1 Optimization curves
The general form of the parabolic grading, called parabolic or power-law gradings, is given in Eq. 2.1:
P d = d dmax
q
q ≠ 0 (2.1)
In Eq. 2.1, P(d) is the fraction of total solids smaller than size d, dmax is the maximum particle
size of the total grading, and q is the distribution modulus. Thus, d varies between dmin
(minimum particle size) and dmax. A widely known ideal grading curves is the one proposed by
[Fuller and Thompson, 1907], known as Fuller and Thompson curve, for which q is 0.5. Eq. 2.1 presents a good approximation for the ideal curve, i.e. the curve with minimal volume of voids. However, this equation can hardly be fulfilled in practice since it assumes particles of infinite fineness, i.e. dmin = 0. Therefore, the Fuller and Thompson model specifies a lower limit of No.
200 sieve (0.074 mm opening) and stipulates that at least 7% of the total grading should be finer than this size [Hunger, 2010]. [Andreasen and Andersen, 1930] showed that the voids fraction of any grading obtained from Eq. 2.1 only depends on the value of q.
Based on the varying distribution modulus, q, suggested by [Andreasen and Andersen, 1930] as well as the concept of a finite minimum particle size proposed by [Palm and Wolter, 2009], [Funk and Dinger, 1994] proposed the following expression for the optimum grading of highly concentrated coal slurries:
P d = d
q-d min q
dmaxq -dminq q ≠ 0 (2.2)
This equation is sometimes called the modified Andreasen and Andersen grading, but from here on in the current report, this curve is called the FD curve. [Funk and Dinger, 1994] proposed a
q of 0.37 for optimum packing density of the granular skeleton. It is assumed that this
distribution law delivers a feasible solution for practical purposes. As mentioned before, when discussing the grading of Andreasen and Andersen (Eq. 2.1), it is believed that decreasing values
2.2 Reduction of CO2 emissions per unit volume of concrete 11 of q can lead to better packing densities of granular materials, which theoretically yields an optimum q value in the range 0 – 0.28 (q ≠ 0) [Brouwers, 2006].
The FD curve was successfully employed by [Brouwers and Radix, 2005; Hunger, 2010] and [Mueller, 2012] to design green SCC and Eco-SCC. Hence, this curve is selected in this study to be used for the development of Eco-SCC mixtures. For further information about other ideal curves that can be found in the literature, the reader is referred to [de Larrard, 1999a].
Optimizing the grading curve is a relatively simple method which requires a few input parameters. Once the value of q is determined, the optimization of concrete mixtures mainly depends on the particle distribution of the available materials. However, such optimization technique does not take into account the shape and packing density of the particles. Thus, the output of the aforementioned equations is a continuous PSD based on the geometrical considerations and does not necessarily yield in the combination with the highest packing density. Researchers, such as [Hunger, 2010; Le et al., 2015; Mueller, 2012], recommended values of q for green or Eco-SCC mixtures that can enhance the stability and rheology of the mixtures. Such mixtures showed adequate performance (passing and filling abilities, stability, mechanical properties, and durability) according to experimental results obtained from successful concrete mixtures. Nevertheless, these values depend on the properties of the materials used in those projects. Thus, a global method for the determination of q, capable of taking into account the properties of the locally available materials, is required. A more complete discussion of this subject along with the proposed procedure developed in this dissertation can be found in Chapter 5.
2.2.2 Particle packing models
Particle packing models are mathematical equations describing the geometrical interactions between particles of different sizes in a mixture. Such models provide the theoretical packing density of a granular mixture based on the PSD of the mixture and packing density of each particle size-class. For mixture optimizations by means of particle packing models, the inputs include PSD, density, and packing density of each particle group used in the concrete. Then, the theoretical packing density of different combinations of these particle groups is determined until the maximum packing is reached (the optimum mixture). [Fennis, 2010] showed that this
method was effective to produce Eco-concrete as well as green SCC. Various particle packing density models can be found in the literature.
The Furnas model [Furnas, 1929] is only valid for two groups of monosized particles without interaction between the particles (d1 >> d2). Most of the recent models originate from this one.
Schwanda model [Fennis, 2010] is an extension of the Furnas theory enabling to account for particle packing density and PSD of each particle class, and the effect of particle shape as well as texture (indirectly). This is an easy-to-use model with no limit on the number of particle groups to be considered [Geisenhanslüke, 2008].
The compressible packing model (CPM) [de Larrard, 1999a] constitutes the compaction of a mixture via the virtual compactness (β) which is defined as the maximum potential packing density of a mixture if the particles are placed one by one in such a way that a minimum space is occupied. Such configuration for a group of monosized spheres results in β = 0.74, while a randomly packed particles of this nature attain a packing density in the range of 0.60 to 0.64. The virtual packing density is higher than the real packing density, which depends on the applied compaction energy characterized by the scalar K. As K tends towards infinity, the real packing density approaches the virtual packing density. K depends on the compaction energy and should then be defined according to the compaction process. Thus, if for each particle size-class the packing density and the associated K index is determined experimentally, the CPM can predict the packing density of any combination of such particle groups [de Larrard, 1999a].
The effects of particle shape and texture are indirectly taken into account in the CPM. Deploying the CPM is more complicated than the aforementioned models, but it provides an accurate prediction of packing density of any combination of a group of particles with different PSDs as long as the surface forces are negligible [Fennis, 2010; de Larrard, 1999a]. In the current research work, this model is employed for the theoretical calculation of packing density. The compaction – interaction packing model (CIPM), developed by [Fennis, 2010], is an extension of the CPM by [de Larrard, 1999a] in order to include interactions due to the surface forces for very fine particles. The parameters of the CIPM are very similar to those of the CPM. For particles finer than 125 μm, surface forces can exceed the gravitational forces causing the particles to agglomerate. This phenomenon can influence the randomness of the packing structure which is usually assumed for the analytical mathematical formulation of packing models. Although this model is quite promising for the prediction of the packing density of
2.3 Design methods for eco-friendly SCC 13 powder materials, further investigation is necessary to verify the applicability of the empirical parameters of the equations to materials and admixtures other than the ones used by [Fennis, 2010]. The effect of superplasticizers (SP) is particularly important to be studied since it influences the level of dispersion of fine particles in a suspension which in turn affects the measured packing density. This phenomenon may have an influence on some of the coefficients fitted experimentally in the CIPM by [Fennis, 2010].
2.3 Design methods for eco-friendly SCC
SCC was first employed in commercial applications of large scale in the late 1980s in Japan. The Japanese mix design method elaborated by [Okamura and Ozawa, 1995] is still the foundation for a number of mix design approaches for SCC production [Hunger, 2010]. This mix design is based on three main requirements: limited aggregate content, low w/p, and use of SP. To achieve the self-consolidating properties, this design method introduces some restrictions. For instance, the coarse aggregate content is fixed at 50% of the total solid’s volume in order to prevent blocking and segregation of coarser aggregate and to reduce interaction between coarse particles [Okamura, 1997]. This results in a low internal stress so that there remains enough energy required for self-flowing. Moreover, the sand volume fraction is fixed to 40% of the mortar volume. Another variable which is fixed in advance is the water/cement ratio, w/c, that is kept constant in a range of 0.9 to 1.0, by volume.
After the initial Japanese mix design concept, several other methods based on different principles, such as empirical design, compressive strength design, aggregate packing density, and statistical methods as well as rheology-based design, were proposed. An utterly comprehensive review of such methods is presented by [Shi et al., 2015]. One such mix design method for the design of SCC was proposed by [Su and Miao, 2003]. In this procedure, the state of packing of fine and coarse aggregate fractions are considered integrally. First, the aggregate fractions are combined in such a way that the minimum void fraction is achieved. In this manner, the amount of paste required to obtain the desired fluidity is minimized. In order to assess the dense packing of granular skeleton, a packing factor (PF) is introduced. Note that the Japanese method only accounts for the packing density of gravel or sand. However, SCC undergoes a self-consolidation during flow which results in packing densities higher than that of the loose
state. The packing factor of an aggregate mixture depends on the gravel to sand ratio and needs to be determined for each individual case. Therefore, the packing factor quantifies how much the packing of aggregate mixtures improves when compacted compared to the loose state and reads as
PF = ρd
ρloose (2.3)
with ρd being the apparent density of the aggregate mixture after compaction, and ρloose being
the loosely piled density of the same mixture. Afterwards, the remaining voids in the granular skeleton are filled with paste. These further steps are similar to the Japanese Method or other mix design concepts.
An analysis of the PSDs of the best performing mixtures obtained from the aforementioned Chinese mix design method by [Brouwers and Radix, 2005] revealed such PSDs are rather similar to the FD curves (Eq. 2.2). Thus, this grading was used by [Brouwers and Radix, 2005] to develop a new mix design method using the FD curve as the target PSD to optimize the volumetric fractions of all solid materials. This concept was employed by [Hunger, 2010] to produce lean SCC mixtures as described in the next section.
2.3.1 Mix design method proposed by [Hunger, 2010] for lean SCC
This mix design concept can be explained as an optimization algorithm based on the FD curve (Eq. 2.2). In this respect, the volumetric fractions of all solid materials are determined so that the deviation between the real grading curve and the target curve (Eq. 2.2.) is minimized. All calculations regarding the particle fractions are carried out on a volume basis. Therefore, the PSDs of all materials (k = 1, 2, .., m) as well as the densities are needed as input data. In addition, Eq. 2.2 requires the input of defined particle sizes. The geometric mean, d̅i;geo, of the upper (di+1)
and lower size limits (di) of the respective fraction is used as an input for d in Eq. 2.2. The size
ratio between two successive fractions is fixed at √2. The respective smallest and largest particle sizes (dmin and dmax) result from the choice of the finest and coarsest materials, respectively, that
2.3 Design methods for eco-friendly SCC 15 As a last step, the exponent q of Eq. 2.2 (the distribution modulus) should be determined. [Hunger, 2010] presented powder type SCC mixtures, with an adequate performance, optimized by distribution moduli in a range between 0.21 and 0.25. This range appears to be suitable, depending on granular properties such as particle shape and surface texture although such recommendation is not global and depends on the material used in that research. It is mentioned that with q > 0.25 granular skeleton becomes too coarse and is not flowable without the incorporation of a viscosity enhancing admixtures (VEA). The other extreme, i.e. q < 0.21 seems to produce mixtures with high volumes of fines which are very cohesive and highly viscous. These mixtures still satisfy the requirement of SCC but flow very slowly due to high viscosity [Hunger, 2010].
Once the target PSD is obtained by means of the above mentioned parameters, the least square method is used to solve a curve fitting problem to achieve minimal discrepancy between target grading Ptar' (Eq. 2.2) and the actual mixture Pmix' for all n size-classes [Hüsken and Brouwers, 2008]. Hence, the sum of the squares of residuals (RSS) should be minimized as follows
RSS= Pmix' dii+1 -Ptar' (dii+1) 2 →min
n
i=1
(2.4)
The variables used by this algorithm include the total solid volume, Vsolid, and the individual
volumetric proportions, vsolid,k, of each solid ingredient given by Eqs. 2.5 and 2.6, respectively:
Vsolid= νsolid, k=Vtot-Vw-Vair
m k=1 (2.5) νsolid,k= Vsolid,k Vsolid (2.6)
where Vtot, Vw, Vair, and Vsolid,k are the volumes of concrete, water, air, and solid material k,
respectively. With this framework of an optimization algorithm, some constraints are now required to adapt the model regarding the practical needs of a mix design tool. A rule enforces that the volumetric proportion of a selected material, vsolid,k (k = 1, 2, ..., m), must be equal to or
larger than zero. Another logical constraint refers to the volumetric equilibrium of the mixture as expressed with Eq. 2.6, ensuring that the sum of all volume fractions of solid materials is equal to unity. The total mixture volume must equal unity as well. In addition to the aforementioned constraints, there is some more input required in order to meet the requirements of standards and building specifications concerning minimum cement content, maximum w/c, and the allowable cement replacement rate by SCM and filler. This latter information is inserted by the user for each application.
Before the optimization algorithm is run, w/p is employed to determine the amount of mixing water. [Hunger, 2010] proposes that this indicator can be a reliable design parameter regarding the desired workability and strength. It was found that a w/p of 0.3 is an appropriate starting point for setting a water content for the optimization algorithm. With all materials selected (supposing the corresponding PSDs are known) and the required inputs defined, an optimization problem is formulated and solved. The output is all data on the volume fractions of employed materials (a complete concrete mix design). This step is followed by mortar experiments in order to adjust water and superplasticizer amounts for the desired fresh mortar properties that lead to satisfactory SCC mixtures.
The mortar mix design is obtained by eliminating all aggregates with a particle size larger than 4 mm from the optimized SCC mixture derived from the algorithm. [Hunger, 2010] proposes a starting SP dosage of 0.7% mass of the powder amount for the specific type of used SP. In fresh state, the mini-slump flow and the mini-V funnel tests are performed on self-consolidating mortars. It is shown that mixtures located within a ‘workable box’, limited by mini-V funnel flow times between 1.6 and 6 s, and mini-slump flow values from 300 to 360 mm can exhibit sufficient flowability and stability [Hunger, 2010]. Mortars designed within such limits are expected to result in stable and self-consolidating mixtures when converted to the concrete scale. The final step of the new mix design concept developed by [Hunger, 2010] is to examine the resulted SCC mixtures. The performance of these mixtures is presented in Section 2.4.
This mix design procedure in the current form seems promising to be used to develop Eco-SCC, particularly due to the fact that the use of an appropriate PSD for sand and coarse aggregate is a key design parameter for Eco-SCC [Mueller, 2012; Wallevik et al., 2009]. However, a few remarks can be made here. First, if a total powder content of 315 kg/m3 or less is to be reached
2.3 Design methods for eco-friendly SCC 17 (as per definition of Eco-SCC in Table 1-1), the value of q in Eq. 2.2 should be quite larger than the upper limit of 0.25 proposed by [Hunger, 2010]. Such coarse skeleton results in blocking and segregation problems. Thus, for Eco-SCC design, it is suggested to consider only sand and coarse aggregate for the PSD optimization and find other criteria, such as minimizing the water demand, for the choice of power composition. A relationship between different values of q and the packing density of the corresponding combination of sand and coarse aggregate can be established in order to choose a value of q that leads to a packing density near the maximum. Another factor to be considered is the blocking probability, i.e. the value of q should not be too high. Otherwise, the coarse aggregate volume is too large resulting in blocking (and segregation in some cases). Finally, the mortar experiments may not be necessary for Eco-SCC as the water content and SP dosage are not adjustable much according to [Mueller, 2012]. Further discussions on this subject is presented in Chapter 5.
2.3.2 Mix design method developed by [Fennis, 2010] for Eco-concrete
The mix design procedure developed by [Fennis, 2010] is based on the optimization of volume fraction of all solid particles in order to obtain the maximum packing density. The CIPM, as briefly explained in 2.2.2, is used for the calculation of packing density.
[Fennis, 2010] argues that the compressive strength should be a controlling parameter in the design procedure. Since packing density influences both water demand and the strength of concrete, a three step cyclic design method is proposed to achieve an Eco mixture. It should be kept in mind that, at this point, the design method is only valid for mixtures including Glenium 51 until the equations of the CIPM model for other SP types are further investigated.
An existing mixture (CVC, SCC, etc.) is employed in the first step to find a mixture with the highest particle packing. The output of the CIPM in this step is a mixture composition with the corresponding packing density, αt.
In the next step, the water demand of the mixture is determined. In order to predict the water demand of an ecological mixture from the packing density of the granular skeleton, two different theories are investigated by [Fennis, 2010]: the excess paste layer theory and the excess water layer theory. The former was originally developed to help designing SCC mixtures and was proven to be useful by some researchers [Fraaij and Rooij, 2008; Grünewald, 2004; Li and
Kwan, 2011, 2013; Reinhardt and Wüstholz, 2007]. The volume of excess paste is calculated from Eq. 2.7:
Vep=Vcp-Vaggregate 1-αaggregate
αaggregate (2.7)
with Vep, Vcp, and Vaggregate being the volumes of excess paste, cement paste, and sand plus coarse
aggregate. αaggregate is the maximum packing density of sand and coarse aggregate which can be
determined either experimentally or by means of CIPM. Eq. 2.8 is deployed to derive the thickness of the excess paste layer, tep, from the Vep [Midorikawa et al., 2009]. Particles in each
size group are assumed to be spherical, and tep is assumed to be constant for different sizes of
particles. Vep= 1 6π (di+2tep) 3-d i 3 Vi 1 6 πdi3 n i=1 (2.8)
where di and Vi are the geometric mean diameter and volume of particle size-class, i,
respectively. [Fennis, 2010] observes that there is a weak correlation between the mortar flow values and tep. It is explained that, due to the interactions, the cement paste and cement particles
exert a larger influence on the packing density fine of sand than on the packing density of coarse sand. The presence of cement paste in the mixture makes it necessary to adjust αaggregate used to
calculate the amount of excess paste meaning that the packing density of the entire granular structure should be used. Thus, flowability is influenced by the excess amount of water present in particle mixture as explained by the excess water layer theory.
In the excess water layer theory, part of the available water is consumed to fill in the voids between the particles while the remainder forms a water layer of thickness tew, which is well
related to the flowing behavior of cement paste. tew can be computed from Eq. 2.9 [Krell, 1985]:
tew= Vew Apmp=
Vw-Vp 1-αα t
t
2.3 Design methods for eco-friendly SCC 19 where Vew, Vw, and Vp are the volumes of excess water, water and particles, respectively. Ap and
mp are the specific surface area and mass of the particles, correspondingly. [Fennis, 2010] uses
the experimental packing density as αt and the Blaine values for AP. [Fennis, 2010] reports that
there is no apparent (unique) relationship between the viscosity measurements and tew for the
studied pastes. However, for a given w/c, good correlation are found between the flow values of mortars and the corresponding tew. In order to establish a more general relationship, [Fennis,
2010] mentions the concept of relative water volume, Wrv given by Eq. 2.10:
Wrv= Vew Vw+Vp αt = Vw-Vp 1-αα t t Vw+Vp αt (2.10)
In this equation the excess water is not determined as thickness of water layer around the particles, but calculated as a relative water volume with respect to the maximum packing density, αt. [Fennis, 2010] found a satisfactory correlation between Wrv and the flow value for
mortars made from different types of cement, filler, and sand with variable w/p. By means of
φmix, partial volume of all the solid particles in the mixture, the flow value can also be related to
the total volume of water in a mixture. [Fennis, 2010] shows that the flow value of mortars correlates well with φmix/αt which can be used to determine the water demand of a mixture for a
given flow value. φmix and thus the volume of water can be adjusted to the required consistency
through either previously established empirical relationships such as one proposed by [Fennis, 2010] or by calculations. Calculations are carried out according to Eq. 2.11 in which the design values of φmix/αt that comply with the desired workability are required.
[Fennis, 2010] proposes some design ranges that are applicable to concretes with powder content lower than 16% of total concrete volume (powder is refers to material finer than 250 μm). The design values are determined on ecological concrete and are based on the use of Glenium 51. Therefore, such recommended ranges cannot yet be employed on concrete containing other types of SP until proven to be valid. Furthermore, for other types of concrete, such as SCC, the design values of φmix/αt vary, probably due to the much higher amount of
powders in the mixture and the lower values of αt. When water absorption of the materials and
predicted air content are available, the amount of water to be dosed during the mixing process can be adjusted in this step, accodingly.
Vw= 1-φmix-aircontent
100 Vmix (2.11)
Having established the water content to secure adequate workability, the strength is now predicted from the water available in the mixture to fill voids and surround particles (excluding the absorbed water). [Fennis, 2010] states that the compressive strength exhibits a better relationship with the cement content than the powder content. Hence, a more appropriate approach to derive a relationship between packing density and compressive strength is to consider simultaneously the influence of both w/c and w/p.
Hypothetically, the distance between the cement particles should be related to the strength of the concrete or mortar mixture. [Fennis, 2010] suggests using the ratio φcem/φcem* to estimate the
cement particle distance in a stable particle structure. φcem is the volume occupied by the cement
and φcem* is the maximum volume that the cement particles can occupy in the presence of other particles. When a unit volume is filled with real particles, the volume taken by the particles,
φmix, is smaller than αt. φmix can be determined according to Eq. 2.12
φmix= Vp
Vp+Vw (2.12)
The particles in the mixture could form a stable granular structure in which the volume occupied by the stable particles is φmix/αt. Thus, a comparison of the spacing of the particles in a stable
particle structure with that of a real mixture (not necessarily stable) reveals that the volume occupied by the stable particle structure is φmix/αt within a unit volume while the real mixture
occupies the entire unit volume. Therefore, in the real mixture, such as a cement paste, all the particles are further away from each other, compared to the stable particle structure, by a factor 1/(φmix/αt) = αt/φmix. For the total cement spacing this leads eventually to Eq. 2.13
CSF= φcem φcem* αt φmix =φcemφmix φcem* α t (2.13)
![Table 2-1 General mix design elements of the mixtures considered for robustness study by [Mueller et al., 2016]](https://thumb-eu.123doks.com/thumbv2/123doknet/2925446.76851/59.892.131.786.248.436/table-general-design-elements-mixtures-considered-robustness-mueller.webp)