Contents lists available atScienceDirect
Comparative Biochemistry and Physiology - Part D
journal homepage:www.elsevier.com/locate/cbpdSub-lethal e
ffects of calcium dinonylnaphthalenesulfonate on Western
clawed frog embryos
S.J. Wallace
a, A.J.A. Leclerc
b, R. Prosser
c,d, S.R. de Solla
e, V. Balakrishnan
c, V.S. Langlois
a,b,⁎ aInstitut national de la recherche scientifique (INRS) - Centre Eau Terre Environnement, Quebec, QC, CanadabDepartment of Biology, Queen's University, Kingston, ON, Canada
cWater Science and Technology Directorate, Environment and Climate Change Canada, Burlington, ON, Canada dSchool of Environmental Sciences, University of Guelph, Guelph, ON, Canada
eEcotoxicology and Wildlife Health Division, Wildlife and Landscape Science Directorate, Environment and Climate Change Canada, Burlington, ON, Canada
A R T I C L E I N F O Keywords:
Naphthalene sulfonic acid Oxidative stress Glutathione Amphibians Silurana tropicalis
A B S T R A C T
Naphthalene sulfonic acids (NSAs) are used as additives in lubricants, dyes, and greases and commonly act as surfactants in many industrial processes. The calcium salt of dinonyl NSA (calcium dinonylnaphthalenesulfonate; CaDNS) is listed among thousands of chemicals identified as priorities for assessment by the Government of Canada's Chemical Management Plan due to the limited toxicity data. The purpose of this study was two-fold: 1) to establish the toxicity of CaDNS to Western clawed frog (Silurana tropicalis) embryos and 2) to assess the sub-lethal effects and mechanisms of toxicity of CaDNS in amphibians through targeted gene expression and me-tabolite analyses. Frog embryos were exposed to water overlying sand spiked with a range of concentrations of CaDNS (17–1393 μg/g) over a 72-h period. Results indicated significantly higher mortality and presence of malformations in frog larvae exposed to over 672μg/g CaDNS in the sand (14 ng/mL CaDNS in the water) compared to control treatments. An overall decrease in the glutathione redox cycle was observed, including decreases in relative mRNA levels of enzymes (glutathione S-transferase (gst), glutathione reductase (gsr), glu-tathione peroxidase (gpx)) and decreases in the gluglu-tathione (GSH) and gluglu-tathione disulfide (GSSG) metabolite concentrations. In addition, transcript levels of genes involved in antioxidant capacity and essential amino acid metabolites decreased significantly in embryos exposed to low levels of CaDNS. This is the first study to assess the toxicity of NSAs in amphibians, contributing important data to aid in the assessment of NSAs.
1. Introduction
The goal of the Government of Canada's Chemicals Management Plan is to determine the hazard and reduce the risk of chemicals cur-rently used in commerce to the Canadian environment. For most of these compounds, little is known about their environmental exposure, environmental fate, or their toxicity. Dinonylnaphthalene sulfonic acid (DNNSA) and its salts were identified as priorities for assessment to environmental and human health under the Chemicals Management Plan due to lack of toxicity data on these chemicals (GOC, 2016). Naphthalene sulfonic acids (NSAs) are used as corrosion inhibitors in industrial lubricants and greases, and are also used in antistatic agents to distillate solvents and commercial jet fuels (Collin et al., 2000). Spills during the manufacturing process or transport are the most probable source of NSAs to the environment (King Industries, 2004). Despite their common use, the environmental fate of NSAs is unknown, but
assuming equal emissions to soil, air and water, fugacity models predict that 77.6% will bind to soil, 8.3% to sediment, 13.9% to water, with virtually 0% predicted to enter the air (Estimation Program Interface Suite™,USEPA [U.S. Environmental Protection Agency], 2016).
The NSA calcium salt, calcium dinonylsulfonic acid (CaDNS; CAS 57855773;Fig. 1) has an estimated log KOWof 10.96 (King Industries,
2004) and water solubility of 3.91μg/L (Skanes et al., in preparation), thus it is unlikely that a large amount of CaDNS will stay in the water column or penetrate biological membranes. However, if CaDNS pri-marily binds to the sediment in the environment, it may be toxic to aquatic organisms that are directly exposed or reside close to the con-taminated substrate. NSAs may also be relatively persistent upon en-tering the environment. For instance, of eight NSAs that were identified as potential toxicants, the extent of degradation of six of them in a Zahn-Wellen's test was < 10% over a 24-h period (Greim et al., 1994). However, to the best of our knowledge, no studies have investigated the
https://doi.org/10.1016/j.cbd.2020.100658
Received 27 November 2019; Received in revised form 8 January 2020; Accepted 9 January 2020
⁎Corresponding author at: Institut national de la recherche scientifique (INRS), Centre Eau Terre Environnement, 490, de la Couronne, Québec, QC G1K 9A9,
Canada.
E-mail address:[email protected](V.S. Langlois).
Available online 29 January 2020
1744-117X/ Crown Copyright © 2020 Published by Elsevier Inc. This is an open access article under the CC BY-NC-ND license (http://creativecommons.org/licenses/BY-NC-ND/4.0/).
presence of NSAs in the environment, consequently, no data have been reported on the presence and/or concentration of NSAs in the en-vironment.
There are limited toxicity data available for NSAs. In a Microtox© test using Vibriofischeri, weak acute toxicity was evident for 1-naph-thalenesulfonic sodium salt and 2-naph1-naph-thalenesulfonic sodium salt, whereas 1,5-naphthalenedisulfonic acid and 2,6-naphthalenedisulfonic disodium salt did not cause any toxicity (Avetta et al., 2012). In rats, the median lethal dose (LD50) for oral exposure of 2-naphthalene-sulfonic acid was 400 mg/kg (Tully, 2000), while the LD50 for several other NSAs ranged from 1400– over 5000 mg/kg body weight (Greim et al., 1994). Infish, the median lethal concentration (LC50) was > 100 mg/L for seven NSAs, but an LC50 of < 100 mg/L was found for branched and linear butyl derivatives of NSA sodium salts (Greim et al., 1994). There are limited toxicity data available for CaDNS. In rats, acute oral exposure to CaDNS resulted in an LD50 of over 5000 mg/kg, whereas in rabbits, acute dermal exposure resulted in a LD50 of over 20,000 mg/kg CaDNS (USEPA, 2017).
Reactive oxygen species (ROS) are generated through normal cel-lular respiration in the mitochondria and peroxisome while efficient antioxidant systems maintain proper cellular functioning (Valko et al., 2007). However, production of ROS during xenobiotic metabolism can overwhelm the cellular antioxidant defense system, decreasing the antioxidant capacity and lead to oxidative damage (Livingstone, 2003). One potential route of detoxification is through the cytochrome P450 pathway of xenobiotic metabolism, given the affinity between 2-p-to-luidinylnaphthalene-6-sulfonic acid (TNS) and cytochrome P450 3A4 (cyp3a4; Lampe and Atkins, 2006). Similarly, many azo dyes, that contain sulfonic acid groups, are genotoxic through the generation of reaction oxygen species by metabolism reactions (Sweeney et al., 1994). The induction of cyp3a4 by CaDNS exposure (Prosser et al., in preparation) could be a source of ROS. In addition, exposure to xeno-biotics could disrupt cellular membranes leading to mitochondrial dysfunction and increased oxidative stress (Sounders et al., 2018). Al-though no information is available specific to CaDNS, some structural analogs, such as 1-anilinononaphthalene-8-sulphonic acid (ANS) and TNS are used as fluorescent dyes and bind to polar regions of phos-pholipids in cellular membranes (Kinnally and Tedeschi, 1978;Lampe
and Atkins, 2006).
One major cellular antioxidant is glutathione (GSH). Glutathione reductase (GSR) catalyzes the reduction of glutathione disulfide (GSSG) to GSH where glutathione S-transferase (GST) can catalyze the con-junction of the reduced form of GSH to xenobiotics for detoxification (Deponte, 2013). Antioxidants such as superoxide dismutase (SOD) and catalase (CAT) act as scavengers of ROS and have been shown to be useful biomarkers of oxidative damage (Livingstone, 2003). If DNA damage becomes too great, the tumor suppressing protein (P53) can activate downstream pathways for DNA repair or cellular apoptosis (Levine, 1997).
Xenobiotic exposure can also alter the molecular and biochemical activities of cellular function, such as detoxification of ROS or increased gene repair, and these responses may be mirrored by the altered me-tabolite profile in organisms (Bundy et al., 2009). One of the challenges of metabolomics and other“omics”, is the difficulty in reliably linking in vitro responses with higher level, in vivo responses. BothAngrish et al. (2015)andGonzalez-Suarez et al. (2014)exposed gas-phase probe molecules and human bronchial epithelial cells, respectively, with toxins with known mechanisms of action, and linked the metabolomic responses back to well-defined corresponding in vivo effects (Hartung et al., 2017). Similar metabolomic responses of aquatic invertebrates, terrestrial mammals, andfish following exposure to chemical stressors have been shown to be consistent with the specific mechanisms of ac-tion associated with more classic signs of toxicity (e.g., reduced growth) (Bundy et al., 2009). For example, Pacific white shrimp (Litopenaeus vannamei) chronically exposed to sublethal concentrations of sulfide (851 μg/L) for 21 days that had decreased health status also had changes in metabolites related to protein synthesis (e.g., glycine, phe-nylalanine, alanine, serine, histidine) and energy metabolism (e.g., creatine, pyruvic acid) (Li et al., 2017).
Due to a lack of data on NSA, it is critical that the potential acute toxicological effects of CaDNS be further investigated. Amphibians are useful vertebrate models for studying the toxicity of environmental contaminants due to their trophic importance, environmental sensi-tivity, research tractability, and short generation time (Hopkins, 2007). This study has three specific research objectives: 1) to establish the toxicity of NSAs to early life-stage frogs; 2) to assess the effects of Fig. 1. Chemical structure of calcium dinonylnaphthalenesulfonate (CaDNS). It is composed of two identical sub-units, which each include a naphthalene molecule, carbon side-chains, and sulfonic acid components.
CaDNS exposure on cellular stress and detoxification pathways by de-termining alterations of organismal function through gene expression and concentrations of specific metabolites; and 3) assess whether CaDNS alters metabolites representing a wide range of cellular func-tions, given its relatively unknown mechanism of action. Assessing both targeted transcript and metabolite abundance allows a systems biology approach to link molecular initiating events with responses at multiple levels of biological organization (Huang et al., 2017).
2. Materials and methods 2.1. Animal care and frog husbandry
An adult colony of the Western clawed frog (Silurana tropicalis) was maintained at the Queen's University Animal Care Facility (Kingston, ON, CA) with care performed according to policies established by the Canadian Council on Animal Care and the Queen's University Animal Care Committee (protocol Langlois-2015-1584). Adult S. tropicalis were housed in tanks under a 12 h light/12 h dark photoperiod with water temperature at 26 ± 1 °C and pH at 7.3 ± 0.3. Silurana tropicalis eggs were obtained using an established breeding protocol (Langlois et al., 2010). Briefly, 6 males and 6 females were injected in the dorsal lymph sac with a priming dose of 40μL (12.5 IU) human chorionic gonado-tropin (hCG; Sigma-Aldrich, Oakville, ON, CA) 24 h before mating and injected with 160 μL hCG (200 IU) before placed into the breeding tanks. Within approximately 6 h, fertilized healthy egg batches (n = 4) were collected, combined, and held in a Frog Embryo Teratogenesis Assay- Xenopus (FETAX) rearing solution made up of 625 mg NaCl, 96 mg NaHCO3, 75 mg MgSO4, 60 mg CaSO4-2H2O, 30 mg KCl, and
15 mg CaCl2/L of deionized, distilled water (ASTM, 1998). Once eggs
reached stage 8 on the Nieuwkoop and Faber scale (NF8) (Nieuwkoop and Faber, 1994) in development, eggs were washed with 2% L-cy-steine (Sigma Aldrich) for 2 min to remove the jelly coating and rinsed three times in a FETAX rearing solution. Eggs were sorted to ensure that only healthy, fertilized eggs were selected for the exposure. At stage NF12, approximately 8 h post-fertilization, the eggs were divided evenly and randomly into the exposure jars (n = 7 replicates/treat-ment; 50 embryos per replicate).
2.2. Experimental design
Due to the insolubility of CaDNS in water, embryonic frogs were exposed through water overlaying sand spiked with CaDNS following the protocol ofSoriano et al. (2014). A previous study investigating the sorption coefficient of CaDNS determined that CaDNS irreversibly binds to organic carbon in sediment (Skanes et al., in preparation), which could lead to low bioavailability of CaDNS to exposed biota and lead to relatively low toxicity. Thus, CaribSea Super Naturals brand ACS05820 Premium Moonlight sand was used as the substrate, and it contains a negligible amount of organic carbon (~0%). The typical particle size of the sand was 0.25–0.75 mm in diameter with an average density of 1522 kg/m3. To generate the exposure used in this experiment, CaDNS
was dissolved in hexane to produce a range of spiking solutions (nominal 20–2000 μg/g CaDNS). A negative control (i.e., hexane and CaDNS absent) and a solvent hexane control (i.e., hexane used in spiking only) were included in the study. Sand was spiked with a so-lution that represented ≤0.3% of the mixture by volume, and all treatments were spiked with the same volume of solution. In order to minimize the exposure of frog embryos to hexane, a relatively small mass of sand was spiked with the spiking solution and then left in the fume hood for 12 h to allow the solvent to evaporate. Appropriate amounts of sand per treatment were then added to the small amount of sand spiked with NSA and mixed for 24 h to produce the matrix used in testing. Following mixing, the sand was stored at 4 °C for 21 d to allow for equilibration.
The spiked sand was overlaid with FETAX rearing solution in a
1:4 w/v ratio in 125 mL jars with the addition of 0.04 ppm antibiotic gentamycin sulfate (Fisher Scientific, Ottawa, ON, CA). Twenty-four gram of spiked sand was mixed with the rearing solution for 1 min for homogenization and was left undisturbed for 24 h prior to the addition of embryos to allow the sediment to settle. Healthy S. tropicalis fertilized eggs were added to mesh cups suspended in rearing solution, which hovered approximately 2 cm above the sand for each replicate per treatment (following the protocol inSoriano et al., 2014). In order to maintain the original concentrations of CaDNS and a healthy rearing solution for larvae to develop, solution and sand were homogenized for two different sets of jars (exposed to set A at 0, 48 h; and to set B 24 h, 72 h) with the embryos being switched between the two sets with a renewal of the overlying solution every 24 h. Animals were exposed for 72 h until the onset of feeding (NF46,Nieuwkoop and Faber, 1994). 2.3. Chemical analysis in sand and water
Subsets of sand and water samples were taken every 24 h during the 72-h exposure for chemical analysis measured by liquid chromato-graphy tandem mass spectrometry (LC-MS/MS) (Waters Xevo-TQS coupled with Water Acquity UPLC) following the protocol inSkanes et al. (in preparation). Water samples werefiltered through a 0.2 μm PTFEfilter then analyzed using LC-MS/MS. CaDNS was extracted from the sand using acetone with microwave assisted extraction. Thefiltered extracts were analyzed using LC-MS-MS. Greater details on the analy-tical method to measure CaDNS in water and sand is described by Skanes et al. (in preparation). The method detection limit (MDL) for CaDNS in water and sand are 1.62μg/L and 0.533 ng/g, respectively. The reported concentrations of CaDNS in samples taken at 0 h are an average of the CaDNS concentrations in the sand before rearing solution addition (n = 3) and after homogenization with FETAX followed by a 24 h settling period (n = 3) but before addition of animals as they were not significantly different (p > 0.05; data not shown). Similarly, the concentrations in samples collected at 24 h are an average of CaDNS concentration in the sand before renewal (n = 3) and immediately after renewal (n = 3) as they were not significantly different (p > 0.05; data not shown). The following two timepoints (48 and 72 h) were measurements of thefirst two sand samples with renewed rearing so-lution (n = 3 for each).
2.4. Mortality and malformation analysis
Dead frog embryos were counted and removed daily. After the 72-h exposure, 3 replicates of 40 randomly chosen tadpoles from each treatment were anaesthetized and placed in a 10% formalin solution (Fisher Scientific, Ottawa, ON, CA) to be scored for malformations using a Nikon SMZ18 Stereomicroscope (Nikon Canada, Mississauga, ON, CA). Malformations were scored according to the Atlas of Abnormalities (Bantle et al., 1998) with a double-blind analysis method to remove observer bias. This protocol included scoring for the presence of eye, head, axial, and gut malformations, as well as edemas. The EC50 was calculated using a log(agonist) vs. response, variable slope (four parameters) regression constraining the bottom to 0% and the top to 100%. The length of each tadpole analyzed for malformations was measured using NIS Elements software (version 5.1, Nikon Canada, Mississauga, ON, CA).
2.5. Gene expression analysis
From each treatment, 10 larvae were randomly pooled together to make one sample for a total of 10 samples/treatment which wereflash frozen and stored at −80 °C until processing. Samples were homo-genized using a Retsch Mixer Mill MM 400 (Fisher Scientific, Toronto, ON, CA) for 1 min at 20 Hz and centrifugation steps were performed using a Sorvall Legend 21 Centrifuge (Thermofisher, Ottawa, ON, CA). Total RNA was isolated using the RNeasy Micro kit (Qiagen, Toronto,
ON, CA) following the manufacturer's protocol, including the on-column DNase treatment. RNA purity and nucleic acid concentrations were quantified using a Nanodrop-2000 Spectrophotometer (Thermofisher, Ottawa, ON, CA) and samples were stored at −80 °C until further analysis. Complimentary DNA (cDNA) was synthesized from 1μg RNA using the GoScript Reverse Transcription System with random primers (Promega, Madison, Wisconsin, USA). Levels of mRNA in each sample were assessed through quantitative real-time poly-merase chain reaction using a CFX96 Real Time System qPCR (BioRad, Mississauga, ON, CA) following MIQE Guidelines (Bustin et al., 2009). Genes of interest included glutathione peroxidase (gpx), glutathione reductase (gsr), glutathione S-transferase (gst), catalase (cat), super-oxide dismutase (sod), and tumor suppressing protein (p53). A master mix for each gene of interest was made using Promega GoTaq Brit Green qPCR MasterMix (Promega, Madison, WI, USA), gene-specific forward and reverse primers, and nuclease free water. Primer con-centrations and annealing temperatures differed among genes ranging from 0.15 to 0.45μM and 60 to 64 °C, respectively (Table A.1;Bissegger et al., 2018,Jönsson et al., 2011, Langlois et al., 2010, Lara-Jacobo et al., 2019,Soriano et al., 2014). Each plate contained a standard curve with a serial dilution (1:4) of 50 to 0.0048 ng pooled cDNA, no template controls, and negative reverse transcriptase controls. Standard curves and samples were both run in duplicates, which were later averaged. Standard curves were accepted when efficiencies ranged from 90.2 to 109%, and R2values were between 0.985 and 0.997. A 1:80 dilution
factor was used for samples for all genes of interest. Expression of the reference genes ornithine decarboxylase (odc) and ribosomal protein L8 (rpl8) (Langlois et al., 2010) did not differ with treatment (p > 0.05, data not shown). Therefore, mRNA levels of samples were normalized to an average of the expression of the reference genes and data are reported as fold changes relative to the solvent control.
2.6. Targeted metabolite analysis
There were no differences in gene expression between the water control and solvent control in any of the genes tested (see Section 3. Results), metabolite levels in embryos exposed to CaDNS were com-pared to levels in embryos in the solvent control treatment. Targeted metabolites were chosen to span a large range of potential toxicity mechanisms related to the observed malformations including anti-oxidant defense, amino acid metabolism, energy metabolism, immune system, and endocrine systems (Table A.3). Metabolite fractions were extracted (n = 2 for solvent control, n = 4 for each nominal con-centration 200 and 2000 μg/g CaDNS). Ten larvae for each replicate that were stored at−80 °C following the exposure were homogenized with 500μL of cold methanol (−20 °C) using a battery-operated pestle in a 1.5 mL microtube for 30 s. The homogenate was transferred to a 15 mL centrifuge tube using 2 × 1 mL rinses. Dichloromethane was added to the homogenate at an equal volume to the methanol and the homogenate was sonicated for 1 h with vortex mixing every 10 min. Methanol and dichloromethane were evaporated from the homogenates with a gentle stream of nitrogen re-constituted in 1 mL of methanol. Two replicates were pooled resulting in four replicates for metabolomic analysis in each treatment. The pooled homogenates in 15 mL cen-trifuge tubes were cencen-trifuged at 2825 ×g for 30 min before the su-pernatant was removed to 2 mL HPLC vials for LC-MS/MS analysis (Waters Xevo-TQS coupled with Water Acquity UPLC). Metabolites were targeted using LC-MS/MS in positive ion mode (ES+) with two columns. First, HILIC column (3.5μm, 2.1 mm × 150 mm; SyQuant – ZIC - HILIC) with mobile phase of (A) 10 mM ammonium formate, 0.1% formic acid made up in 90% water: 10% MeCN and (B) 10 mM am-monium formate, 0.1% formic acid made up in 90% MeCN: 10% water was used with a gradient elution (run time 20 min) for the following targets: glycine, γ-aminobutyric acid (GABA), serine, creatinine, leu-cine, histidine, phenylalanine, and kynurenine. Second, a C18 column (3.5μm, 2.1 mm × 150 mm; Xterra MS C18) with mobile phase (A)
MeOH; (B) 0.1% formic acid in water was used with a gradient elution (run time 17 min) for the following targets: malic acid, lactic acid, 17β-estradiol, progesterone, oxidized form of glutathione (glutathione dis-ulfide), reduced glutathione, pyruvic acid, and citric acid. Details on gradient elution sequence and multiple reaction monitoring for each metabolite are presented inTables A.2 and A.3of the Appendix. The MDLs for each metabolite are presented inTable A.3.
2.7. Statistical analyses
For observations below MDL for CaDNS concentrations in the sand and water, maximum likelihood estimation was used to calculate re-placement values.“Naïve” substitution methods (e.g., using ½ MDL, zero, or a random number) generally give poor results (Helsel, 2006). Using Excel's (Microsoft Corp) iterative Solver function, observations of CaDNS below MDL were replaced with values that were fit along a quantile normal plot (log-transformed) of the population mean and variance, which had the maximum log-likelihood (Villanueva, 2005). Differences in CaDNS concentrations among treatments over time were assessed with two-way ANOVA and Tukey Multiple Comparison tests in PRISM (v6, GraphPad).
Mortality and the percent of embryos with at least one malforma-tion were analyzed using a one-way analysis of variance (ANOVA) to determine significant differences between treatments and controls. Transcript levels were considered outliers and removed from the ana-lysis if they were outside 1.5× the interquartile range. Outliers were identified in the metabolite dataset using the ROUT method (Q = 1%) in Prism (v6, GraphPad). Body lengths of embryos were analyzed using a two- way ANOVA to include the replicate (n = 3 replicates of 50 embryos) as a factor. Metabolite and transcript data were analyzed for normality (Shapiro-Wilk Normality test) and equal variances (Brown-Forsythe test) before proceeding with one-way ANOVA and subsequent post-hoc tests (Dunnett test for gene expression data, Tukey-Kramer Multiple Comparison test for metabolite data). Treatments were com-pared to the solvent control. Transcript levels for all genes of interest and metabolite levels for creatinine and glutathione (reduced) were transformed by log10 to adhere to assumptions of normality and
homoscedasticity. Linear regressions were drawn if and the line was significantly different from zero. All statistical analyses were performed in Prism (v6.01, GraphPad) with the level of statistical significance set toα < 0.05.
3. Results
3.1. Concentration of CaDNS in sand and water
In the sand, both nominal concentrations of CaDNS (F(5,45) = 240.70, p < 0.0001) and time point (0 vs 72 h;
F(1,45)= 4.91, p = 0.032) contributed significantly to the variation in
CaDNS measurements (Table 1). Despite the detection of low amounts of CaDNS, there was no difference in concentration between the con-trols (p > 0.05). CaDNS concentration did not significantly change over time in the sand (from 0 to 72 h) in any of the treatments (p > 0.05) except in the 2000μg/g nominal treatment at 24 h vs 48 h (p < 0.0001). However, CaDNS concentration in the two highest nominal concentrations was different from the other treatments at all time points (p < 0.05,Table 1).
In the water concentrations for 1000 and 2000 μg/g nominal CaDNS, the time point for measurement (F(2,12)= 3.05, p < 0.0001)
and the interaction of time with treatment (F(2,12)= 4.48, p = 0.035)
contributed significantly to the variation observed, including a sig-nificant difference from 24 h to 48 h and to 72 h in both treatments. At 72 h, the CaDNS concentration in the water did not differ between the three highest nominal treatments (F(2,6)= 1.036, p = 0.41).
3.2. Percent mortality and prevalence of malformations
Mortality in the water and solvent controls was under 10%, but frequencies of malformations exceeded the 10% FETAX guidelines (Table 2). Mortality was significantly higher in treatments over 96 μg/g CaDNS in the sand but mortality did not exceed 20% (F(5,36)= 21.64,
p < 0.001;Table 2). The percentage of individuals with at least one malformation was significantly higher in treatments containing over 96 μg/g CaDNS than in the solvent control (F(5,12) = 70.77,
p < 0.0001;Fig. 2) with a higher prevalence of axial deformities and improperly coiled guts (Table 2). The overall body length of embryos was shorter when exposed to over 16.51 μg/g CaDNS, with the con-centration contributing to 25% of the total variation (F(5,795)= 204,
p < 0.0001), the replicate contributing to 0.7% of the variation (F(2,795)= 13.36, p < 0.0001), and the interaction between the two
contributing to 53% of the variation (F(10,795)= 211.5, p < 0.0001;
Table 2). The EC50 value for S. tropicalis was estimated at 40.54μg/g CaDNS (95% confidence interval: 30.85–53.73) using a least squares regression (R2= 0.85; log(agonist) vs. response– variable slope (four
parameters) with bottom constrained to 0% and top constrained to 100%).
3.3. Expression of genes involved in antioxidant defense
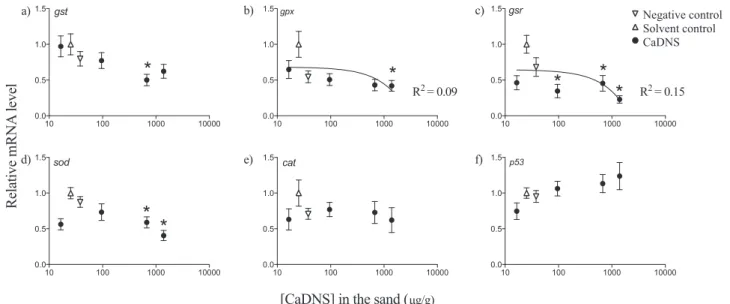
mRNA levels of the enzymes involved in the glutathione redox cycle were significantly down-regulated, including gst (at 672 μg/g CaDNS, F5,47= 2.57, p = 0.04), gpx (over 672μg/g CaDNS, F5,46= 2.86,
p = 0.025), and gsr (over 96μg/g CaDNS, F5,48= 5.55, p = 0.0004)
(Figs. 3, 4). A similar trend was noted in down regulation of sod tran-scripts (over 672μg/g CaDNS, F5,47= 7.39, p < 0.0001). There was
no pattern of cat or p53 (Fig. 3) expression with differing CaDNS
exposure.
3.4. Concentration of metabolites
Five metabolites were detected using the HILIC column and two using the C18 column (Table 3). Other metabolites related to Table 1
The concentration of calcium dinonylnaphthalenesulfonate (CaDNS) in the sand and water at 0, 24, 48, and 72 h were measured by liquid chromatography tandem mass spectrometry. Mean concentrations ± standard deviations are presented with the number of replicates in brackets (n). The average CaDNS concentration in the sand over time was used as the representative [CaDNS] for further analyses. A dash (−) indicates that sample was not analyzed due to sample loss. An asterisk (*) represents a significant difference (two-way ANOVA, p < 0.05) from all other concentrations at that time point and a dagger (†) represents a significant difference from thefirst time point measured.
Nominal 0 h 24 h 48 h 72 h Average [CaDNS]μg/g in sand Negative control 22.35 ± 18.54 (3) – – 53.70 ± 78.52 (3) 38.03 ± 53.84 Solvent control 19.05 ± 4.44 (3) 42.48 ± 51.74 (3) – 14.28 ± 1.01 (3) 25.27 ± 29.07 20μg/g 17.54 ± 1.35 (6) 16.15 ± 0.89 (6) 15.01 ± 0.72 (3) 16.67 ± 2.92 (3) 16.51 ± 1.63 200μg/g 135.95 ± 17.09 (6) 66.31 ± 11.03 (6) 74.39 ± 6.72 (3) 72.82 ± 4.86 (3) 95.64 ± 31.51 1000μg/g 772.95 ± 123.86 (6)* 595.54 ± 34.60 (6)* 687.27 ± 26.79 (3)* 609.16 ± 37.62 (3)* 672.23 ± 107.30 2000μg/g 1478.44 ± 188.83 (6)* 1215.78 ± 145.31 (6)* 1630.22 ± 239.53 (3)* 1340.46 ± 116.83 (3)* 1393.19 ± 221.66
[CaDNS] ng/mL in overlaying water
Negative control < 1.62 (3) – < 1.62 (3) Solvent control < 1.62 (3) – < 1.62 (3) 20μg/g < 1.62 (3) – < 1.62 (3) 200μg/g – – 13.62 ± 1.81 (3) 13.62 ± 1.81 1000μg/g 273.49 ± 84.61 (3) 6.01 ± 10.35 (3)† 68.92 ± 82.54 (3)† 116.14 ± 134.87 2000μg/g 482.27 ± 137.41 (3) 0.11 ± 0.17 (3)† 49.18 ± 3.88 (3)† 177.19 ± 239.86 Table 2
Lethal and observable sub-lethal effects in Silurana tropicalis embryos exposed to CaDNS. Means are presented ± standard deviation (SD) except for the specific malformations are presented as a total count for that treatment. An asterisk (*) represents a significantly different value compared to the solvent control.
[CaDNS] in the sand Mortality Malformed Number of embryos with a malformation: Length
± SD (%) ± SD (%) Axial Edema Eye Head Gut ± SD (mm)
Negative control 5.71 ± 4.01 28.55 ± 10.74 8 16 6 12 41 4.41 ± 0.87 Solvent control 8.93 ± 3.18 34.67 ± 6.43 10 19 8 13 52 4.46 ± 0.93 16.51μg/g 5.36 ± 2.67 33.56 ± 12.02 8 14 3 12 50 4.33 ± 0.86* 95.64μg/g 14.29 ± 4.01 93.60 ± 1.74* 55* 23 7 33 130* 4.11 ± 0.45* 672.23μg/g 18.21 ± 3.45* 98.33 ± 1.44* 58* 13 4 38 118* 3.56 ± 0.78* 1393.19μg/g 20.00 ± 4.08* 100.0* 78* 22 10 28 115* 3.12 ± 0.75*
[CaDNS] in the sand (μg/g)
% malformed
Negative control Solvent control CaDNS R2 = 0.85 EC50 = 40.54 μg/g CaDNS (95% CI: 30.85 – 53.73)Fig. 2. The percent of Silurana tropicalis embryos with at least one visual mal-formation with exposure to increasing concentration (16.5–1393 μg/g) of cal-cium dinonylnaphthalenesulfonate (CaDNS). Data are presented as mean ± SEM. Data were analyzed using a one-way ANOVA (n = 3 replicates of 40–50 embryos). Significance compared to the solvent control is noted with an asterisk (*, p < 0.05). Regression was drawn using log(agonist) vs response – variable slope (4 parameters) constraining the bottom to 0% and the top to 100%.
steroidogenesis and the citric acid cycle (e.g., glycine,γ-aminobutyric acid, DL-serine, DL-kynurenine, pyruvic acid, lactic acid, D-malic acid, citric acid,β-estradiol, progesterone;Table A.3) were not detected in the S. tropicalis embryos. A significant decrease in the concentrations of DL-phenylalanine (F2,7= 9.70, p = 0.01), DL-histidine (F2,7= 36.97,
p = 0.0002), creatinine (F2,7 = 13.02, p = 0.004), DL-leucine
(F2,7 = 13.5, p = 0.004), and the oxidized form of glutathione
(F2,7= 19.82, p = 0.001) were detected in embryos exposed to 96 and
1393μg/g CaDNS compared to the solvent control (Table 3). Significant decreases in alanine (F2,7= 5.33, p = 0.04) and reduced form of
glutathione (F2,7 = 101.3, p < 0.0001) metabolite concentrations
were only demonstrated in embryos exposed to 96 μg/g CaDNS (Table 3).
4. Discussion
4.1. CaDNS exposure causes increased presence of malformations As expected, dinonylnaphthalene sulfonic acids were relatively in-soluble (Tully, 2000) and the mean was 177.19 ng/mL CaDNS in the water from the highest treatment with sand spiked with 2000 μg/g CaDNS (1393μg/g CaDNS measured in the sand). At this concentration,
the maximum mortality was only 20%, but this resulted in 100% of the embryos having at least one malformation. At lower concentrations (> 95.64μg/g CaDNS in the sand, > 13.62 ng/mL in the water), mal-formations were more prevalent than the solvent control. The EC50 of 40.54 (30.85–53.73) μg/g CaDNS suggests that low concentrations of CaDNS in the environment could induce sub-lethal effects in amphi-bians. Most malformations included the increased presence of dorsal flexure of the tail, an improperly coiled gut, and shorter overall body length, indicating abnormal, or delayed development (Bantle et al., 1998). In contrast, a similar 72–h acute sediment exposure of em-bryonic S. tropicalis to the azo dyes Acid Red 97 and Bismarck Brown Y that contained sulfonic acid functional groups, had both low mortality and low prevalence of malformations (Soriano et al., 2014), but the exposure was approximately only half of the nominal exposure of this study.
4.2. Overall decrease in the glutathione redox cycle with exposure to CaDNS An overall decrease was observed for components in the glutathione redox cycle with exposure to CaDNS for both datasets including a de-crease in the metabolite concentrations of the reduced (GSH) and oxi-dized (glutathione disulfide, GSSG) form of glutathione as well as a
10 100 1000 10000 0.0 0.5 1.0 1.5 gst 10 100 1000 10000 0.0 0.5 1.0 1.5 sod 10 100 1000 10000 0.0 0.5 1.0 1.5 gpx 10 100 1000 10000 0.0 0.5 1.0 1.5 cat 10 100 1000 10000 0.0 0.5 1.0 1.5 gsr 10 100 1000 10000 0.0 0.5 1.0 1.5 p53
[CaDNS] in the sand (
μg/g)Relative m
R
NA
l
evel
R 2 =0.09 R2 = 0.15*
*
*
*
*
*
*
a) b) c) ) f ) e ) d Negative control Solvent control CaDNSFig. 3. Relative mRNA levels in genes involved in oxidative stress defense including a) glutathione S-transferase (gst), b) glutathione peroxidase (gpx), c) glutathione reductase (gsr), d) superoxide dismutase (sod), and e) catalase (cat), and the f) tumor suppressing protein (p53) in Silurana tropicalis embryos exposed to calcium dinonylnaphthalenesulfonate (CaDNS) for 72 h. Data are presented as mean ± SEM. Data were analyzed using a one-way ANOVA (n = 10). Significance compared to the solvent control is noted with an asterisk (*, p < 0.05).
Fig. 4. Alterations to the glutathione redox cycle in Silurana tropicalis embryos exposed to a) 96μg/g calcium dinonylnaphthalenesulfonate (CaDNS) compared to the solvent control and to b) over 672μg/g CaDNS compared to the solvent control (solid arrows) or compared to lower exposure of CaDNS (dotted arrows). Black arrows represent significant difference (p < 0.05) and grey arrows represent an insignificant change. Capital letters represent metabolites measured and lower-case italics represent gene expression of the enzymes. Grey text was not measured in this study. Glutathione (reduced form, GSH), glutathione disulfide (oxidized form, GSSG), glutathione S-transferase (gst), glutathione peroxidase (gpx), glutathione reductase (gsr).
decrease in the transcripts of enzymes responsible for converting be-tween the two (gpx, gsr) and for xenobiotic conjugation to GSH (gst) (Fig. 4). As an efficient ROS scavenger, GSH is typically maintained at higher concentrations than GSSG under normal conditions (Dickinson and Forman, 2002). However, in this study, embryonic S. tropicalis in the solvent control had 13× higher GSSG than GSH metabolite levels. Although uncommon, GSH:GSSG ratios under 1 have been reported in relation to cellular oxidative stress in humans pre- and post-hepato-cellular carcinoma tumor removal (Cheng et al., 2017) and in gall-bladders of rats exposed to acetaminophen (Cao et al., 2013). The higher GSSG compared to GSH levels is consistent with apoptopic cells at a higher oxidized level than proliferating cells (Jones, 2002). This could indicate oxidative stress where GSH decreases with a subsequent increase in GSSG, or it could be due to limitations of analysis where GSH can rapidly oxidize to GSSG during sample processing (Sentellas et al., 2014). Therefore, the results will be discussed in relative terms to the solvent control metabolite levels.
The lowest concentrations of GSH and GSSG metabolites were ob-served in S. tropicalis embryos exposed to 96μg/g CaDNS, consistent with a significant decrease in gsr expression, but concentrations close to the metabolite levels observed in the controls were evident in embryos exposed to 1383μg/g CaDNS (Fig. 4). The reduction of GSH levels at a lower concentration of CaDNS (96 μg/g) could occur as a result of oxidation by GPX or by the use of GSH in conjugation reactions by GST (Dickinson and Forman, 2002). The loss of GSH was associated with increased oxidative stress in plasma of humans with hepatocellular carcinoma (Cheng et al., 2017). When a cell is under excess oxidative stress, GSH levels decrease resulting in cellular damage and death as well as interrupting peroxisome proliferator-activated receptor sig-naling pathways in skeletal muscle (Aquilano et al., 2014). These pathways may be linked to the increased mortality and malformations evident in frog embryos exposed to CaDNS, but this remains to be studied. Furthermore, a decrease in gsr in S. tropicalis embryos exposed to CaDNS suggests a reduced efficiency for the reduction of GSSG to GSH, thus the decrease in GSSG could be due to exportation out of the cell. At a higher exposure of 1393 μg/g CaDNS, transcription of the enzyme GPX was decreased in addition to the decrease in gsr, de-creasing the efficiency of the overall redox cycle and potentially leading to the accumulation of GSH and GSSG. Similarly, in the human hepa-tocellular carcinoma tumor tissue itself, GSH level was higher than normal tissue despite the increase in GPX activity, suggesting that GSH was regenerated through de novo synthesis to combat the increased oxidative stress (Cheng et al., 2017).
In addition, the initial decrease of GSH and GSSG metabolites at 96μg/g CaDNS was more substantial for GSSG than GSH but despite both increasing at higher exposure (1393μg/g CaDNS), only GSH levels were not significantly different from the solvent control. Therefore, an increase in the GSH:GSSG ratio was evident with higher CaDNS
exposure. A decrease in GSH often occurs with an increase in gluta-mate:cysteine ligase an enzyme involved in de novo synthesis of GSH (Jones, 2002) subsequently augmenting GSH levels in the cells. Nor-mally, any accumulation of GSSG is short-lived due to the high e ffi-ciency of GSR but if the cell is overwhelmed by oxidative stress, an increase in GSSG can indicate an increase in protein mixed disulfides that can interrupt essential signaling proteins (Dickinson and Forman, 2002). Therefore, the overall decrease in the glutathione redox cycle and increased presence of malformations in embryos exposed to CaDNS suggesting cellular oxidative stress is occurring leading to disruptions in normal development. Further analysis of metabolite and gene expres-sion levels within these pathways should be conducted to clarify these relationships (Prosser et al., in preparation).
4.3. Decrease in antioxidant capacity
Consistent with the decrease in overall glutathione antioxidant ca-pacity, there was evidence of down-regulation of other genes involved in oxidative stress response. A decrease in the transcript levels of the ROS scavenger sod occurred with increasing CaDNS exposure in frog embryos. With less GSH and SOD in the cell, an overabundance of ROS could lead to oxidative damage and further disrupt normal cellular pathways (Livingstone, 2003).
4.4. Decrease in essential metabolite concentrations
Concentrations of metabolites related to amino acid metabolism were down-regulated in S. tropicalis embryos exposed to over 96μg/g CaDNS which may be linked to the decreased body length observed. Early life stages of zebrafish (Danio rerio) exposed to the pesticide di-fenoconazole also had a decrease in levels of metabolites involved in amino acid metabolism (e.g., phenylalanine, leucine, histidine, alanine) likely causing the decreased body length (Teng et al., 2018). In contrast, striped marsh frog (Limnodynastes peronii) tadpoles exposed to a mix-ture of pharmaceuticals showed an increase in metabolites of amino acids (e.g. leucine) in a non-monotonic manner (Melvin et al., 2017), suggesting that different metabolites could be biomarkers for different contaminants.
4.5. Conclusions
Silurana tropicalis embryos exposed to 96μg/g CaDNS in the sand (resulting in 14 ng/mL in the water) caused almost 100% of the in-dividuals to be malformed with indication of a developmental delay, a decrease in the expression and metabolite levels involved in antioxidant capacity, and a decrease in essential amino acid metabolite levels. The transcript and metabolite datasets were analyzed individually to assess the overall sensitivity and response of each as relevant biomarkers Table 3
Concentration of metabolites detected in Silurana tropicalis embryos exposed to solvent control, 96μg/g, or 1393 μg/g calcium dinonylnaphthalenesulfonate (CaDNS) in the sand. Significant difference from solvent control is indicated with an asterisk (* p < 0.05, ** p < 0.01, *** p < 0.001) and from 96 μg/g is indicated with a dagger (†p < 0.05).
Metabolite concentration ± standard deviation (ng/g)
Metabolite Solvent control 96μg/g CaDNS 1393μg/g CaDNS
C18 column Glutathione-reduced 23.35 ± 5.60 5.46 ± 0.77*** 20.17 ± 1.86† Glutathione-oxidized 301.25 ± 116.88 55.38 ± 12.33** 143.19 ± 6.48* GSH/GSSG ratio 0.08 0.10 0.14**† HILIC column DL-phenylalanine 23,176.80 ± 5050 12,929.07 ± 3849* 10,888.35 ± 1458** DL-histidine 50,696.49 ± 4471 21,708.93 ± 6442*** 16,984.12 ± 1694*** Creatinine 1056.66 ± 403 363.32 ± 98** 440.99 ± 51* DL-leucine 4162.36 ± 721 2164.80 ± 764* 1507.64 ± 260** Alanine 1741.53 ± 463 999.96 ± 263* 1356.12 ± 160
(Huang et al., 2017) in frogs for exposure to CaDNS. Despite the tran-script levels of genes not being a direct link to metabolite level (as opposed to protein level), combining transcriptomics with metabo-lomics conceptually can be a valuable tool to understand biological relationships fully (Cavill et al., 2016). Performing untargeted analyses would help decipher a mechanism of action of toxicity for NSAs and provide insight towards developing an adverse outcome pathway. Declaration of competing interest
The authors declare that they have no known competingfinancial
interests or personal relationships that could have appeared to influ-ence the work reported in this paper.
Acknowledgements
This project was funded by the Government of Canada's Chemicals Management Plan, the Strategic Technology Applications of Genomics in the Environment (STAGE) program and the Canada Research Chairs to VSL (950-230442).
Appendix A Table A.1
qPCR primers (F: forward; R: reverse) and assay conditions for genes of interest in S. tropicalis. Primers were designed in the following studies:aBissegger et al., 2018, bLanglois et al., 2010, andcSoriano et al., 2014.
Function Target gene Primer sequence (5′-3′) Length (bp) Temp. (°C) [Primer] (μM)
Phase II detoxification Glutathione peroxidasea gpx F: CGAACCCAACTTCCCCTTGT R: TAGGATACGGAAGTTGCCCC
94 60 0.25
Glutathione reductasea gsr F: CGCCGCTACTCTAACAACAA R: GGACTGAGGAGTAAAGGGCA
98 60 0.35
Glutathione S-transferasea gst F: ATTGCGTGGGAGATGAGGTG R: ATTGTGGGATAGGGGGCAAG
99 60 0.35
Catalasea cat F: ACAATGCCAAGTGCCCAAAGAAGGA
R: AGGCGTAGGGTTAATGAAGCGGAGA
116 60 0.15
Superoxide dismutasea sod F: CTGGCTTGTGGCGTGATTG R: AACAGGGAGACCAACCAACA
99 60 0.35
Mutagenic response Tumor suppressing proteinc p53 F: GCTGCTTTGAGGTTCGTGTG R: TCTTCCCGTTGGGTTTCAGG
99 64 0.45
Reference genes Ornithine decarboxylaseb odc F: TGAATGATGGCGTGTATGGA R: CAAGCAGCATTTGGGGAC
120 62 0.15
Ribosomal protein L8b rpl8 F: CCCTCAACCATCAGGAGAGA R: TCGTCTGCGTGGTACAAAGA
88 62 0.45
Table A.2
Gradient elution sequence used to separate metabolites using a HILIC column and a C18 column for targeted metabolomic analysis of frog larvae exposed to CaDNS.
HILIC column C18 column
Time Percent A: 90:10 H2O: acetonitrile Percent of B: 90:10 acetonitrile: H2O Time Percent A: methanol Percent B: water +0.1% formic acid
0 0 100 0 0 100 12 100 0 5 0 100 15 100 0 9 100 0 17 0 100 11 100 0 20 0 100 12 0 100 17 0 100 Table A.3
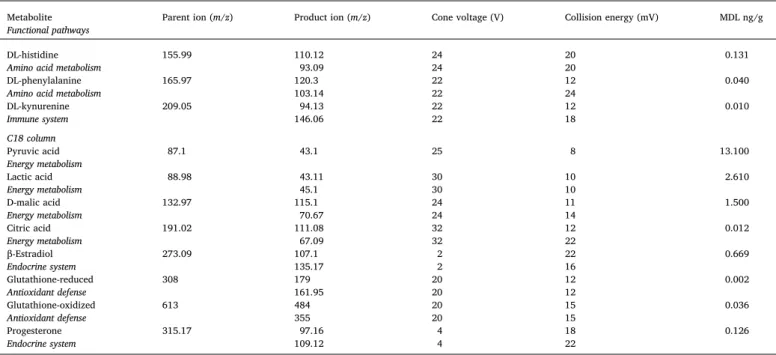
Parent ion, product ion, cone voltage, collision energy, and method detection limit (MDL) using in tandem mass spectrometry to detect each targeted metabolite in frog larvae exposed to CaDNS.
Metabolite Functional pathways
Parent ion (m/z) Product ion (m/z) Cone voltage (V) Collision energy (mV) MDL ng/g
HILIC column
Glycine 76.04 30.14 20 6 1.470
Amino acid metabolism 48.19 20 4
γ-Aminobutyric acid 103.96 69.1 18 12 0.055
Amino acid metabolism 45.18 18 16
DL-alanine 105.87 44.2 22 6 0.119
Amino acid metabolism 70.15 50 12
DL-serine 105.93 60.14 22 4 0.770
Amino acid metabolism 70.09 22 10
Creatine 113.96 44.15 32 12 0.021
Energy metabolism 86.16 32 10
DL-leucine 132.01 86.14 20 10 0.007
Amino acid metabolism 30.2 20 16
Table A.3 (continued) Metabolite
Functional pathways
Parent ion (m/z) Product ion (m/z) Cone voltage (V) Collision energy (mV) MDL ng/g
DL-histidine 155.99 110.12 24 20 0.131
Amino acid metabolism 93.09 24 20
DL-phenylalanine 165.97 120.3 22 12 0.040
Amino acid metabolism 103.14 22 24
DL-kynurenine 209.05 94.13 22 12 0.010 Immune system 146.06 22 18 C18 column Pyruvic acid 87.1 43.1 25 8 13.100 Energy metabolism Lactic acid 88.98 43.11 30 10 2.610 Energy metabolism 45.1 30 10 D-malic acid 132.97 115.1 24 11 1.500 Energy metabolism 70.67 24 14 Citric acid 191.02 111.08 32 12 0.012 Energy metabolism 67.09 32 22 β-Estradiol 273.09 107.1 2 22 0.669 Endocrine system 135.17 2 16 Glutathione-reduced 308 179 20 12 0.002 Antioxidant defense 161.95 20 12 Glutathione-oxidized 613 484 20 15 0.036 Antioxidant defense 355 20 15 Progesterone 315.17 97.16 4 18 0.126 Endocrine system 109.12 4 22 References
Angrish, M.M., Madden, M.C., Pleil, J.D., 2015. Probe molecule (PrM) approach in ad-verse outcome pathway (AOP) based high-throughput screening (HTS): in vivo dis-covery for developing in vitro target methods. Chem. Res. Toxicol. 28, 551–559.
Aquilano, K., Baldelli, S., Ciriolo, M.R., 2014. Glutathione: new roles in redox signaling for an old antioxidant. Front. Pharmacol. 5, 196.
ASTM [American Society of Testing and Materials], 1998. Standard guide for conducting the frog embryo teratogenesis assay— Xenopus (FETAX). In: Annual Book of ASTM Standards 11.04, pp. 1439–1498.
Avetta, P., Prevot, A.B., Fabbri, D., Montoneri, E., Tomasso, L., 2012. Photodegradation of naphthalene sulfonic compounds in the presence of a bio-waste derived sensitizer. Chem. Eng. J. 197, 193–198.
Bantle, J.A., Dumont, J.N., Finch, R.A., Linder, G., Fort, D.J., 1998. Atlas of Abnormalities: A Guide for the Performance of FETAX, second edition. Oklahoma State University, Printing services.
Bissegger, S., Pineda Castro, M.A., Yargeau, V., Langlois, V.S., 2018. Phthalates modulate steroid 5-reductase transcripts in the Western clawed frog embryo. Comp. Biochem. Physiol. C: Pharmacol. Toxicol. Endocrinol. 213, 39–46.
Bundy, J.G., Davey, M.P., Viant, M.R., 2009. Environmental metabolomics: a critical review and future perspectives. Metab. 5, 3–21.
Bustin, S.A., Benes, V.B., Garson, J.A., Hellemans, J., Huggett, J., Kubista, M., Mueller, R., Nola, T., Pfaffl, M.W., Shipley, G.L., Vandesompele, J., Wittwer, C.T., 2009. The MIQE guidelines: minimum information for the publication of quantitative real-time PCR experiments. Clin. Chem. 55, 611–622.
Cao, L., Waldon, D., Teffera, Y., Roberts, J., Wells, M., Langley, M., Zhao, Z., 2013. Ratios of biliary glutathione disulfide (GSSG) to glutathione (GSH): a potential index to screen drug-induced hepatic oxidative stress in rats and mice. Anal. Bioanal. Chem. 405, 2635–2642.
Cavill, R., Jennen, D., Kleinjans, J., Briedé, J.J., 2016. Transcriptomic and metabolomic data integration. Brief Bioinf. 17, 891–901.
Cheng, S.-B., Liu, H.-T., Chen, S.-Y., Lin, P.-T., Lai, C.-Y., Huang, Y.-C., 2017. Changes of oxidative stress, glutathione, and its dependent antioxidant enzyme activities in pa-tients with hepatocellular carcinoma before and after tumor resection. PLoS One 12, e0170016.
Collin, G., Höke, H., Greim, H., 2000. Ullmann’s Encyclopedia of Industrial Chemistry. Wiley-VCH Verlag GmbH & Co. KGaAhttps://doi.org/10.1002/14356007.a17_001. pub2.
Deponte, M., 2013. Glutathione catalysis and the reaction mechanisms of glutathione-dependent enzymes. Biochim. Biophys. Acta 1830, 3217–3266.
Dickinson, D.A., Forman, H.J., 2002. Cellular glutathione and thiols metabolism. Biochem. Pharmacol. 64, 1019–1026.
Gonzalez-Suarez, I., Sewer, A., Walker, P., Mathis, C., Ellis, S., Woodhouse, H., Guedj, E., Dulize, R., Marescotti, D., Acali, S., Martin, F., Ivanov, N.V., Hoeng, J., Peitsch, M.C., 2014. Systems biology approach for evaluating the biological impact of environ-mental toxicants in vitro. Chem. Res. Toxicol. 27, 367–376.
Government of Canada, 2016. Chemicals Management Plan- Chemical Substances Website. Retrieved from:http://www.chemicalsubstanceschimiques.gc.ca/plan/ index-eng.php.
Greim, H., Ahlers, J., Bias, R., Broecker, B., Hollander, H., Gelbke, H.-P., Klimisch, H.-J.,
Mangelsdorf, I., Paetz, A., Schön, N., Stropp, G., Vogel, R., Weber, C., Ziegler-Skylakakis, K., Bayer, E., 1994. Toxicity and ecotoxicity of sulfonic acids: structure-activity relationship. Chemosphere 28, 2203–2236.
Hartung, T., FitzGerald, R.E., Jennings, P., Mirams, G.R., Peitsch, M.C., Rostami-Hodjegan, A., Shah, I., Wilks, M.F., Sturla, S.J., 2017. Systems toxicology: real world applications and opportunities. Chem. Res. Toxicol. 30, 870–882.
Helsel, D.R., 2006. Fabricating data: how substituting values for nondetects can ruin results, and what can be done about it. Chemosphere 65, 2434–2439.
Hopkins, W.A., 2007. Amphibians as models for studying environmental change. ILAR J. 48, 270–277.
Huang, S.S.Y., Benskin, J.P., Chandramouli, B., Butler, H., Helbing, C.C., Cosgrove, J.R., 2017. Xenobiotics produce distinct metabolomics responses in zebrafish larvae (Danio rerio). Environ. Sci. Technol. 50, 6526–6535.
Jones, D.P., 2002. Redox potential of GSH/GSSG couple: assay and biological sig-nificance. Methods Enzymol. 34, 93–112.
Jönsson, M.E., Berg, C., Goldstone, J.V., Stegeman, J.J., 2011. New CYP1 genes in the frog Xenopus (Silurana) tropicalis: induction patterns and effects of AHR agonists during development. Toxicol. App. Pharmacol. 250, 170–183.
King Industries, 2004. High Production Volume (HPV) Challenge Program Test Plan and Data Review: Dinonylnaphthalene Category (USEPA Publication #201-15766A). Retrieved from: https://www.scribd.com/doc/139917532/Stadis-450-DINNSA-Barium-Salt-Aviation-Fuel-Additive.
Kinnally, K.W., Tedeschi, H., 1978. Metabolic effects of some electrofluorimetric dyes. BBA– Bioenergetics 503, 380–388.
Lampe, J.N., Atkins, W.M., 2006. Time-resolvedfluorescence studies of heterotropic
li-gand binding to cytochrome P450 3A4. Biochem. 45, 12204–12215.
Langlois, V.S., Duarte-Guterman, P., Ing, S., Pauli, B.D., Cooke, G.M., Trudeau, V.L., 2010. Fadrozole andfinasteride exposures modulate sex steroid- and thyroid hormone-re-lated gene expression in Silurana (Xenopus) tropicalis early larval development. Gen. Comp. Endocrinol. 166, 417–427.
Lara-Jacobo, L.R., Willard, B., Wallace, S.J., Langlois, V.S., 2019. Cytochrome P450 1A transcript is a suitable biomarker of both exposure and response to diluted bitumen in developing frog embryos. Environ. Pollut. 246, 501–508.
Levine, A.J., 1997. p53, the cellular gatekeeper for growth and division. Cell 88, 323–331.
Li, T., Li, E., Suo, Y., Xu, Z., Jia, Y., Qin, J.G., Chen, L., Gu, Z., 2017. Energy metabolism and metabolomics response of Pacific white shrimp Litopenaeus vannamei to sulfide toxicity. Aquat. Toxicol. 183, 28–37.https://doi.org/10.1016/j.aquatox.2016.12. 010.
Livingstone, D.R., 2003. Oxidative stress in aquatic organisms in relation to pollution and aquaculture. Rev. Méd. Vét. 154, 427–430.
Melvin, S.D., Habener, L.J., Leusch, F.D.L., Carroll, A.R., 2017.1H NMR-based metabo-lomics reveals sub-lethal toxicity of a mixture of diabetic and lipid-regulating phar-maceuticals on amphibian larvae. Aquat. Toxicol. 184, 123–132.
Nieuwkoop, P., Faber, J., 1994. Normal Table of Xenopus laevis (Daudin). Garland, New York.
Prosser, R., Wallace, S.J., Balakrishnan, V., Langlois, V.S., in preparation. Untargeted analyses of the sub-lethal effects of calcium dinonylnaphthalenesulfonate on Western clawed frog embryos. (in preparation)
Sentellas, S., Morales-Ibanez, O., Zanuy, M., Albertí, J.J., 2014. GSSG/GSH ratios in cryopreserved rat and human hepatocytes as a biomarker for drug induced oxidative
stress. Toxicol. in Vitro 28, 1006–1015.
Skanes, B., Toito, J., Prosser, R.S., Balakrishnan, V., in preparation. Sorption of naph-thalene sulfonates to sediment with different quantities of organic carbon.
Soriano, J.J., Mathieu-Denoncourt, J., Norman, G., de Solla, S.R., Langlois, V.S., 2014. Toxicity of the azo dyes Acid Red 97 and Bismarck Brown Y to Western clawed frog (Silurana tropicalis). Environ. Sci. Pollut. Res. 21, 3582–3591.
Sounders, C.L., Liang, X., Wang, X., Ector, N., Zhao, Y.H., Martyniuk, C.J., 2018. High-throughput assessment of oxidative respiration infish embryos: advancing adverse outcome pathways for mitochondrial dysfunction. Aq. Tox. 199, 162–173.https:// doi.org/10.1016/j.aquatox.2018.03.031.
Sweeney, E.A., Chipman, J.K., Forsythe, S.J., 1994. Evidence for direct-acting oxidative genotoxicity by reduction products of azo dyes. Environ. Health Perspect. 102, 119–122.
Teng, M., Zhu, W., Wang, D., Qi, S., Wang, Y., Yan, J., Dong, K., Zheng, M., Wang, C., 2018. Metabolomics and transcriptomics reveal the toxicity of difenoconazole to the
early life stages of zebrafish (Danio rerio). Aquat. Toxicol. 194, 112–120.
Tully, P.S., 2000. Sulfonic acids. In: Kirk-Othmer Encyclopedia of Chemical Technology.
USEPA [U.S. Environmental Protection Agency], 2016. Estimation Programs Interface Suite™ for Microsoft® Windows. United States Environmental Protection Agency, Washington, DC, USA.
USEPA [U.S. Environmental Protection Agency], 2017. Chemistry Dashboard.https://
comptox.epa.gov/dashboard/DTXSID4028046((accessed October 06, 2017),
Naphthalenesulfonic acid, dinonyl-, calcium salt).
Valko, M., Leibfritz, D., Moncol, J., Cronin, M.T.D., Mazur, M., Telser, J., 2007. Free radicals and antioxidants in normal physiological functions and human disease. Int. J. Biochem. Cell Biol. 39, 44–84.https://doi.org/10.1016/j.biocel.2006.07.001.
Villanueva, P., 2005. MLE-Based Procedure for Left-Censored Data Excel Spreadsheet. Washington, DC: Office of Pesticide Programs. U.S. Environmental Protection Agency.