Disruption Mitigation and Real-time Detection of
Locked Modes
by
Sarah Martha Angelini
B.S., Columbia University (2005)
Submitted to the Department of Nuclear Science and Engineering
in partial fulfillment of the requirements for the degree of
Master of Science in Nuclear Science and Engineering
at the
MASSACHUSETTS INSTITUTE OF TECHNOLOGY
February 2008
@ Massachusetts Institute of Technology 2008. All rights reserved.
Author
.
Department of Nuclear Science and Engineering
January 2008
Certified b3
f
/
Dr. Robert S. Granetz
Principal Research Scientist, PSFC
Thesis Supervisor
Certified by..
Dr. Ian H. Hutchinson
Head, Department of Nuclear Science and Engineering
S,
4 Thesis Reader
MASSAH~USETIS NSTIrE OF TECHNOLOGYJUL 2 4 2008
LIBRARIES
Accepted by ...
/IDr. Jacquelyn C. YaIinch
ChaiarIperson. Department Committee on Gradu(ate Studlents
--Disruption Mitigation and Real-time Detection of Locked
Modes
by
Sarah Martha Angelini
Submitted to the Department of Nuclear Science and Engineering on January 11, 2008, in partial fulfillment of the
requirements for the degree of
Master of Science in Nuclear Science and Engineering
Abstract
Disruptions are one of the largest problems facing tokamaks. In a large-scale exper-iment such as ITER, disruptions may cause crippling damage and severe setbacks in experimentation. One method for disruption mitigation involves the use of a gas jet which has been tested on both stable plasmas and vertical displacement events (VDEs) on Alcator C-Mod. In both cases, the jet was successful in mitigating dis-ruption effects. The gas jet has not yet been tested on other types of disdis-ruptions. Locked-mode disruptions are easily created in C-Mod and could be used to test the ef-fectiveness of the gas jet as a mitigation method if the jet could be fired early enough. It has been empirically observed that the electron cyclotron emissions (ECE) signal displays a flattening of the normally-present sawteeth before the current quench oc-curs in certain locked-mode disruptions. A procedure has been written which detects the ECE sawtooth suppression by calculating changes in the standard deviation of the signal over a moving time-window. This procedure has been programmed into the digital plasma control system (DPCS) for real-time testing. The procedure suc-cessfully located the locked modes present during a run.
Thesis Supervisor: Dr. Robert S. Granetz Title: Principal Research Scientist, PSFC
Acknowledgments
Many thanks to my advisor, Dr. Robert Granetz, for all his guidance and wisdom on each of the projects I worked on at MIT.
Many others deserve recognition. Special thanks goes to Dr. Stephen Wolfe for his patience in helping me convert my procedure into the proper DPCS format, to Matthew Reinke who allowed me to test my procedure in real-time during his run, to Dr. Patrick Winston and Dr. Sajit Rao for their advice on neural networks and to Dr. Ian Hutchinson for taking the time to read my thesis. I would also like to thank Dr. Michael Mauel, Dr. Thomas Pedersen, Dr. David Humphreys, and Dr. Alan Hyatt for all of their support and enthusiasm.
This research was supported by the MIT Presidential Fellowship, the DoE Fusion Energy Science Fellowship, and DoE Contract Number DE-FC02-99ER54512.
Contents
1 Introduction
1.1 Types of Disruptions ...
1.2 Gas Jet Mitigation of Disruptions . . . . 1.3 Effects of the Gas Jet on Stable Plasmas and VDEs 1.4 Problems Detecting Locked-mode Major Disruptions
1.4.1 Locked Modes ...
1.4.2 Asymmetry Detection Coils . . . .
2 Locked-mode Detection Procedure
2.1 Drawbacks of a Neural Network ...
2.2 Electron Cyclotron Emission Signal and Sawteeth . 2.3 Digital Plasma Control System . . . . 2.4 Three Locked-mode Detection Tests . . . .
2.4.1 Test 1: Normalized Standard Deviation Test
2.4.2 Test 2: Relative Standard Deviation Test . .
2.4.3 Test 3: Mean Test ... 2.4.4 Summary of Tests ... 3 Revisions of the Procedure
3.1 Alternative Tests ... ...
3.1.1 False Positives due to the Rampdown . . . .
3.1.2 Stepped Normalized Standard Deviation Threshold
3.1.3 Repeated Normalized Standard Deviation Test . . .
11 . .. 12 . . . 13 . . . 13 . . . 14 . .. 15 . . . 15 17 . . . . 17 . . . . 18 . . . . 18 . . . . . 20 . . . . . 20 . . . . . 21 . . . . 22 . . . . 24 27 ... . 27 . . . . 27 . . . . 29 . . . . 29
3.2 Conversion of the Procedure to the DPCS Format ...
3.2.1 Changes to the Off-line Version ...
3.2.2 Optimization of the Procedure . ...
4 Real-time 4.0.3
4.0.4 4.0.5
Testing of the Procedure
Successful Locked-mode Detection . ...
False Positive ... DPCS Timing Problem . ... . ... 5 Future Work 35 35 37 37
List of Figures
2-1 Examples of ECE signals with and without locked modes ... 19
2-2 Figure showing the Normalized Standard Deviation Test ... 21
2-3 Figure showing the failure of the first test . ... 22
2-4 The relative standard deviation test . ... 23
2-5 False positive using the first two tests . ... 23
2-6 Successful use of the three tests ... 24
2-7 Summary of the three tests ... 24
3-1 False positive due to the rampdown ... 28
3-2 Figure 1060517016 showing a temporary "dip" in the normalized stan-dard deviation ... . . ... ... ... .. .. .. .. .. . 30
4-1 Real-time scopes of the locked mode tests . ... 36
Chapter 1
Introduction
The tokamak is currently one of the leading designs for a magnetically confined fu-sion reactor. The tokamak stably contains a plasma using a toroidal magnetic field sustained by magnetic coils in conjunction with a poloidal magnetic field created pri-marily by the current in the plasma. Because of the complicated interplay between the magnetic fields and the plasma current and pressure, confining the plasma is a complicated process. Sometimes confinement is suddenly lost and the plasma dis-rupts. When a disruption occurs, large amounts of energy and current are driven into the wall of the tokamak causing the melting and disintegration of plasma-facing surfaces. In smaller machines, a disruption may be tolerated, but in a reactor-sized machine, one strong disruption could be damaging enough to require serious repairs and cause severe setbacks in its operation.
While some disruptions are caused by running a tokamak at certain operational limits (and may be avoided in principle), others due to plasma instabilities and equip-ment failures are simply unavoidable. Because of the drastic damage a single disrup-tion could do to a larger machine such as ITER, it is imperative that proper mitigadisrup-tion and prevention methods are developed.
1.1
Types of Disruptions
Disruptions are not simply an instantaneous loss of confinement of a plasma. There are a few stages that take place during a disruption. The actual order of these stages can vary depending on the type of disruption, but most disruptions will pass through each of them. A disruption has a thermal quench, a current quench, and usually a loss of vertical position. During the thermal quench phase the plasma loses its stored energy either due to MHD instabilities or because the plasma becomes limited by making contact with the wall of the vacuum vessel. As a result of the loss of thermal energy, the current may first increase as it redistributes but will then quickly decay away. The plasma may lose vertical position before or after the current quench [1, 2].
A distinction can be made between the different types of disruptions and they can be classified into two groups based on the order of the phases of the disruption. Vertical Displacement Events (VDEs) are characterized by a rapid change in vertical position before any loss of stored energy. The eventual effect is that the plasma becomes limited at the top or bottom of the tokamak and the current and energy from the plasma is deposited in the region of contact. Halo currents are formed from the contact of the plasma with the wall. These currents are located outside the last closed flux surface of the dying plasma and intersect with the first wall, resulting in currents in the structures of the tokamak. As the plasma moves toward the wall, more and more current is forced into the halo and therefore into the wall of the vessel
[1, 2].
Non-VDE disruptions first undergo a loss of stored energy and the vertical motion begins as a result of that loss. As a result, the plasma is often cooler and has started its current quench before it becomes limited by the first wall. The current and energy deposited onto the wall is usually less than that of a VDE. However, non-VDEs can still be quite damaging to a inachine and are more difficult to detect than VDEs [1].
1.2
Gas Jet Mitigation of Disruptions
Due to the fact that some disruptions are unavoidable, it is necessary to develop methods of mitigating their damaging effects. One method currently in development on Alcator C-Mod and other machines involves the use of a high-pressure gas jet to send noble gas into a plasma to release thermal energy and reduce halo currents during a disruption. When the gas is injected into the plasma, stored thermal and magnetic energy is converted to radiation through collisions with the noble gas. This causes the plasma energy to be radiated isotropically and distributed evenly over the relatively large area of the interior of the vessel. The machine is no longer subject to destruction due to energy being deposited in only one place. Halo currents are also reduced if the gas jet terminates a plasma quickly enough that it has not had time to move into the first wall of the machine. The loss of thermal energy causes the resistivity of the plasma to increase therefore causing the plasma current to decay away more quickly. Tests have shown that when the jet is fired into a normally running plasma, a thermal quench starts about 4 ms after the gas jet is triggered. This should be fast enough to mitigate a typical disruption in C-Mod with a current quench on the order of 5 ms [3]. A gas jet has also been successful in mitigating VDEs on DIII-D [4, 5].
1.3
Effects of the Gas Jet on Stable Plasmas and
VDEs
The gas jet system has been tested on stable non-disrupting plasmas and VDEs. In the case of the stable plasmas, the gas jet was fired at a pre-programmed time and the halo current and divertor tile heating were measured. In unmitigated disruptions, the fraction of the thermal energy radiated is normally between 20% and 30%. When the gas jet is used, this fraction increases to between 50% and 80% depending on the type of noble gas used. Unmitigated disruptions have larger halo currents which are successfully reduced by 50% when the gas jet is used. The injection of the noble
gas increases the resistivity of the plasma and causes a faster current quench which decreases the creation of halo currents. In addition, there was no appreciable runaway electron creation. The gas jet appears to be effective at mitigating non-disruption
plasmas
[3].
The first real-time test of the gas jet on disrupting plasmas was during manufac-tured VDEs. The VDEs were created by either turning off the vertical control or ramping the elongation of the plasma. The jet was triggered when the error between the programmed vertical position and the real-time calculated vertical position of the plasma exceeded a pre-set threshold. The halo current was decreased about 25% and the radiated energy fraction increased from the unmitigated plasmas. The responses were not as good as with the tests with stable plasmas, but the disruption effects
were still mitigated in comparison with non-mitigated disruptions [6].
1.4
Problems Detecting Locked-mode Major
Dis-ruptions
While the gas jet has been fired during vertically stable plasmas and VDEs, there have not yet been any tests involving non-VDE disruptions. Testing the gas jet on a non-VDE disruption would be the next logical step. One type of non-VDE disruption
that can be created consistently in C-Mod is a locked-mode disruption. The difficulty
in testing the gas jet on this type of disruption is that the gas jet must be fired shortly after the locked-mode begins, and detecting the start of a locked mode in real time is not a trivial task. During a manufactured VDE, the Digital Plasma Control System
(DPCS) can be programmed to fire the gas jet once the plasma moves a certain set
distance from its central position. The DPCS already performs the calcuilation of the
error in the vertical position, so using that error as a trigger is fairly trivial. There
is no equivalent straight-forward triggering method for a locked-mode disrulI)tion on
1.4.1
Locked Modes
Locked modes are caused by MHD instabilities. These instabilities can theoretically be stabilized using a perfectly conducting wall. The actual resistive walls of a
toka-mak cannot completely stabilize these instabilities without rotation. If the plasma is
rotating with respect to the resistive wall, the wall could act to stabilize the instabili-ties the same as an ideal wall to a certain limit. In a non-rotating plasma, or a plasma whose rotation has slowed, the islands of instability would grow. The growing islands might not be a problem if a tokamak were perfectly toroidally symmetric. However, there are always small asymmetries due to imperfections in the vessel and coils which contribute to a background error field. When the instabilities grow large enough to interact and"lock" with these error fields, they can slow the plasma's rotation and often cause a disruption.
1.4.2
Asymmetry Detection Coils
A method of detecting locked modes is through the use of asymmetry detection coils. MHD instabilities cause asymmetries in the magnetic field which can indicate the existence of a locked mode. On other machines, the asymmetric detection coils can successfully pinpoint the start of a locked mode. On C-Mod, however, the complicated interplay between the coils causes variations in the background toroidal asymmetries that change on the order of the timescale of the shot. Because the instabilities due to the islands also vary on that timescale, they are difficult to distinguish from the background instabilities. A locked-mode detection program using the asymmetries as a basis may not be a completely reliable way to determine if a locked mode has occurred in C-Mod.
Chapter 2
Locked-mode Detection Procedure
An alternative method of detecting a locked mode involves the use of the electron cyclotron emission signal (ECE). It has been empirically observed that the
normally-occurring sawteeth in the ECE signal are suppressed during a locked mode. If the
transition point in the ECE signal where the sawteeth are suppressed can be identified
in real-time, it could be used to define the start of a locked mode and trigger the firing of the gas jet. While a complicated signal-pattern recognition program or perhaps a neural network could be used to determine this transition point, a more direct approach involving simple standard deviations has been developed motivated by the computational and time constraints of the DPCS.
2.1
Drawbacks of a Neural Network
Neural networks can be useful tools for analyzing complex signals once trained with a sample set of signals. However, a major limitation of a neural network is that it cannot properly analyze a signal which has parameters that fall outside the characteristics of the training set. On C-Mod, a neural network would need to be re-trained if any specific aspect of a shot changed, such as the shot length or the magnitude of the current.
A neural network also does not lend any insight into the characteristics of a signal. It may be able to correctly classify signals, but the reasons behind that classification
are not necessarily clear. As a locked mode detection method, a neural net would correctly identify the start of a locked mode, but it would not give any reason as to what indicated that start. Because of these drawbacks, a method using flexible, well-understood tests based on the standard deviation of the ECE signal has been used instead.
2.2
Electron Cyclotron Emission Signal and
Saw-teeth
The electron cyclotron emissions (ECE) signal is primarily used to determine the electron temperature of the plasma. Electrons in a plasma rotate around field lines
at the cyclotron frequency w = eB and radiate at that frequency and at each of
its harmonics. Because the plasma behaves as a black-body radiator to the second harmonic, the intensity of that frequency is a well-defined function of the electron temperature. If the ECE diagnostic is used to measure the intensity of the second harmonic of the cyclotron frequency due to the central magnetic field, it can be used to determine the temperature at the plasma center.
Sawtooth oscillations are a common occurrence in tokamaks due to natural MHD instabilities within the q=1 surface. The sawtooth oscillations affect the central electron temperature and are therefore also present in the ECE signal. Because sawteeth occur in nearly all of C-Mod's plasmas, a locked-mode detector focusing on the changes in sawteeth could be useful.
2.3
Digital Plasma Control System
The digital plasma control system (DPCS) is used to control the plasma during a shot. It takes real-time data from up to 128 channels of diagnostics and calculates plasma
parameters., such as position, based on those diagnostics within a 100 ,ps cycle. It
then makes feedback adjustments based on the differences between those calculations
1060210003
0.0 0.5 1.0 1.5 2.0
(a) ECE signal showing sawteeth
1060317013
0.5 1.0 1.5 7.0
(c) ECE signal with locked-mode
Figure 2-1: Examples of ECE signals
3.0 2.5 2.0 1.5 1.0 0.7 0.0 '2 0.74 0.76 0.78 (b) Close-up of Sawteeth 1060317013 0.80 0.82 0.72 0.74 0.76 0.78 0.80 0.82
(d) Close-up of locked-mode starting at 0.77 seconds with and without locked modes
' ' ' ' ' ' ' ' ''''''''"
~i~vJw~ ···---
·---
···-·
;
~~~'~~~'~~~'~~~'~
1060210003MDSPlus and records the outputs to MDSPlus as well. Although the update cycle rate is 10 kHz, the full 100 ps of each cycle are not used for computation and I/O.
About 10 ps of each cycle are available for the locked-mode detection procedure [7].
2.4
Three Locked-mode Detection Tests
After extensive offline testing using 1,200 shots from the 2006 run campaign, three tests have been developed and optimized to locate the transition point in the ECE signal for the purpose of finding locked modes.
2.4.1
Test 1: Normalized Standard Deviation Test
The primary test relies on the assumption that the only variation in the ECE signal
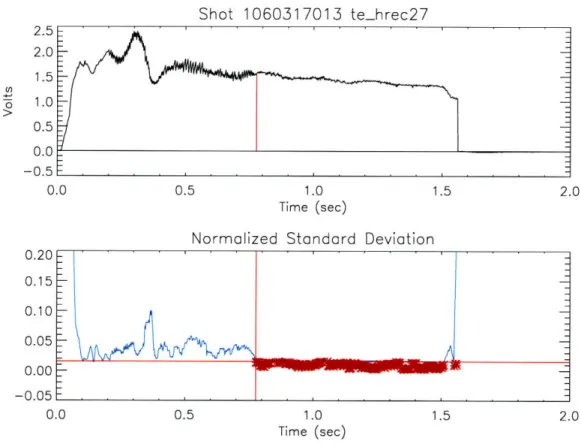
over a certain time window would be from the sawteeth and that this variation would remain generally consistent from one time window to the next. If these assumptions are valid, then the amplitude of the sawteeth could be represented using a standard deviation of the signal over the time window and it would be expected that this stan-dard deviation would not vary significantly unless the amplitude of the sawteeth were to change. When the sawteeth are suppressed due to a locked mode, the amplitude of the sawteeth would decrease and as a result the standard deviation should decrease as well. A locked mode is detected when this standard deviation drops below a certain threshold.
Because the amplitude of the sawteeth tends to vary directly with the amplitude
of the ECE signal, it is prudent to normalize the standard deviation by the mean of
the signal in the time window. This normalization is also useful to prevent the need for absolute conversions as the ECE signal is sent to the DPCS as a pure voltage and is not converted to the standard temperature units. The normalized standard deviation threshold was determined to be 1.2Y% over a 6 ms time-window based on testing over the 2006 shot set. When the time window is increased or decreased by 2 mis. there is a 20% decrease in the accuracy of the procedure. The accuracy is also sensitive to chalnges in the threshold of the normalized standard deviation. There is
a 5% difference in accuracy if the threshold is changed by 0.1%. 2.5 2.0 1.5 1.0 0.5 0.0 -0.5 0.0 0.20 0.15 0.10 0.05 0.00 -0.05 0.0 Shot 1060317013 te_hrec27 0.5 1.0 1.5 Time (sec)
Normalized Standard Deviation
0.5 1.0 1.5
Time (sec)
Figure 2-2: Shot 1060317013 showing the normalized standard deviation test. The vertical red line shows where the locked mode has been located.
The horizontal red line marks the normalized standard deviation threshold.
The red stars indicate where the normalized standard deviation has dropped below the threshold and passed the first test.
2.4.2
Test 2: Relative Standard Deviation Test
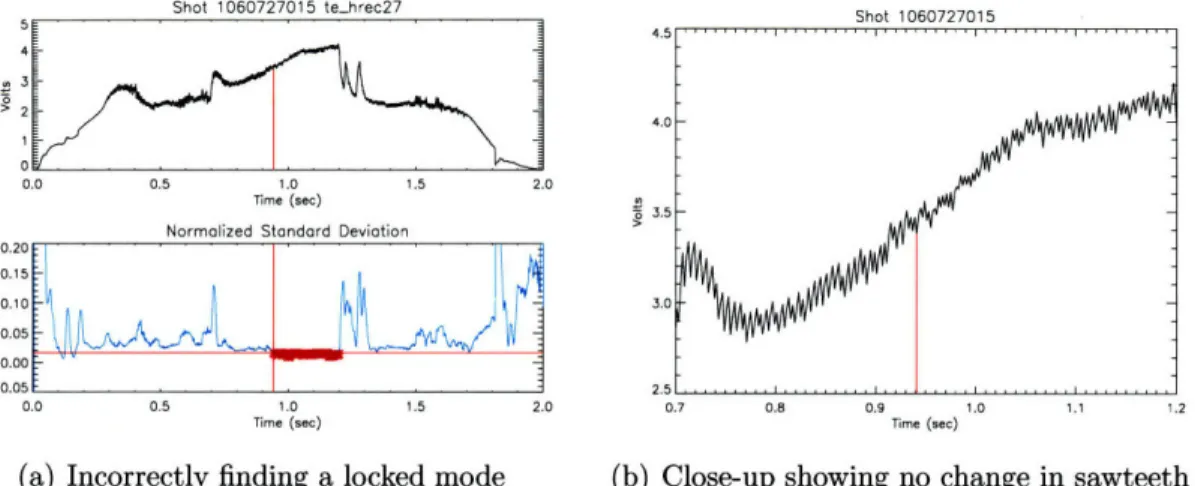
The first test alone is not reliable enough to determine locked modes in real time. The test only had a 65% accuracy when tested over the 2006 shot set. This lack of accuracy is due to the limitations of using a test of only the normalized standard deviation. In some cases, the amplitude of the sawteeth is initially not very large and it remains relatively small throughout the shot. As shown in Figure 2-3, the signal passes the normalized standard deviation test when a locked mode is not present. There also may be temporary dips in the strength of the ECE signal, not related to locked modes, which would have an affect on the standard deviation.
Shot 1060727015 tehrec27 Shot 1060727015 - · E 4 >2 0.0 0.5 1.0 1.5 2.0 Time (sec)
Normalized Standard Deviation
0.20 0.15 0.00 -0.05 0.0 0.5 1.0 1.5 2.0 Time (sec)
(a) Incorrectly finding a locked mode
0.7 0.8 0.9 1.0 1.1 1.2
Time (sec)
(b) Close-up showing no change in sawteeth
Figure 2-3: Shot 1060727015 showing the failure of the first test
A second test was added to prevent the false positives due to small sawtooth amplitude. This test is shown in Figure 2-4. The test compares the standard deviation of the current time window to the standard deviation calculated 40 ms earlier. There must be at least a 50% decrease in the standard deviation in order to pass the test. Changing the threshold percentage by 10% gives a 2% change in accuracy and varying time difference between the current and previous values by 2 ms gives a 3% difference in accuracy. Thorough testing with different values demonstrated that 50% and 40 ms are the optimum values for the thresholds for the second test. Because the test looks for an absolute decrease in the amplitude of the sawteeth, the standard deviation is not normalized before the comparison. The addition of this test improved the accuracy of the procedure over the 2006 shot set from 65% to 69%.
It is important to note that the first and second tests rarely passed at the exact same iteration point during testing. To allow for a locked mode to be properly discovered, the procedure will retain a passed state for 60 ms after the ECE signal passes the second test. If the first test also passes within that 60 ms window, then a locked mode is declared.
2.4.3
Test 3: Mean Test
In some cases the ECE signal will undergo an unexpectedly rapid change unrelated to the changes due to sawteeth. This rapid change affects the standard deviation and
Shot 1060727015 te_hrec27
0.5 1.0
Time (sec) (a) The ECE signal for shot 1(
Relative Standard Deviation
1.5 2.0 -0.
-00 0 1.0 1.5 20
)60727015 (b) The two tests showing a locked-mode is not found
Figure 2-4: The second test prevents the false positive from occurring The blue stars show where the second test passes.
can be incorrectly interpreted as a change in the amplitude of the sawteeth. This signal change can cause both the first test and the second test to give false positives. A third test is therefore necessary to prevent the confusion between the changes in the mean of the signal and the changes in the sawtooth amplitude.
zst, 1 ~0C 3 1 nn7 t hrIn 7 Normalized Standard Deviation
0.0 0.5 1.0 1.5 Time (sec)
(a) The ECE signal for shot 1060321007 (b) Failure of the two tests
Figure 2-5: The first two tests are not enough to prevent a false positive. The test takes the mean of the signal calculated in the current time window and compares it to the mean calculated 40 ms earlier. Unlike the previous two tests, the mean test should give a negative result for a locked mode to be found. If there is more than a 13% change in the mean of the signal, a "block" is placed on declaring a locked mode. As with the second test, the procedure will retain this "blocked" state for 50 ms before the procedure is allowed to find a locked mode again. Changing
16~ Normalized Standard Deviation
0.2 0.1 0.0 1.0 JIIVI , 1,,,/, I • I e -I cII fI 0.10 O.l0 0.00 0.0 0.5 1.5 2.0
the percentage change in the mean by 1% gives a 1% variation in the accuracy of the procedure and changing the earlier time by 10 ms gives a 1.5% change in the accuracy. 13% and 50 ms were determined to be the optimum values for the final test. The third test in conjunction with the first test improves the accuracy to 87%, and all three tests together give the procedure a 90% accuracy over the 2006 shot set.
Shot 1060321007 te_hrec27 020 Normalized Stndard Dition
0.0 0.5 1.0 1.5 2
Time (sec)
(a) The ECE signal for shot 1060321007
0.15 0.10 0.05 0.00 -0.05 o.o 0.5 1.0 1.5 2.0
Reolative Standard Deviatian
0.2 0.1 0.0 -0. 1 o.o 0.5 10 1.5 2.0 Relative Meaon 2 0 0 -1 • _--0.0 0.5 1.0 1.5 2.0
(b) The third test prevents the false positive.
Figure 2-6: Successful use of the three tests
2.4.4
Summary of Tests
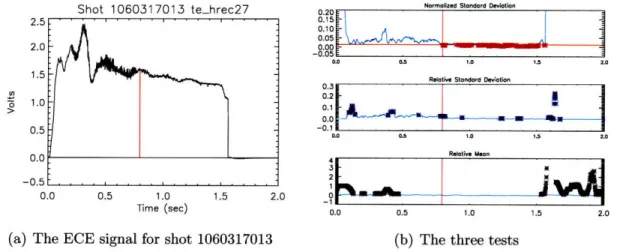
Figure 2-7 shows Shot 1060317013 with each of the three tests. The graph on the left is the ECE signal and the red vertical line shows the locked mode at 0.67 seconds.
Shot 1060317013 te_hrec27
Time (sec)
(a) The ECE signal for shot 1060317013
Norrmalzed Standard Deviation
0.20 0.15 0.10 0.05 0.00 -0.05 0.0 0.5 1.0 1.5 2.0
Relaotnve Stoandard DOevoiation
0.3 0.2 0.1 0.0 Relativ Meon 4 3 0.0 0.5 1.0 1.5 2.0 o
(b)
The three testsFigure 2-7: Summary of the three tests
The three graphs on the right show the three locked-mode tests. The top graph 0
shows the normalized standard deviation for each iteration of calculation. Each of the larger red points below the line show which calculated standard deviations fall below the threshold and therefore pass the first test.
The second graph shows which time windows pass the relative standard devia-tion test. The larger blue points show where the difference between the normalized standard deviation and the one 40 ms earlier is more than 50 percent.
The third graph on the right demonstrates the difference mean test. Each of the larger black points displays where the difference between the current mean and the one calculated 40 ms earlier is more than 13 percent.
A locked mode is found when the first test is passed during the intervals in which the second test gives the procedure a valid state and the third test gives it a negative state.
Chapter 3
Revisions of the Procedure
During the development of the procedure, it was clear that the normalized standard deviation test alone was not reliable enough for real-time usage regardless of the threshold used. The procedure underwent a number of revisions before the three tests described above were finalized.
3.1
Alternative Tests
3.1.1
False Positives due to the Rampdown
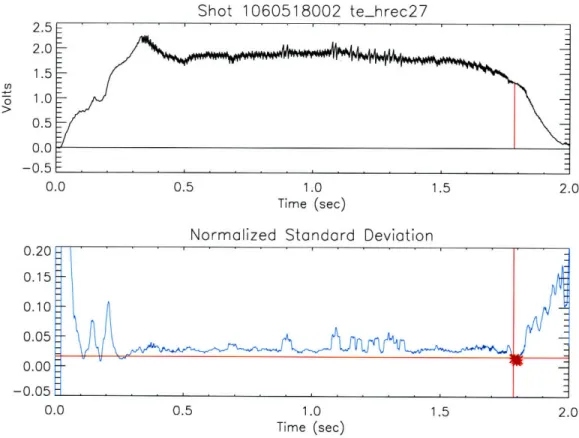
A major problem during early testing was that the procedure would find locked modes during the rampdown of the shot. Figure 3-1 shows shot 1060518002 with the procedure finding a locked mode at 1.79 seconds. Because the toroidal field is shutting down, the ECE signal, which is tuned to the second harmonic of the frequency expected at full field strength, would no longer give proper readings from the center of the plasma. The sawteeth and signal strength appear to decrease and the standard deviation would shrink and fall below the threshold. An early attempt to prevent this incorrect detection involved recognizing when the rampdown was occurring. The plasma current also decreases during the rampdown and the derivative of the Ip current signal could be used as an indicator for when the rampdown was starting. The first tests were done using derivatives calculated from the full Ip signal as recorded
in the MDSPlus database and the procedure very accurately discriminated between true locked modes and false ones due to the rampdown. However, once the procedure was rewritten in a mock real-time format, the derivatives needed to be calculated from small time windows and not from the full Ip signal. There was enough variation in the Ip signal within the small time window that the derivatives calculated were wildly inaccurate and could no longer be used to determine the time at which the rampdown began. A possible solution to this problem would involve using a significantly longer time window specifically for the Ip signal. This solution is described in Chapter 5.
Shot 1060518002 te_hrec27 2.5 2.0 1.5 1.0 0.5 0.0 -0.5 0.0 0.20 0.15 0.10 0.05 0.00 -0.05 0.0 0.5 1.0 1.5 Time (sec)
Normalized Standard Deviation
0.5 1.0 1.5
Time (sec)
Figure 3-1: False positive due to the rampdown
When the derivative check on the Ip current failed to work, the procedure was programmed to stop searching for locked modes based on the Ip Programming model used by the DPCS for the shot. Unfortunately, while the programming would indicate to the DPCS when the rampdown would begin, this would not necessarily correspond exactly to the start of the rampdown. The programming did not provide a reliable way to recognize the rampdown.
After the combination of the three tests in the current procedure were developed, the number of rampdown false positives decreased drastically. The rampdown caused enough of a change in the ECE signal that the mean test would fail and the procedure would not find a locked mode. Even though most rampdown false positives were avoided, the procedure is still currently programmed to stop searching for locked modes after 1.5 seconds just as a backup. This is not a permanent solution as the time length of the shot could be modified and future shots could have the rampdown starting multiple seconds later. In order to generalize the procedure to account for varying shot length, a check on the signal from the toroidal magnetic field could be used. This modification is described further in Chapter 5.
3.1.2
Stepped Normalized Standard Deviation Threshold
The normalized standard deviation test was modified at one point during the de-velopment of the procedure to use a time-dependent stepped threshold instead of a single value throughout the shot. This was supposed to prevent false positives in the beginning and rampdown of the shot by using a stricter threshold during those times. The stricter threshold did prevent false positives, but also kept true locked modes from discovery. There were no consistent start and end times for the flattop of the shot. Because of this, the stricter threshold would sometimes be applied incorrectly during the flattop for some shots and the more permissive one would be applied dur-ing the start and end of other shots. This inconsistency caused more failures than the stepped threshold corrected and the modification was eventually abandoned.
3.1.3
Repeated Normalized Standard Deviation Test
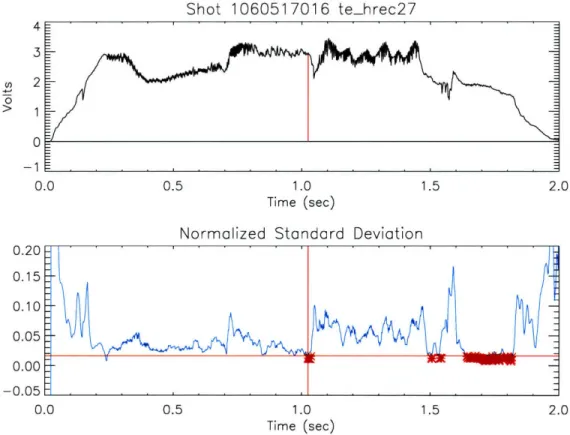
Before the relative threshold test was developed, a method of preventing temporary dips in the normalized standard deviation was explored. The test involved checking whether the standard deviation remained below threshold for multiple iterations. Figure 3-2 shows shot 1060517016 with a failure of the normalized standard deviation test due to a temporary dip in the signal at 1.02 seconds. Once a repetitive check is
introduced, the small dip is easily bypassed.
Shot 1060517016 te_hrec27
0.5 1.0 1.5
Time (sec)
Normalized Standard Deviation
1.0 Time (sec)
Figure 3-2: Figure 1060517016 showing a temporary "dip" in the deviation
normalized standard
Unfortunately, a significant delay was introduced into the detection procedure while the locked mode was verified through those multiple iterations. In the case of shot 1060517016, a delay of 50 ms is required to bypass the signal dip. The small percentage of false positives prevented by using this test did not make up for the significant delay in detection. It is possible that the repeat test would be useful in future versions of the procedure as it was not tested at the higher DPCS sampling rate. However, the relative standard deviation test and the mean test usually prevent most of the "dips" in the normalized standard deviation.
4 3 2 1 0 -1 0.0 0.20 0.15 0.10 0.05 0.00 -0.05 0..0
A
tx3.2
Conversion of the Procedure to the DPCS
For-mat
The original form of the IDL routine tested over the 2006 shot set could not be directly applied to the DPCS. It needed to be rewritten to conform to the DPCS format, to use the incoming signals and to be optimized for time.
3.2.1
Changes to the Off-line Version
The off-line version of the procedure read in a full signal stored in the MDSPlus tree and then divided the signal into smaller time slices to simulate analysis in real-time. The DPCS version needed to be able to read in the real-time ECE signal directly. First, the signal had to be physically connected to the DPCS. The signal output was split and optical fibers were used to carry the signal to where it was channeled into the DPCS. During each 100 [ts cycle of the DPCS, a new data point was read from the signal and immediately used in the calculations. The DPCS version also had a faster sampling rate of 10 kHz instead of 500 Hz. The thresholds had to be adjusted accordingly.
The DPCS format has four phases of operation and the procedure needed to be adapted to work with them. The first phase is the initiation phase. Any constants and arrays could be set during this phase before the shot started. The values programmed into MDSPlus and the channel location of the DPCS ECE signal are assigned at this point. The second phase is the real-time phase. Each of the smaller procedures making up the control sequence would be called to run over each iteration. While the off-line version implemented for-loops to move through the full ECE signal in smaller time-steps, the DPCS version had the calculations stored in a single function which would be called repeatedly during the shot. The third phase stored any saved values to the MDSPlus tree. In the case of the locked-mode detection procedure, it stored what the DPCS read in from the ECE signal, the calculated means and standard deviations, and in the case of the discovery of a locked mode. the time point at which
a locked mode was found. The fourth phase is the cleaning phase. All arrays and variables used during the procedure are cleared at this point to prevent memory leaks which would slow the process down for future shots. There was no need for a cleaning phase in the off-line version of the procedure because the speed of the procedure was unimportant and variables could be cleared at the end when exiting IDL.
3.2.2
Optimization of the Procedure
The real-time phase of the procedure was executed along with all the other control functions. Of the 100 As in a single iteration of the real-time phase, only 10 As were available for the locked mode procedure to run. The procedure had to undergo an optimization to fit within that time constraint.
The first part of the procedure that required revision was the standard deviation calculation. The IDL standard deviation routine calls a larger procedure, moment(), which calculates the mean, variance, skewness and kurtosis of an array. The locked mode procedure did not require most of those calculations and the extra time spent on them slowed down the procedure considerably. The unnecessary calculations were removed from the procedure by executing only the lines required to calculate the mean and standard deviation. The IDL routine also had lines of code dedicated to checking that the inputs followed certain requirements. The code made the routine robust for general use, but it slowed down the procedure for the real-time phase and was removed.
Time was also lost in shifting data in arrays. The first implementation for the DPCS used small arrays that only stored the last 70 ms of calculations for testing. Each iteration the procedure ran, the data would be shifted in the array and the new data would be added to the end. The smaller arrays were replaced by long arrays which had a slot for every iteration in the shot. The data no longer had to be moved in the array and the larger arrays were passed in the procedure using the IDL common block.
Another change made to the procedure involved minimizingo calculations during the real-time phIase. In some cases it takes less time to retrieve a value from memory
than it does to calculate it. Some calculations, such as the number of array elements to use in the standard deviation, would not change during the real-time phase and could be calculated prior to the loop. There were also some calculation results processed during the loop which would be called multiple times. An example of this is the starting index for the elements that would be used in the standard deviation. While the number of elements used was constant and calculated prior to the start of the loop, the starting index had to be calculated each iteration from the current index, which changed.
The off-line version of the procedure used extra conditionals to prevent locked modes from being detected in rampup and rampdown. The DCPS version of the procedure has the capability of running different parts of the real-time loop at different times during the shot. The procedure was programmed not to run calculations before 0.45 seconds into the shot and to stop searching for a locked mode after 1.5 seconds. Because this programming was controlled by the DPCS, the conditionals on the time could be removed from the real-time phase of the locked mode procedure.
Chapter 4
Real-time Testing of the Procedure
On August 30th, 2007 a real-time test was made of the locked-mode detection proce-dure with the gas jet hardware disconnected. The proceproce-dure was tested for robustness and accuracy without the plasma being affected by the results.
4.0.3
Successful Locked-mode Detection
Two shots, 1070830019 and 1070830020, had locked modes and the procedure suc-cessfully detected them. Figure 4-1 show the scopes of the real-time data from that day. The first plot is a direct reading of the FRC ECE channel #27, which reads in the second harmonic emission from the center of the plasma. The second plot shows the array of data that is read by the DPCS for calculations. The small offset, calculated more than 3 seconds before the current rampup, is subtracted from the ECE signal before the normalized standard deviation is calculated. The gap in the plots before 0.45 seconds shows where the procedure does not make any calculations as this is assumed to be during the breakdown. The third and fourth plots show the results of the signal mean calculation and the standard deviation. The final plot is the pulse sent to trigger the gas jet in the event a locked mode is found. In the case of shot 1070830019, a locked mode was found at 0.67 seconds.
Of the locked-mode shots that disrupted from the 2006 shot set, 70% had more thamn 100 mns between the start of a locked mode and the onset of the current, quench.
(a) Shot 1070830019 0450.45 Input 097 0.4 0.35 ... .... . 0.3 0.25 --- -- - --- -0.--- -5 - 1 1-5
o
i .... ... ..-... ... ... ... .. ....
0.2 FRC ECE #27 Values 0.15 ...0.1
Means Calculated... 0.15. at Each ,Time-Step Figure 4-1- Reltm sp ot lv
0.5
---
1.5
0.08 Standard Deviations.at 0.06. Each.Time Step 0.040.02
0U02 ... .1...1.. i. Gas Jet 2 (b) Shot 1070830020Half of those shots had more than 200 ms before the disruption. The real-time tests showed that the gas triggering pulse was given about 20 ms after the locked mode began. The gas jet needs only 100 ps to fire and a few milliseconds of time to reach the plasma. This would leave plenty of time for the mitigation of the effects of the disruption if the gas jet were to be fired into the plasma.
4.0.4
False Positive
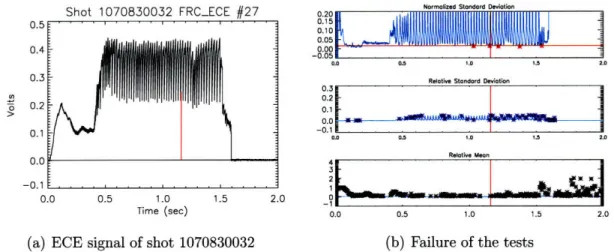
The remainder of the 16 shots that day did not have locked modes. The only false positive was shot 1070830032. Figure 4-2 shows the scope from that shot. The sawteeth have an unusually long period which is on a similar timescale to that of the time-window used to calculate the standard deviation. The procedure returned standard deviation values that were not consistent representations of the amplitude of the sawteeth. Because of this, the standard deviation values fulfilled the requirements of the tests even though the amplitude of the sawteeth did not change as a result of a locked mode. This problem could be avoided in the future if the time-window length could be increased in the event of a longer sawtooth period.
Shot 1070830032 RCECE #27 Shoti ,11II1IIIIII1IIIII Normolized Stondrd DeviotionIIIIII IIIIIIIIIIIIIItIIII
0.5k 0.4 0.3 0.2 0.10 0.05 0.00 -0.05 0.0 0.5 1.0 1. 2.0
Relotive Stondord Oeviotion
0.3 0.2 0.1 0.0 -0. 1 .o 0.5 1.0 15 2.0 R.elotiv. Meon 2 NJ.-l~j U.U U. 1.U l .1 L.U _1 - .. ... ... . . .. .. .
Time (sec) 0.0 0.5 1.0 1.5 2.0
(a) ECE signal of shot 1070830032 (b) Failure of the tests
Figure 4-2: False positive from shot 1070830032
4.0.5
DPCS Timing Problem
While the procedure was written to run in the available 10 ps of the DPCS cycle, it was uncertain whether this would be a satisfactory time in all shot circumstances.
I
0.1
0.0
There are no missed samples or loss of data when the machine runs properly and a full plasma is created. However, different procedures are run by the DPCS depending on the "health" of the plasma. In the event a plasma is not properly created, a "fizzle" procedure will run in place of the usual control sequences in order to safely shut down the machine. While there is no need to continue to run the locked-mode detection procedure when the "fizzle" procedure is running, the procedures had not been written to run exclusively of each other. The "fizzle" procedure run in conjunction with the locked-mode detection procedure exceeds the allotted 100 Ps allowed for a single cycle of the DPCS sequences. While this results in lost samples, no useful control data is taken during a "fizzle" so the lack of samples is not detrimental to the completion of the shot. This would be a serious problem if another procedure were needed during the run. A possible solution would be to run the extra testing procedures on a system parallel to the primary control system.
Chapter 5
Future Work
While the locked-mode detection program has proven reliable in detecting locked modes, it has not yet been tested with a running gas jet. The next step in testing would involve firing the gas jet on manufactured locked-mode disruptions using the detection procedure and determining the mitigation effects of the jet. Ideally, firing the gas jet at the appropriate time should help mitigate the thermal loading and halo current effects as compared to shots without the use of the locked-mode detection procedure.
The procedure is currently programmed with explicit start and end times to pre-vent locked-mode detection outside of the flattop region. If the length of the shot were to change, these times would no longer be valid. It would be possible to make the program more general by using the decreasing toroidal field as an indication of the start of the rampdown. The toroidal field signal is already sent to the DPCS and the procedure currently has commented lines of code which implement a check on the toroidal magnetic field. These lines were not used in the real-time test because they caused the procedure to exceed the 10 ps time allotment. If a system were used in parallel with the DPCS which allowed for more computation time, the toroidal field check could be implemented in a future version of the procedure.
An alternative to the decreasing toroidal field check would be to implement a proper check on the Ip signal. The current limitation to using an Ip derivative check is due to the very short time window used in real-time calculations. If a. longer Ip
time window could be used separate from the window used for the ECE signal, the derivative may be able to be calculated correctly. Further testing would be needed to determine if the longer time window introduces any delays in the locked-mode detection.
The current version of the procedure takes ECE data from a single channel which reads the second harmonic of the cyclotron frequency corresponding to the electron temperature at the center of the plasma only when the toroidal field is 5.4 T. If the machine were to run with a different magnetic field, that particular channel would no longer see the plasma center and may not even see sawteeth. A future version of the procedure could make use of many different channels which read in frequencies corresponding to different magnetic field strengths.
References
[1] R. S. Granetz, et al. "Disruptions and Halo Currents in Alcator C-Mod". Nuclear
Fusion, 36(5):545-556, 1996.
[2] ITER Physics Basis Expert Group on Disruptions, Plasma Control and MHD. "ITER Physics Basis". Nuclear Fusion, 39(12):2321-2336, 1999.
[3] R. S. Granetz, D. G. Whyte, and V. A. Izzo et al. "Gas jet disruption mitigation studies on Alcator C-Mod". Nuclear Fusion, 46:1001-1008, 2006.
[4] D. G. Whyte, et al. "Mitigation of Tokamak Disruptions Using High-Pressure Gas Injection". Physical Review Letters, 89(5):055001, July 29, 2002.
[5] R. S. Granetz, E. M. Hollmann, D. G. Whyte, et al. "Gas jet disruption mitigation studies on Alcator C-Mod and DIII-D". Nuclear Fusion, 47:1086-1091, 2007. [6] R. S. Granetz. "Real-time VDE mitigation with gas jet injection, and mixed
gas jets on Alcator C-Mod". In American Physical Society: Division of Plasma
Physics. 2006.
[7] J. A. Stillerman, M. Ferrara, T. W. Fredian, and S. M. Wolfe. "Digital real-time plasma control system for Alcator C-Mod". Fusion Engineering and Design, 81:1905-1910, 2006.
Appendix A
The following code is the off-line version of the locked-mode detector procedure writ-ten in IDL.
; Takes the ECE input from a shot and determines the ; normalized standard deviation,
; the difference between the standard deviation and ; the value 40 ms earlier,
; and the difference in means whether a locked mode occurs ; /debug allows for the program to stop before the end ; /op gives extra over-plots for debugging purposes
pro check_ece,shot,op=op,debug=debug
if (n_params() It 1) then begin
print,'Did you specify a shotname?'
print,'Usage: check_ece,shotname[,/op,/debug]' endif else begin
; DEFINING THE VARIABLES
; The subsampled signal has about 500 samples in a 20ms range
tstepe=60 tthr=0.5 tthr2=1.99 tstart=-0.1 tend=2.01 btorthr=5 devthr=0.012 relthr=0.5 lcthr=l
number of steps in sample
time threshold before which locked-modes are ignored time threshold after which locked-modes are ignored the earliest time in the signal (for subsampling) the latest time in the signal (for subsampling)
the threshold below which the program shouldn't look for sawteeth
the threshold of the absolute normalized standard deviation
the relative percent decrease in non-normalized standard deviations
rcthr=600 mcthr=500 emthr=0.13 devc=400 emean=l1 devpre=0 premean=1
normalized standard deviation is below the threshold the number of iterations before the relthr flag becomes
invalid
the number of iterations before the mean thresh allows for flags again
the normalized threshold difference beyond which diffmean is too great
the number of iterations back for the premean and predev always 1, the orig setting for emean
always 0, the orig setting for devpre always 1, the orig setting for premean ; State variables
lcount=0 ; always zero,
rcount=0 ; always zero,
mcount=O ; always zero,
x=1 ; state number,
y=O ; state number,
yy=1 ; state number,
xx=O ; state number,
bb=l ; state number,
the repeat count start the relthr count start the mcthr count start
starts at 1 starts at 0 starts at 1 starts at 0 starts at 1 ; Collecting the ECE signals
if (shot gt 1000000000) then begin
shottxt=string(shot, format='(ilO)') endif else begin
shottxt=string(shot, format='(i9)') endelse
print,shottxt
mdsopen,'cmod',1070405008,/quiet,status=status
; Input_001 is not used for analysis
; this part is simply to subsample the ece signal to simulate ; how the signal would act if it were read in directly by the dpcs
input00l=mdsvalue('dim_of(\hybrid::top.hardware.dpcs:dpcs2.signals $ :input_001)',/quiet,status=status) ipst=where(inputO01 gt tstart) ipst=ipst(0) ipen=where(inputO01 gt tend) ipen=ipen(0) nsamp=ipen-ipst+1 input2=fltarr(nsamp)
input001=input2
mdsclose
mdsopen,'cmod',shot,/quiet,status=status
; If the ECE signals aren't found, z or zz will be set to zero z=1 zz=1 ecesigl=mdsvalue('\te_hrece27',/quiet,status=status) statusl=status ecesigtl=mdsvalue('dim_of(\te_hrece27)',/quiet,status=status) status2=status val=10
if (statusl le 10000 or status2 le 10000) then begin dummy=min(abs(ecesigtl-0.5),vali)
; determine if the te_hrec27 signal is strong enough and finite ;at about 0.5 seconds otherwise default to gpc signal
val=ecesigl(vali)
if (~ finite(val)) then val=O endif
if (statusl gt 10000 or status2 gt 10000 or val lt 0.4) then begin
print,'defaulting to gpc signal'
mdstcl,'set def \electrons::top.gpc_2.results' ecesigl=mdsvalue('gpc2_teO',/quiet,status=status) statusl=status
ecesigtl=mdsvalue('dim_of(gpc2_te0)',/quiet,status=status) status2=status
val=10
if (statusl le 10000 or status2 le 10000) then begin dummy=min(abs(ecesigtl-0.5),vali)
; check that the gpc signal is there and strong enough val=ecesigl(vali)
if (~finite(val)) then val=O endif
endif
if (statusl It 10000 and status2 It 10000 and val gt 0.4) then begin
btortl=mdsvalue( dim_of(\magnetics::btor)',status=status) ; Using the inputO01 signal we can get the
; ECE signal and the Btor signal ; in the same sampling rate
indices=lonarr(nsamp) indices2=lonarr(nsamp) for h=O, nsamp-1 do begin
dummy=min(abs(ecesigtl-input00[h]), mki) dummy=min(abs(btortl-input001[h]), mki2) indices[h]=mki indices2[h]=mki2 endfor ecesigt=ecesigtl(indices) ecesig=ecesigl(indices) btort=btortl(indices2) btor=btorl(indices2) plot,ecesigt,ecesig,title=shottxt ; The program uses a window instead of ; the full array. Before looping, this ; window is set up.
nel=n_elements(ecesigt) ece_short=fltarr(tstepe) ecet_short=fltarr(tstepe) for i=O,tstepe-1 do begin ece_short(i)=ecesig(i) ecet_short(i)=ecesigt(i) endfor
; Each of these is an array to store the results over
; each iteration. The actual program may not store all of these. emeans=fltarr(nel) tsteps=fltarr(nel) devs=fltarr(nel) diffdevs=fltarr(nel) puredevs=fltarr(nel) diffmeans=fltarr(nel)
; This is the loop that will go through each of the timeslices ; looking for locked-modes
pos=O
while (pos It nel) do begin
; There are numerous plot statements used for evaluation ; The plots are only created when the /op flag is used
if (keyword_set(op)) then oplot,ecet_short,ece_short,color=200
; Calculate the normalized standard deviation, ; the pure standard deviation,
; and the mean of the timepoints in the window
puredev=stddev(ece_short) emean=mean(ece_short) dev=puredev/emean
; If the timestep moves beyond the end of the pulse, ; stop looking for locked modes
if (ecet_short(tstepe-1) gt tthr2) then x=O
; Don't look for locked modes after the tthr ; if the signal drops to almost zero
(signifies disruption or the end of the pulse)
if (ecet_short(tstepe-1) gt tthr and emean lt 0.01) then x=O
; If the puredev drops to less than relthr % of the
; previous puredev then allow for locked-modes to be flagged ; for rcount iterations
if (puredev It relthr*devpre) then begin rcount=rcthr
xx=1 endif
; If the normalized difference between the current mean ; and the previous mean is greater than emthr % then ; prevent locked-mode flagging for mcount iterations if (abs((premean-emean)/emean) gt emthr) then begin
mcount=mcthr yy=0
endif
; If the time is over tthr sec, change btorthr to the value at tthr minus 0.1
if (ecet_short(tstepe-1) gt tthr and bb eq 1) then begin btorthr=btor(pos)-.1
endif
; If the time is between tthr and tthr2, ; the signal has not gone to zero,
; the absolute normalized standard deviation has ; dropped below devthr,
; the signal is allowed by the relative deviation check, ; the signal is not blocked by the difference mean check, ; the btor has not dropped below the threshold (prevents ; flagging rampdown)
; and you haven't fallen asleep reading this, ; then flag for locked-mode
if (x eq 1 and dev It devthr and ecet_short(tstepe-1) gt tthr $
and xx eq 1 and yy eq 1 and btor(pos) gt btorthr) then begin lcount=lcount+l
endif else begin
; In order to improve accuracy, it may be useful to have the ; absolute standard deviation remain below the threshold for ; multiple iterations. The iteration count is reset if the ; conditions are not met.
lcount=O endelse
; To allow for the relative threshold check and the ; difference mean check to "time out" the rcount and ; mcount are decreased by one during each iteration rcount=rcount-1
if (rcount It 1) then xx=O mcount=mcount-1
if (mcount lt 1) then yy=1
; x is set to 1 if all of the above conditions are met ; if lcthr is more than one, this would be a check that ; the threshold were met for multiple iterations
if (x eq 1 and lcount ge lcthr) then begin print,'Locked mode at',ecetshort(tstepe-1) x=O
final=tstepe+pos endif
; The values are stored after each iteration emeans(pos)=emean
tsteps(pos)=ecetshort(tstepe-1) devs(pos)=dev
puredevs(pos)=puredev
diffmeans(pos)=abs((emean - premean)/emean)
; The previous values for mean and puredev are recorded ; for the next iteration
devpre=O
if (pos gt devc) then begin devpre=puredevs[pos-devc] premean=emeans(pos-devc) endif else begin
devpre=O emean=1 endelse
; The index is incremented
pos=pos+l
; The time window is shifted by one, and the new value is added to the end
ece_short=shift(ece_short,-1) ecet_short=shift(ecet_short,-1)
if (tstepe+pos It nel) then begin
ece_short(tstepe-l)=ecesig(tstepe+pos) ecet_short(tstepe-l)=ecesigt(tstepe+pos) endif
endwhile
endif else begin
; In the event that no ECE signal is found, ; the program will not continue through any ; of the threshold checks
print,'status error' z=O
endelse
mdsclose
; A number of plots to show the locked-mode time at the ECE signal if (z eq 1) then oplot,[0,2],[O,0]
if (keyword_set(final)) then begin
oplot,[ecesigt(final),ecesigt(final)],[0,ecesig(final)],color=200 endif else begin
if (z eq 1) then begin
xyouts,250,330,'No locked mode found',/device,color=200,charsize=2 endif
print,'No locked mode found' endelse
; More plots used for debugging
; Save yourself some time and don't bother reading through them if (z eq 1 and keyword_set(op)) then begin
red=where(devs lt devthr and tsteps gt tthr) gre=where(devs ge devthr or tsteps It tthr) blu=where(puredevs lt diffdevs) lb=where(puredevs gt diffdevs) blum=where(diffmeans gt emthr) lbm=where(diffmeans It emthr) btl=where(btor gt btorthr) bt2=where(btor lt btorthr) if red[O] eq -1 then red=[0,0] if gre[O] eq -1 then gre=[0,0]
if blu[O] eq -1 then blu=[O,01
if lb[0] eq -1 then lb=[0,0]
if blum[O] eq -1 then blum=[0,01 if lbm[O] eq -1 then lbm=[0,0] oplot,tsteps,emeans,color=080 oplot,tsteps(gre),devs(gre)*10,psym=3,color=080 oplot,tsteps(red),devs(red)*10,psym=2,color=200 oplot,tsteps(blu),diffdevs(blu)*10+0.5,psym=2,color=100 oplot,tsteps(lb),diffdevs(lb)*10+0.5,psym=3,color=080 oplot,tsteps(blum),diffmeans(blum)-0.5,psym=3 oplot,tsteps(lbm),diffmeans(lbm)-0.5,psym=3,color=080 oplot,[0,2],[devthr*10,devthr*10],color=200 oplot,tsteps(btl),emeans(btl),psym=3 endif
; To prevent the variables from being cleared for debugging
if (keywordset(debug)) then begin stop
endif endelse end
Appendix B
The following code is the real-time version of the locked-mode detector procedure used within the DPCS.
pro dpcs_check_lock,flag
; Version: $Revision: 1.7 $ Dated: $Date: 2007/08/24 19:30:31 $
; This first part is the code that is run during each iteration ; of the DPCS cycle
common dpcs_realtime_counters,index,itime,iO,jswitch,step,real-step common dpcs_realtime_vars,x,y,yl,y2,y2_last,z,p,q,U,v,w
; x is the floating array of the inputs, fltarr(nInputs) ; To get the ECE signal, use x[idxECE]
; Pass static parameters and local values in through private commons common dpcs_check_lock_cmn,ece_sig,ece_meanece_stdev,nsteps,btor_thr, $ bt_tol,presteps,relthr,rcthr,rcount,mcthr,mcount, $ emthr,devthr,lock_found,lock_pointers_to_clean,lockpath, $ wire_idx,trig_height,trig_steps, $ jet_triggered,trigcount,nstepsminus,nstepsplus common dpcs-check_lockparamscmn,idxECE,idxBtor,idxJetTrig
; ece_sig is local array of ece values vs time, accumulated
if flag eq 0 then return
; If flag isn't null, accumulate ece data
ecesig[step] = x[idxECE] ; store the current slice in the ece array
; calculate the mean and standard deviation for each timeslice stepback=step-nstepsplus
emean=total(ece_sig[stepback:step])/nsteps resid=ecesig[stepback:step]-emean resid2=resid^2 total2=total(resid2) var=(total2-total2/nsteps)/(nstepsminus) ecemean[step] =emean estdev=sqrt(var) ecestdev[step]=estdev aemean = abs(emean) > .000001 dev=estdev/aemean
if flag ge 2 then begin
; The flag ge 2 corresponds with the flattop ; currenlty after 0.45 seconds.
; At this point the data is tested for a locked mode.
; This sets the threshold on B-toroidal if (btorthr eq 0) then begin
btor_thr = abs(x[idxBtor]) - bttol endif
; Define the index (currently 40ms earlier) ; and recall the earlier standard deviations preidx=step-presteps
predev=ecestdev[preidx] diffdev=relthr*predev
; The relative threshold test if (estdev It diffdev) then begin
rcount=rcthr endif
; The mean test
premean=ecemean[preidx]
diffmean=abs(premean-emean)/aemean if (diffmean gt emthr) then begin
mcount=mcthr endif
; Check the two previous tests, the normalized standard deviation test ; and do a check on B-toroidal
; If a locked mode has been found, jettriggered is set to 1
if (dev It devthr and rcount gt 0 and mcount lt 1 and abs(x[idxBtor]) $
gt btor_thr && (lock_found It 0)) then begin lock_found=step
jettriggered=1 endif
; Decrease the timeout counters
rcount--
mcount--; Instead of just firing the gas jet at one time point, ; the signal is sent for a few iterations
if jettriggered && (trigcount le trigsteps) then begin U[idxJetTrigl=trig_height trigcount++ endif endif return end pro dpcscheck_lock_clean ;+
DPCS_CHECK_LOCK_CLEAN frees the parameter pointers
; and sets the rather long arrays to integers of zero
Revisions:
06-Aug-2007 Created /sma
common dpcs check_lock_cmn,ecesig,ecemean,ece-stdev,nsteps, $ btorthr,bttol,presteps,relthr,rcthr,rcount,mcthr,mcount, $ emthr,devthr,lockfound,lock_pointers_toclean,lockpath, $ wire_idx,trigheight,trigsteps, $ jettriggered,trigcount,nstepsminus,nstepsplus heapfree,lockpointers_toclean ecesig = 0 ece-mean = 0 ece stdev = 0 return end pro dpcs_check_lock_store ;+
; DPCS_CHECK_LOCKSTORE stores the three arrays
; ecesig, ecemean, and ece_stdev as well as ; lock_found (the step of the locked mode) and