UNIVERSITÉ DE SHERBROOKE Faculté de génie
Département de génie chimique et génie biotechnologique
BIOVALORISATION DU PETIT LAIT EN
2,3-BUTANEDIOL PAR FERMENTATION
____________________________________________
Biovalorization of whey into 2,3-butanediol by
fermentation
Thèse de doctorat
Spécialité : Génie Chimique
David FERNÁNDEZ GUTIERREZ
Jury: Pr. Michèle HEITZ – Université de Sherbrooke (Directrice)
Pr. Anne GIROIR FENDLER – Université Claude Bernard Lyon 1 (Co-directrice) Pr. Nathalie FAUCHEUX – Université de Sherbrooke (Co-directrice)
Dr. Antonio ÁVALOS RAMÍREZ - Centre National en Électrochimie et en Technologie Environnementales, Shawinigan (Co-directeur)
Pr. Bernard MARCOS – Université de Sherbrooke (Rapporteur) Pr. Luc MALHAUTIER – IMT Mines Alès (Évaluateur externe)
Pr. José Luis VALVERDE PALOMINO – Universidad de Castilla La Mancha, Ciudad Real (Évaluateur externe)
Dr. Claude DESCORME – Université Claude Bernard Lyon 1 (Évaluateur externe)
i
RÉSUMÉ
Le lactosérum est un résidu liquide obtenu lors de la fermentation du fromage. Il est composé de lactose, de protéines, etc. Étant donné les valeurs élevées de ses demandes biologique (DBO) et chimique (DCO) en oxygène, il est nécessaire de traiter le lactosérum avant de le rejeter. La valorisation du lactosérum par voie biotechnologique devrait permettre a) de réduire la DBO et la DCO et b) de générer des produits tels que le 2,3-butanediol (2,3-BD). Des bactéries comme Enterobacter cloacae et Klebsiella pneumoniae peuvent hydrolyser et transformer des saccharides (ex. lactose) en 2,3-BD. Ces bactéries quoique pathogènes sont considérées comme étant les plus performantes pour générer du 2,3-BD. Par conséquent, l‘utilisation d‘autres souches bactériennes non pathogènes permettant l‘hydrolyse et la fermentation des saccharides est recherchée. Dans ce contexte, une souche bactérienne non pathogène d‘Escherichia coli capable d‘hydrolyser et de fermenter une large variété de saccharides pourrait être une bonne option. Cependant, la souche E. coli ne produit pas de 2,3-BD. Une modification génétique d‘E. coli a été effectuée afin de transférer la voie métabolique d‘un producteur naturel de 2,3 BD à savoir l‘E. cloacae. Par conséquent, l‘objectif principal de cette étude est de valoriser le lactose (un disaccharide) contenu dans le lactosérum par fermentation en présence d‘une souche génétiquement modifiée d‘E. coli, afin d‘obtenir du 2,3-BD. Un perméat de lactosérum a également été utilisé comme substrat. Dans un premier temps, une étude portant sur la valorisation potentielle du lactosérum en 2,3-BD a été réalisée. Les différentes bactéries et substrats utilisés pour produire du 2,3-BD sous différentes conditions opératoires sont détaillés. Dans un deuxième temps, la souche d‘E. coli (E. coli JFR12) a été utilisée en variant la nature et la concentration du substrat dans le milieu de culture M9 (préalablement choisi comme le plus approprié parmi 4 milieux de culture). Le rendement en 2,3-BD le plus élevé (environ 0.36 g 2,3-BD/g saccharide) a été obtenu en présence de 25 g/L de glucose ou de lactose. Quelle que soit la concentration de galactose, les rendements en 2,3-BD étaient faibles. En présence du mélange glucose-galactose, les rendements en 2,3-BD obtenus étaient similaires à ceux obtenus avec le galactose. Ensuite, des mélanges de lactosérum ou de perméat de lactosérum ont été réalisés. Les fermentations de ces mélanges en absence de M9 améliorent le rendement en BD jusqu‘à 0.43 et 0.42 g 2,3-BD/g lactose en utilisant du lactosérum ou du perméat de lactosérum respectivement pendant 72 h. Finalement, l‘effet des trois paramètres suivants (quantité d‘inoculum, pH initial et vitesse d‘agitation) ont été évalués. Les rendements en 2,3-BD les plus élevés ont été respectivement de 0.47 et de 0.44 g 2,3-BD/g lactose pendant 72 h en utilisant du lactosérum ou du perméat de lactosérum respectivement. Enfin, l‘augmentation du volume réactionnel en utilisant un bioréacteur de 2 L pour la fermentation du lactosérum et du perméat de lactosérum a été testée en condition anaérobie. Les rendements en 2,3-BD ont été plus faibles par comparaison avec ceux obtenus à partir des expériences réalisées dans des fioles de 0.5 L. L'ajout d'air (2 L/min) dans le bioréacteur a été testé afin d'étudier son impact. Le rendement en 2,3-BD a été de 0.40 g 2,3-BD/g de lactose en 24 h. Le temps de fermentation a également été réduit de 72 h à 24 h. La souche E. coli JFR12 est appropriée pour valoriser le lactosérum et le perméat de lactosérum en 2,3-BD.
Mots-clefs: Escherichia coli, 2,3-butanediol, glucose, lactose, lactosérum, perméat de
ii
ABSTRACT
Whey is a dairy effluent generated during the cheese manufacturing. It contains lactose (the main part of the dry matter of whey), proteins, etc. Due to its high biological (BOD) and chemical (COD) oxygen demands, it is necessary to treat the whey before releasing it in the environment. The valorization of whey via biotechnology will have to allow for a) a decrease of the BOD and COD values, and b) of a generation of products like 2,3-butanediol (2,3-BD). Bacteria like Enterobacter cloacae and Klebsiella pneumoniae are able to hydrolyze and transform saccharides like lactose into 2,3-BD. Although these bacteria are pathogenic, they are considered as the best 2,3-BD producers. Therefore, the use of other non-pathogenic bacterial strains is being developed for the hydrolysis and the fermentation of saccharides. In this way, a non-pathogenic strain of Escherichia coli able to hydrolyze and ferment a wide range of saccharides would be a good option. However, E. coli cannot produce 2,3-BD. A genetic modification in the E. coli strain has been performed in order to transfer the metabolic pathway from a natural 2,3-BD producer: E. cloacae. In this way, the main objective of this research is to valorize the lactose (a disaccharide) contained in the whey via fermentation in the presence of a genetically modified strain of E. coli K12 MG1655 in order to obtain 2,3-BD. Permeate whey, was also used as a substrate. Firstly, a literature review about the potential valorization of whey into 2,3-BD was performed to show the different kinds of bacteria and substrates used to produce 2,3-BD under different operating conditions. Secondly, the E. coli strain (E. coli JFR12) was used varying the substrate nature and concentration in M9 culture medium (previously chosen as the most appropriate among 4 culture media). The highest 2,3-BD yield (around 0.36 g 2,3-BD/g saccharide) was obtained in the presence of 25 g/L of glucose and lactose. Whatever galactose concentration used, low 2,3-BD yields were obtained. In the presence of a mixture of glucose-galactose (1:1, w/w), the 2,3-BD yields were similar to those obtained using galactose as a sole carbon source. Afterwards, three mixtures of whey or permeate whey in the presence or absence of M9 culture medium were used. Fermentations of these mixtures in absence of M9 improved the 2,3-BD yield up to 0.43 and 0.42 g 2,3-BD/g lactose for 72 h using whey and permeate whey, respectively. Thirdly, the effect of three operating conditions (inoculum size, initial pH and agitation rate) was evaluated. The highest 2,3-BD yields were 0.47 and 0.44 g 2,3-BD/g lactose for 72 h using whey and permeate whey, respectively. Finally, an increase of the reaction volume using a 2 L bioreactor to ferment whey and permeate whey was tested under anaerobic conditions. The 2,3-BD yields under anaerobic conditions were lower compared to those obtained in flask of 0.5 L. On the other hand, the addition of air (2 L/min) in a 2 L bioreactor was tested in order to study its effect on BD production fermenting whey. The BD yield was 0.40 g 2,3-BD/g lactose at 24 h. Therefore, the fermentation was improved using 2 L/min of air in the bioreactor since a similar 2,3-BD yield was obtained in comparison to the one in 0.5 L flasks, reducing the fermentation time from 72 h to 24 h. The E. coli JFR12 strain is a suitable strain to valorize whey and permeate whey into 2,3-BD.
iii
ACKNOWLEDGMENT
Firstly, I would like to mention my gratitude to Professor Michèle Heitz since without her nothing of this could be possible. All her help and patience have been a key factor during this period and I have been very comfortable working, studying and learning at Université de Sherbrooke. In addition, I would like to emphasize the good relationship, the pleasant treatment with her.
Beside her was Professor Nathalie Faucheux, my co-director. I am very grateful to her for everything. Above all, I would like to thank her availability for talking with me in her office without any appointment. It has been a huge pleasure to be under her supervision. Her point of view about this topic has been very useful and I really appreciate all the time with her.
Another outstanding place in my mind and heart is for my second co-director, Dr. Antonio Ávalos Ramírez. His priceless help, his valuable suggestions, comments and his incredible professionalism have been a great support for me.
For all of them, I would like to thank all of that I am since I know that I have not been an easy student. Seriously, one thousands of thanks.
I would like also to thank my co-director of the joint PhD agreement Professor Anne Giroir-Fendler for her warm welcome at Université Claude Bernard Lyon 1. It has been formidable to be able to meet her and her good humor.
Beside my directors, I want to thank Marc Veillette his appreciated help and time. It has been very easy to discuss and work with him in order to present the results. Another special mention is for my lovely friends Mauricio González, Jennifer Gil, Sergio Croquer, Beatriz Caraballo, Edwin Rodriguez, Julie Martel, Shant Shahbikian, Marie Lupien-Durocher, Iulian Zoltan, Judit Hunyadkurti, Jean Baptiste ―butterfly‖ Beigbeder, Pedro Durao, Milad Ferdowsi, Bahman Khabiri, Jamie Sharp, Rajesh Guruswamy, Amirjalal Jalali, Tim Spitters, Luc Treutens, Graciela Chavez and many other friends.
In addition, I also wish to thank nice and helpful technicians and unforgettable friends: Isabelle Arsenault and Valérie Larouche. Moreover, I would like to thank secretaries of the chemical engineering department at Université de Sherbrooke: France Auclair, Louise Carbonneau, Louise Chapdelaine and Sylvie Lebrun for their nice behaviors and helps.
Last but not the least, I would like to thank my family: my partner, Isa Aceña; my parents, Pedro Pablo and Rosa María; my brother and sister-in-law, Pedro and Zinthia; my uncle and cousin, Federico; my aunt, Catalina; my grandparents, Justo and Guadalupe; my parents-in-law, Julián and Alicia; and my uncle and aunt-in-parents-in-law, Pepe and Susana, for their unconditional support and motivation during my whole life especially these 4 years. Finally, I would like to mention special friends from Spain: Beatriz Delgado, Erika Ligero, Gloria Chamorro, Jose Manuel Ruiz, Fernando López-Rey and Pilar López because on an adventure like this one, the most important thing is not to be far, it is to have people who make you feel close whatever the distance is.
iv
Table of content
RÉSUMÉ ... i
ABSTRACT ... ii
ACKNOWLEDGMENT ... iii
LIST OF FIGURES ... viii
LIST OF TABLES ... xi
CHAPTER 1. Introduction ...
11.1 Introduction in French ... 3
CHAPTER 2. Literature review ...
32.1 Résumé ... 7
2.2 Abstract ... 7
2.3 Introduction ... 8
2.4 Current status of the dairy industry ... 8
2.4.1 Current status in the world ... 9
2.4.2 Current status in Canada and Québec ... 9
2.4.3 Environmental impacts of the dairy industry ... 9
2.4.3.1 Gases ... 9
2.4.3.2 Liquid effluents and consumption of water ... 10
2.4.3.3 Solid waste ... 10
2.5 Whey ... 10
2.5.1 Whey generation ... 11
2.5.2 Composition of whey ... 11
2.5.3 Acidity of whey ... 14
2.5.4 Whey as an environmental problem ... 14
2.5.5 Processes applied to treat whey ... 15
2.5.5.1 Physical and physicochemical processes ... 15
2.5.5.2 Biological processes ... 15
2.6 Metabolic pathway from lactose to 2,3-BD ... 19
2.6.1 Effect of microorganisms and operating conditions on 2,3-BD production .. 19
v
2.6.1.2 Influence of the substrate ... 27
2.6.1.3 Influence of the compounds stimulating of the process ... 28
2.6.1.4 Influence of the temperature ... 30
2.6.1.5 Influence of the pH ... 31
2.6.1.6 Influence of the fermentation time ... 32
2.6.1.7 Influence of agitation ... 32
2.6.1.8 Influence of the aeration ... 34
2.7 Conclusion ... 34
2.8 Acknowledgement ... 35
Chapter 3. Biovalorization of glucose in four culture media and effect of the
nitrogen source on fermentative alcohols production by Escherichia coli ...
363.1 Résumé ... 37
3.2 Abstract ... 37
3.3 Introduction ... 37
3.4 Materials and methods ... 39
3.4.1 Microorganisms ... 39
3.4.2 Inoculum preparation and population estimation ... 39
3.4.3 Culture media and conditions ... 40
3.4.4 Analytical methods and reagents ... 41
3.4.5 Statistical analysis ... 41
3.5 Results and discussion ... 42
3.5.1 Optical density and colony-forming units for ECW and E. coli JFR1 strains 42 3.5.2 Modeling of the bacterial growth ... 44
3.5.3 Influence of glucose concentration supplementing 4 culture media on ABD yield in the presence of E. coli JFR1 ... 44
3.5.4 Influence of the source and concentration of an additional nitrogen source on ABD yield in the presence of E. coli JFR1 ... 48
3.6 Conclusion ... 53
3.7 Acknowledgement ... 54
Chapter 4. Fermentation of whey and its permeate using a genetically modified
strain of Escherichia coli to produce 2,3-butanediol ...
55vi
4.1 Résumé ... 56
4.2 Abstract ... 56
4.3 Introduction ... 57
4.4 Materials and methods ... 59
4.4.1 Microorganism ... 59
4.4.2 Culture media ... 59
4.4.3 Fermentation parameters ... 60
4.4.4 Analytical methods ... 60
4.4.5 Statistical analysis ... 61
4.5 Results and discussion ... 62
4.5.1 Effect of kind and concentration saccharides on 2,3-butanediol yield ... 62
4.5.1.1 Glucose ... 63 4.5.1.2 Galactose ... 66 4.5.1.3 Lactose ... 68 4.5.1.4 Glucose-galactose ... 70 4.5.1.5 Whey ... 73 4.5.1.6 Permeate whey ... 75
4.5.2 Effect of fermentation parameters ... 77
4.5.2.1 Initial pH ... 77 4.5.2.2 Inoculum size ... 78 4.5.2.3 Agitation ... 81 4.5.3 Fermentations in bioreactor ... 85 4.5.3.1 Anaerobic fermentation ... 85 4.5.3.2 Aerated bioreactor ... 88 4.6. Conclusion ... 89 4.7 Acknowledgement ... 90
CHAPTER 5. Conclusion ...
91 5.1 Conclusion in French ... 93List of references ...
96Annex 1. Fermentation of glucose and galactose by a genetically modified strain
of Escherichia coli into acetoin and 2,3-butanediol ...
120vii
A.1 Résumé ... 121
A.2 Abstract ... 121
A.3 Introduction ... 122
A.4 Materials and methods ... 124
A.4.1 Microorganism ... 124
A.4.2 Culture media and conditions ... 124
A.4.3 Analytical methods and reagents ... 125
A.4.4 Statistical analysis ... 125
A.5 Results and discussion ... 125
A.6 Conclusion ... 129
viii
LIST OF FIGURES
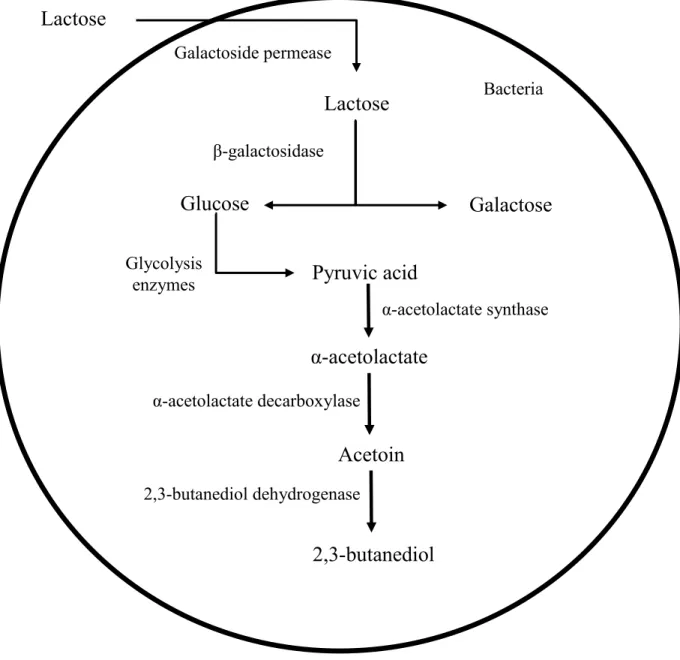
Figure 2.1: An overall scheme of the whey valorization processes ... 12 Figure 2.2: Whey production during cheese manufacturing ... 13 Figure 2.3: Representation of the metabolic pathway from lactose to 2,3-butanediol Source: Alpers and Tomkins (1966) and Xu et al. (2014)... 20
Figure 3.1: Optical density at 600nm (OD600, ■), colony-forming units per mL of broth (CFU/mL, ♦) and modeling of the growth curve by the modified Gompertz model (-) as a function of time in the presence of ECW (A) and E. coli JFR1 (B) strain. Results are means ± SD of 9 replications performed in flasks at 37ºC, atmospheric pressure, initial pH of 6.5 and 100 rpm a working volume of 200 mL (batch fermentation). ... 43 Figure 3.2: ABD yield as a function of time in the presence of E. coli JFR1 in LB (A), M9 (B), M63 (C) and MOPS (D) culture media at 4 g/L glucose (◊) , 12.5 g/L of glucose (□) and 25 g/L of glucose (○). Results are means ± SD of 3 replications performed in flasks at 37ºC, atmospheric pressure, initial pH of 6.5, 100 rpm and 10% v/v of inoculum in a working volume of 200 mL (batch fermentation)... 47 Figure 3.3: Glucose conversion (A) and ABD yield (B) in M9 culture medium supplemented with 12.5 g/L of glucose as a function of time in the presence of E. coli JFR1. Source of nitrogen: urea at 0.6 g N/L (▲), 1.2 g N/L (∆), 2.5 g N/L (♦), 5.0 g N/L (■) and 7.0 g N/L (●). Additionally, the highest (▬) and lowest (+) ethanol yields obtained for 0.6 g N/L and without an ANS are represented respectively. Results are means ± SD of 3 replications performed in flasks at 37ºC, atmospheric pressure, initial pH of 6.5, 100 rpm and 10% v/v of inoculum in a working volume of 200 mL (batch fermentation). ... 51 Figure 3.4: Glucose conversion (A) and ABD yield (B) in M9 culture medium supplemented with 25 g/L of glucose as a function of time in the presence of E. coli JFR1. Source of nitrogen: urea at 2.5 g/L of nitrogen (♦), 5.0 g/L of nitrogen (■), 7.0 g/L of nitrogen (●) and 10.0 g N/L (×). Additionally, the highest (□) and lowest (▬) ethanol yields obtained for 10.0 g N/L and 2.5 g N/L are represented respectively. Results are means ± SD of 3 replications performed in flasks at 37ºC, atmospheric pressure, initial pH of 6.5, 100 rpm and 10% v/v of inoculum in a working volume of 200 mL (batch fermentation). ... 53
Figure 4.1: Metabolic pathway to produce 2,3-BD from lactose fermentation in the presence of a genetically modified strain of Escherichia coli. Relevant reactions to transform pyruvic acid into 2,3-BD are represented by the names of the corresponding enzymes from Enterobacter
cloacae: α-acetolactate synthase (ALS), α-acetolactate decarboxylase (ALDC) and
ix
nicotinamide adenine dinucleotide. Sources: Lazar et al. (2015), Mazumdar et al. (2013), Xiao and Lu (2014), Xu et al. (2014), Xu et al. (2015). ... 63 Figure 4.2: Glucose conversion (Figure 4.2A), 2,3-BD (Figure 4.2B) and A (Figure 4.2C) yields as a function of time in the presence of E. coli JFR12 at 3 [Glu]0. Glucose
concentration: 12.5 (○); 25 (●) and 50 (●) g/L. Results are means ± SD of 2 experiments performed in duplicate. ... 63 Figure 4.3: Galactose conversion (Figure 4.3A), 2,3-BD (Figure 4.3B) and A (Figure 4.3C) yields as a function of time in the presence of E. coli JFR12 at 3 [Gal]0. Galactose
concentration: 12.5 (◊); 25 (♦) and 50 (♦) g/L. Results are means ± SD of 2 experiments performed in duplicate. ... 66 Figure 4.4: Lactose conversion (Figure 4.4A), 2,3-BD (Figure 4.4B) and A (Figure 4.4C) yields as a function of time in the presence of E. coli JFR12 at 3 [Lac]0. Lactose concentration:
12.5 (□); 25 (■) and 50 (■) g/L. Results are means ± SD of 2 experiments performed in duplicate. ... 68 Figure 4.5: Glucose and galactose conversion and 2,3-BD and A yields as a function of time in the presence of E. coli JFR12. Two mixture [G-Ga]0 were tested: 25 g/L (Figure 4.5A) and 50
g/L (Figure 4.5B). Figure 4.5A: Glucose conversion (□), galactose conversion (◊), 2,3-BD (○) and A (∆). Figure 4.5B: Glucose conversion (■), galactose conversion (♦), 2,3-BD (●) and A (▲). Results are means ± SD of 2 experiments performed in duplicate. ... 70 Figure 4.6: 2,3-BD yield at maximum saccharide conversion at 25 g/L (Figure 4.6A) and 50 g/L (Figure 4.6B) of saccharide concentration with E. coli JFR12. Figure 4.6A: 2,3-BD yield using glucose (48 h), galactose (48 h), lactose (48 h) and mixture G-Ga (24 h) when conversion was 100% in all cases. Figure 4.6B: 2,3-BD yield using glucose (conversion 94%), galactose (conversion 90%), lactose (conversion 96%) and mixture G-Ga at 72 h (conversion 100% for both monosaccharides). Results are means ± SD of 2 experiments performed in duplicate. ... 72 Figure 4.7: Lactose conversion (Figure 4.7A), 2,3-BD yield (Figure 4.7B) and A yield (Figure 4.7C) fermenting W1 diluted with M9 as a function of time in the presence of E. coli JFR12. Lactose concentration: 15.5 (○), 23 (●) and 31 (●) g/L of lactose. Results are means ± SD of 2 experiments performed in duplicate. ... 74 Figure 4.8: Lactose conversion (Figure 4.8A), 2,3-BD yield (Figure 4.8B) and A yield (Figure 4.8C) fermenting PW1 diluted with M9 as a function of time in the presence of E. coli JFR12. Lactose concentration: 17 (○), 25.5 (●) and 34 (●) g/L. Results are means ± SD of 2 experiments performed in duplicate. ... 75 Figure 4.9: 2,3-BD yield fermenting W1 (Figure 4.9A) and PW1 (Figure 4.9B) as a function of time in the presence of E. coli JFR12 at different initial pH: 6.5 (○), 7.0 (●) and 7.4 (●). Results are means ± SD of 2 experiments performed in duplicate. ... 77
x
Figure 4.10: Lactose conversion (Figure 4.10A) and 2,3-BD yield (Figure 4.10B) fermenting W1 as a function of time in the presence of E. coli JFR12 at different inoculum sizes (%, v/v). Inoculum size: 5% (□), 7.5% (■) and 10% (■). Results are means ± SD of 2 experiments performed in duplicate. ... 79 Figure 4.11: Lactose conversion (Figure 4.11A) and 2,3-BD yield (Figure 4.11B) fermenting PW1 as a function of time in the presence of E. coli JFR12 at different inoculum sizes (%, v/v). Inoculum size: 5% (∆), 7.5% (▲) and 10% (▲). Results are means ± SD of 2 experiments performed in duplicate. ... 80 Figure 4.12: Lactose conversion (Figure 4.12A) and 2,3-BD yield (Figure 4.12B) fermenting W1 as a function of time in the presence of E. coli JFR12 at different agitation rates. Agitation rate: 50 (◊), 100 (♦) and 200 rpm (♦). Results are means ± SD of 2 experiments performed in duplicate. ... 81 Figure 4.13: Lactose conversion (Figure 4.13A) and 2,3-BD yield (Figure 4.13B) fermenting PW1 as a function of time in the presence of E. coli JFR12 at different agitation rates. Agitation rate: 50 (□), 100 (■) and 200 rpm (■). Results are means ± SD of 2 experiments performed in duplicate. ... 82 Figure 4.14: 2,3-BD yield as a function of time fermenting W1 and W2 in the presence of E.
coli JFR12 in flask (Figure 4.14A) and bioreactor (Figure 4.14B). Figure 4.14A: W1 (●), W2
undiluted (●) and W2 diluted (○). Figure 4.14B: W1 (●), W2 undiluted (●) and W2 diluted (○). Results are means ± SD of an experiment performed in duplicate. ... 85 Figure 4.15: 2,3-BD yields as a function of time fermenting PW1 and PW2 in the presence of
E. coli JFR12 in flask (Figure 4.15A) and bioreactor (Figure 4.15B). Figure 4.15A: PW1 (●),
PW2 undiluted (●) and PW2 diluted (○). Figure 4.15B: PW2 undiluted (●) and PW2 diluted (○). Results are means ± SD of an experiment performed in duplicate. ... 86 Figure 4.16: Lactose conversion (■), 2,3-BD (○), A (∆) and ABD (◊) yields fermenting diluted NW as a function of time in the presence of E. coli JFR12 in a bioreactor of 2 L. Results are means ± SD of an experiment performed in duplicate. ... 88
xi
LIST OF TABLES
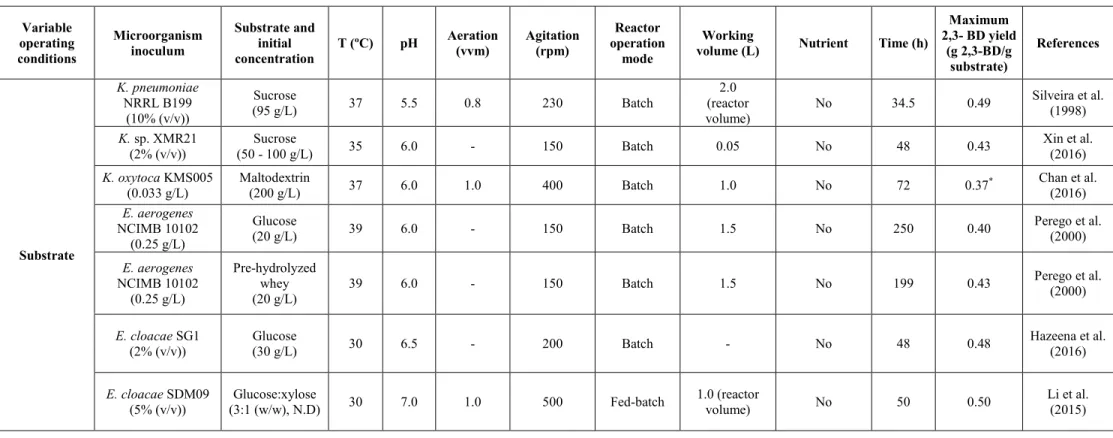
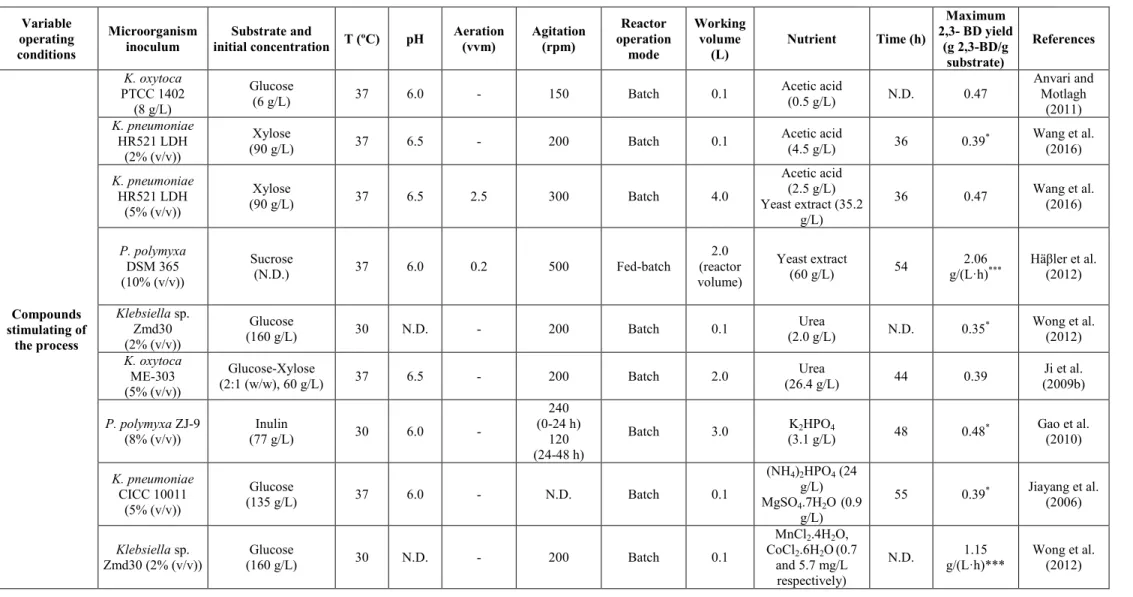
Table 2.1: Composition of sweet and acid wheys. Source: Hernández-Rojas and Vélez-Ruiz (2014); Panesar et al. (2007); Pescuma et al. (2015); Tsakali et al. (2010). ... 14 Table 2.2: Operating conditions using different types of microorganisms and their influence on the maximum 2,3-butandediol yield. ... 21 Table 2.3: Characteristics and particularities of some bacteria producers of 2,3 butanediol.25
Table 3.1: Composition of the 4 culture media in 1L of distilled water - LB medium (Berney et al. 2006); M9 minimal medium (Ecocyc 2017; Maniatis et al. 1982); M63 minimal medium (Pardee et al. 1959); and MOPS (3-morpholinopropane-1-sulfonic acid) minimal medium (Wisconsin-University 2017). ... 40 Table 3.2: Maximum glucose conversion (%) as a function of glucose concentration (g/L) and time (h) in the 4 studied culture media at 37ºC, atmospheric pressure, initial pH of 6.5, 100 rpm and 10% (v/v) of inoculum in a working volume of 200 mL (batch fermentation). ... 45 Table 3.3: Glucose conversion (%) as a function of nitrogen concentration (g N/L) in the presence of 12.5 and 25 g/L of glucose in M9 culture medium using NaNO3 as an ANS at 37ºC, atmospheric pressure, initial pH of 6.5, 100 rpm and 10% (v/v) of inoculum in a working volume of 200 mL (batch fermentation). ... 49 Table 3.4: Acetic acid yield (%, g acetic acid/g glucose) as a function of nitrogen concentration (g N/L) in the presence of 12.5 and 25 g/L of glucose in M9 culture medium using NaNO3 as an ANS at 37ºC, atmospheric pressure, initial pH of 6.5, 100 rpm and 10% v/v of inoculum in a working volume of 200 mL (batch fermentation). ... 50
Table 4.1: Operating conditions used to ferment saccharides (glucose, galactose, lactose and the mixture glucose-galactose, G-Gal) in M9, whey (W1) and permeate whey (PW1) diluted with M9, and the study of inoculum size, initial pH and agitation in flask. New batch of W (W2) and PW (PW2) diluted and undiluted were tested in flask and in a 2 L bioreactor. Fermentations performed at 37ºC, 1 atm and 72 h. ... 61 Table 4.2: Maximum Et yield fermenting glucose, galactose, lactose and a mixture (1:1, w/w) of glucose-galactose at different concentrations at 10% (v/v) of inoculum, 37ºC, 1 atm, initial pH 7.4 and 100 rpm………66 Table 4.3: Acetoin, 2,3-BD and ABD yields as a function of time fermenting W1 and PW1 at 37ºC, 1 atm and initial pH 7.4 for 48 and 72 h in flasks varying the agitation rate. ... 84
1
CHAPTER 1.
Introduction
In a world more and more industrialized to cover all the human needs, the environmental issues are getting a special attention since the industrialization is causing negative environmental impacts, which is trying to be contained by, for instance, international environmental agreements. It is possible to underline among the human requirements, the basic consumer goods like milk and bread, and their production have to be increased because of the rise of the worldwide population. The industrialization causes the increase of greenhouse gases (GHG) like carbon dioxide (CO2) (Panesar et al., 2007). However, the
upgrades of the productive processes have reduced the GHG emissions. For example, in the dairy industry, 1.63 kg CO2 equivalent per L of milk cow produced were generated in 1961;
whereas this amount was reduced to 0.92 kg CO2 equivalent per L of milk cow produced in
2014 (FAO-FAOSTAT, 2017a).
The dairy industry example is important since it is one of the most important industries in the agro-food sector. The main dairy product is the milk, which worldwide production was 791.8 million tons in 2014 (FAO-FAOSTAT, 2017b). However, all of amount of milk produced is not only allocated for human consumption but also for manufacturing other products derived from milk like cheese. Cheese production, an important dairy processed product in terms of volume, needs around 10 L of milk to make 1 kg of cheese (BCB, 2017). During the cheese manufacturing, a liquid effluent is generated: the whey (W). Whey is the liquid obtained after coagulating the milk and is generated at a rate of 9 L per kg of cheese manufactured. If it is directly released into any body of water, these important quantities of W can affect the aquatic life of rivers, lakes, etc. (De Jesús et al. 2015, Guimarães et al. 2010). Lactose, a disaccharide formed of glucose and galactose (monosaccharides), is the main dried solid compound of W with a concentration ranged between 46 and 54 g/L of W depending on the kind of W: sweet or acid (Hernández-Rojas and Vélez-Ruíz 2014, Panesar et al. 2007, Pescuma et al. 2015, Tsakali et al. 2010). One of the treatments that can be applied on W is its deproteinization by ultrafiltration (membranes), obtaining another liquid effluent: permeate whey (PW) (de Wit 2001). Permeate whey can present a lactose concentration higher than 80 g/L (Smith et al. 2016).
Lactose can be used in order to produce hydrogen (H2), biogas, acetoin (A) and 2,3-butanediol
(2,3-BD) by catalytic reactions performed by enzymes, commonly named ―fermentation‖ (Pescuma et al., 2015; Roncal et al., 2010). The fermentation is performed in the presence of bacteria and under controlled operating conditions. Several parameters such as temperature, pH, agitation, kind of bacteria and concentration of substrate, can affect the yield of the fermentative products.
To the author‘s best knowledge, no study discussed the fermentation of the lactose content in W and PW by a modified strain of Escherichia coli in order to obtain 2,3-butanediol. In addition, no study discussed the transformation of galactose as a sole carbon source by fermentation in the presence of an E. coli strain.
2
The objective of this research was the transformation of lactose contained in the W and PW into 2,3-BD by a genetically modified strain of Escherichia coli (ECGM), which hosts the metabolic pathway of 2,3-BD from Enterobacter cloacae. During this research, the ECGM was improved in terms of the 2,3-BD production. In this way, two ECGM strains were used:
E. coli JFR1 and E. coli JFR12. To the best of our knowledge, this is the first time that a
genetically modified strain (ECGM) has been used in order to catalyze the W and PW fermentation.
This study was carried out under seven specific objectives:
1) The inoculum size of E. coli JFR1 before performing fermentations in order to obtain the highest bacterial population;
2) The effect of three glucose (used as a control) concentrations supplementing four culture media in the presence of E. coli JFR1 on the formation of A and 2,3-BD (ABD);
3) The influence of the type and concentration of an additional nitrogen source (ANS) in a defined culture medium (M9) on the ABD production using E. coli JFR1;
4) The 2,3-BD yield fermenting three concentrations of glucose, galactose and lactose in M9 culture medium with E. coli JFR12;
5) The effect of the lactose dilution contained in W and PW on the 2,3-BD yield in the presence of M9 (W:M9 or PW:M9), varying the ratio substrate/M9 (50:50, 75:25 and 100:0); 6) The influence of the inoculum size, the initial pH and the agitation rate fermenting W and PW in absence of M9 on the 2,3-BD yield;
7) The effect of air addition (2 L/min) on the 2,3-BD yield in a 2 L bioreactor in the presence of E. coli JFR12 and W.
This thesis contains 5 chapters including one review article and two research articles. In addition, one short paper is included as Annex 1.
Chapter 1 presents a general statement about the theme of the thesis. In this chapter, the whey and its permeate are introduced besides the objectives of the project.
Chapter 2 presents the state of art about the potential use of W in order to produce 2,3-BD. In this chapter, the W generation and its effects on the environment are introduced. In addition, the diverse kinds of treatments that can be performed on W in order to valorize it are discussed. Among these treatments, the biological process and particularly the transformation of several saccharides into 2,3-BD by different bacteria and how the operating conditions such as type and concentration of substrate, temperature, pH, agitation, etc. affect the 2,3-BD yield is also discussed.
Chapter 3 presents the estimation of the inoculum size by two experimental techniques: optical density (OD) and colony-forming unit (CFU). The wild and a genetically modified strain of
Escherichia coli were characterized. Once the inoculum size was estimated, four culture media
(LB, M9, M63 and MOPS) were tested at three glucose concentrations (4, 12.5 and 25 g/L) in the presence of the genetically modified E. coli strain (E. coli JFR1) to produce ABD. The culture medium M9 was selected according to the yield of ABD and to the cost of the culture medium. The chosen culture medium, M9, was supplemented with two ANS (sodium nitrate: NaNO3, and urea: (NH2)2CO) and tested in the presence of 12.5 and 25 g/L of glucose. After
3
performing the analysis, it was confirmed that urea presented a positive effect on the ABD yield and the nitrogen content could be optimized.
Chapter 4 presents the 2,3-BD yields fermenting W and PW in the presence of an optimized E.
coli strain: E. coli JFR12. Firstly, the fermentation of glucose, galactose and lactose at three
concentrations (12.5, 25 and 50 g/L) in M9 culture medium supplemented with 15 g/L of urea (7.0 g N/L) was studied. The 2,3-BD yields as a function of the saccharide nature are discussed. Moreover, a mixture of glucose and galactose at two concentrations (12.5 and 25 g/L of each monosaccharide) was used as a substrate in the fermentation. Further, W1 and PW1 were mixed with M9 as follows: 50:50, 75:25 and 100:0 (v/v) and evaluating the fermentation process. After that, the effect of inoculum size (5.0, 7.5 and 10.0%, v/v), initial pH (6.5, 7.0 and 7.4) and agitation ratio (50, 100 and 200 rpm) on 2,3-BD production were evaluated using W1 and PW1. Finally, a new batch of whey (W2) and permeate whey (PW2) with a lactose concentration of 51 and 47 g/L, respectively, were tested in 0.5 L flasks and in a 2 L bioreactor (without aeration). The effect of the air addition (2 L/min) in a 2 L bioreactor (microaerobic conditions) on the 2,3-BD yield was tested using W2.
Chapter 5 is the conclusion of the thesis including the general findings of the project. Future perspectives are presented taking into account the found problems and the first obtained results.
1.1 Introduction in French
Afin de répondre aux besoins des populations, l‘industrialisation s‘accroît ce qui provoque une augmentation de la pollution. Les besoins humains et notamment la production de produits de consommation courante ne cesse d‘augmenter en lien avec la croissance de la population mondiale. Par conséquent, des problématiques environnementales apparaissent suite à une industrialisation intensive qui se traduit par une augmentation des émissions de gaz à effet de serre (GES) comme le dioxyde de carbone (CO2) (Panesar et al. 2007). Cependant,
l‘optimisation des procédés a permis de réduire les émissions de GES notamment dans le domaine de la production laitière. Par exemple, dans l‘industrie laitière, un litre de lait produit, émettait 1.63 kg de CO2 en 1961 alors que cette quantité était de 0.92 kg de CO2 équivalent par
litre de lait produit en 2014 (FAO-FAOSTAT, 2017a).
L‘exemple de l‘industrie laitière est important car il représente un secteur fort de l‘industrie agroalimentaire. Le lait est le principal produit de cette industrie avec une production mondiale atteignant 791.8 millions de tonnes en 2014 (FAO-FAOSTAT, 2017b). Cependant, cette production annuelle se répartit entre le lait de consommation courante et les produits dérivés comme les fromages. La production de fromage, un important produit dérivé en termes de volume, nécessite 10 litres de lait par kilogramme de fromage produit (BCB, 2017). Au cours de la fabrication du fromage, un effluent liquide est généré: le lactosérum (W). Le W est le liquide résiduel issu du processus de coagulation du lait; 9 litres de W sont générés par kg de fromage manufacturé. En cas de rejets directs dans les eaux naturelles, ces quantités importantes de lactosérum peuvent nuire à la vie aquatique des fleuves, des lacs, etc. (De Jesús et al. 2015, Guimaraes et al. 2010). Le lactose, un disaccharide formé de glucose et galactose
4
(monosaccharides), est le principal composant de la fraction sèche du W avec une concentration variant entre 46 et 54 g/L de W, selon le type de W: sucré ou acide (Hernández-Rojas and Vélez-Ruíz 2014, Panesar et al. 2007, Pescuma et al. 2015, Tsakali et al. 2010). L‘un des traitements pouvant être appliqué sur le W est sa déprotéinisation par ultrafiltration (membranes) afin d‘obtenir du perméat (PW). Le PW peut avoir une concentration de lactose supérieure à 80 g/L (Smith et al. 2016).
Le lactose peut être utilisé pour la production d‘hydrogène (H2), de biogaz, d‘acétoïne (A) et
de 2,3-butanediol (2,3-BD) lors de réactions de catalyse enzymatique, appelée couramment ―fermentation‖ (Pescuma et al., 2015; Roncal et al., 2010). La fermentation est effectuée en présence de bactéries et sous conditions contrôlées. Plusieurs facteurs comme la température, le pH, l‘agitation, le type de bactéries, la nature et la concentration du substrat, peuvent modifier le rendement des produits de la fermentation.
À la connaissance de l'auteur, aucune étude n'a discuté de la fermentation du lactose présent dans W et PW par une souche modifiée d'Escherichia coli afin d'obtenir du 2,3-butanediol. En outre, aucune étude n'a examiné la transformation du galactose comme l‘unique source de carbone par fermentation en présence d'une souche d'E. coli.
L‘objectif de ce travail de recherche a porté sur la transformation du lactose contenu dans le W et le PW en 2,3-BD par une souche d‘Escherichia coli génétiquement modifiée (ECGM). Tout d‘abord, l‘ECGM a été évaluée puis améliorée afin d‘optimiser la production du 2,3-BD. Pour cela, deux souches d‘ECGM ont été sélectionnées: E. coli JFR1 et E. coli JFR12. À notre connaissance, c‘est la première fois qu‘une souche génétiquement modifiée (ECGM) est utilisée pour la fermentation du W ou du PW.
Lors de cette étude, les sept objectifs spécifiques suivants ont été évalués:
1) la taille de l‘inoculum d‘E. coli JFR1 nécessaire pour réaliser des fermentations;
2) l‘effet de trois concentrations de glucose et de quatre milieux de culture en présence d‘E.
coli JFR1 sur la formation d‘A et de 2,3-BD (ABD);
3) l‘influence du type et de la concentration d‘une source additionnelle d‘azote (SAA) sur le rendement en ABD dans un milieu de culture défini (M9) en présence d‘E. coli JFR1;
4) le rendement en 2,3-BD lors de la fermentation de trois concentrations de glucose, de galactose et de lactose dans le milieu de culture M9 en présence d‘E. coli JFR12;
5) l‘influence de la dilution du lactose contenu dans W et PW sur le rendement en 2,3-BD en mélangeant W ou PW avec M9 (W:M9 ou PW:M9) et en variant le ratio substrat/M9 (50:50, 75:25 et 100:0 (v/v));
6) l‘influence du volume d‘inoculum, du pH initial et de la vitesse d‘agitation lors de la fermentation du W et du PW en absence de M9 sur le rendement en 2,3-BD;
7) l‘effet de l‘oxygène (2 L/min d‘air) sur le rendement en 2,3-BD lors d‘une fermentation dans un bioréacteur de 2 L en présence d‘E. coli JFR12 et de W.
Ce manuscrit de thèse contient 5 chapitres incluant un article de revue et deux articles de recherche. Un article complémentaire est annexé à ce document.
Le chapitre 1 est consacré à l‘introduction du travail de recherche avec notamment des données relatives au lactosérum et au perméat. Les objectifs de l‘étude sont ensuite précisés.
5
Le chapitre 2 présente l‘état de l‘art dans le domaine concerné et porte principalement sur la production du 2,3-BD à partir de W. Dans cette partie, la production de W et de ses effets sur l‘environnement sont présentés. En outre, les différentes valorisations du W sont développées. Parmi ces traitements, le procédé biologique et en particulier la transformation de plusieurs types de saccharides en 2,3-BD par diverses souches bactériennes et les conditions d‘opération (type et concentration de substrat, température, pH, vitesse d‘agitation, etc.) sont discutés en détail.
Le chapitre 3 est consacré à l‘estimation de la taille de l‘inoculum. Deux techniques expérimentales ont été comparées : la densité optique (DO) et la méthode des unités formatrices de colonies (UFC). Les souches sauvage et génétiquement modifiée d‘E. coli ont été caractérisées. Une fois la taille initiale de l‘inoculum estimée, 4 milieux de culture (LB, M9, M63 et MOPS) ont été utilisés avec trois concentrations de glucose (4, 12.5 et 25 g/L) en présence de la souche d‘E. coli génétiquement modifiée (E. coli JFR1). Le milieu de culture M9 fut sélectionné puisque le rendement en ABD était le plus élevé sur ce milieu et le coût de M9 était le plus faible. Le milieu de culture M9, a été complémenté avec deux sources additionnelles d‘azote (SAA) (nitrate de sodium: NaNO3, et urée : (NH2)2CO) et a été évalué
en présence de 12.5 et 25 g/L de glucose. Il a été constaté que l‘urée avait un effet positif sur le rendement en ABD; la teneur en azote a ensuite été optimisée.
Le chapitre 4 présente les rendements en 2,3-BD lors de la fermentation de W et PW en présence d‘une souche d‘E. coli optimisée: E. coli JFR12. Dans un premier temps, la fermentation du glucose, du galactose et du lactose (concentrations de 12.5, 25 et 50 g/L) dans le milieu de culture M9 enrichi de 15 g/L d‘urée (7.0 g azote/L) a été étudiée. Les rendements en 2,3-BD en fonction de la nature du saccharide sont discutés. En complément, un mélange de glucose et de galactose sous deux concentrations (12.5 et 25 g/L pour chaque monosaccharide) a été réalisé puis utilisé comme substrat dans la réaction de fermentation. Enfin, un mélange de W1 (lot un (1) de lactosérum avec une concentration en lactose de 31 g/L) et de PW1 (lot un (1) de perméat avec une concentration en lactose de 34 g/L) a été ajouté au milieu de culture M9 dans les proportions suivantes: 50:50, 75:25 et 100:0 (v/v). L‘effet du volume d‘inoculum (5, 7.5 et 10.0%, v/v), du pH initial (6.5, 7.0 et 7.4) et de la vitesse d‘agitation (50, 100 et 200 rpm) sur le rendement en 2,3-BD a été étudié lors de la fermentation des mélanges. Finalement, un nouveau lot de lactosérum (W2) et de perméat de lactosérum (PW2) avec une concentration de lactose de 51 et 47 g/L, respectivement, ont été fermentés en erlenmeyers de 0.5 L et en bioréacteur de 2 L (conditions anaérobies). L‘effect d‘air (2 L/min) en bioréacteur de 2 L (conditions micro-aérobies) sur le rendement en 2,3-BD a été testé avec W2.
Le chapitre 5 est la conclusion du travail de thèse. Des perspectives prenant en compte les difficultés rencontrées et les premiers résultats obtenus sont présentées.
6
CHAPTER 2. Literature review
Avant-propos:
L‘article ―Biovalorization of saccharides derived from industrial wastes such as whey – A review” a été publié dans le Journal ―Reviews in Environmental Science and
Bio/Technology‖ 16(1) (2017) 147-174.
TITRE: Biovalorisation des saccharides dérivés des déchets industriels tels que le petit lait – Un revue de la littérature.
Title: Biovalorization of saccharides derived from industrial wastes such as whey – A review. David Fernández-Gutiérrez a,b, Marc Veillette a, Anne Giroir-Fendler b, Antonio Avalos Ramirez c, Nathalie Faucheux a and Michèle Heitz a, d
a Université de Sherbrooke, Department of Chemical Engineering and Biotechnological
Engineering. Faculty of engineering, 2500 boul. de l'Université, Sherbrooke, (Québec), Canada, J1K 2R1
b Université Lyon 1, CNRS, UMR 5256, Institut de Recherche sur la Catalyse et
l‘Environnement de Lyon (IRCELYON), 2 avenue Albert Einstein, 69626 Villeurbanne, France
c Centre National en Électrochimie et en Technologies Environnementales, Shawinigan,
(Québec), Canada, G9N 6V8
d Corresponding author: E-mail address: [email protected]
Contribution to the document: This paper presents a literature review on the generation of whey issued from the cheese manufacturing. Whey can cause diverse environmental issues due to its composition, which depends on the kind of whey. Performing fermentation of whey in order to produce 2,3-butanediol is a solution to avoid the environmental problems caused this kind of biomass. A fermentation process depends on different factors like the kind and concentration of the carbon source, temperature, pH, agitation, etc. Among the operational parameters, one of the most important is the kind and strain of bacteria. In the review, these parameters are presented. Therefore, this review paper is helpful and relevant to the thesis topic.
7
Biovalorization of saccharides derived from industrial wastes
such as whey – A review
2.1
Résumé
Le lactosérum est un résidu liquide résultant de la transformation du lait en fromage. Le lactosérum pose un problème environnemental majeur pour l‘industrie laitière dû à sa charge organique élevée reliée à sa forte teneur en lactose.
La valorisation du lactosérum peut se faire par des procédés biologiques basés sur la fermentation du lactose en différents produits comme l‘acide lactique (utilisés comme additif alimentaire), le 2,3-butanediol (matière première pour obtenir des produits comme la méthyl-éthyl-cétone utilisée dans les industries pharmaceutique et chimique), le biogaz (pour obtenir de l‘énergie). La production de 2,3-butanediol à partir de saccharides tel que le glucose a été étudiée depuis plusieurs années en utilisant plusieurs sortes de micro-organismes comme
Enterobacter aerogenes, Panibacillus polymyxa, Klebsiella sp., Serratia marcescens et Escherillia coli dont certains ont été génétiquement modifiés pour améliorer la production de
2,3-butanediol. Le potentiel de fermentation du lactosérum en 2,3-butanediol dépend de plusieurs paramètres opératoires comme la nature des micro-organismes, la composition du milieu de culture, la température, le pH et la teneur en oxygène.
Cet article de revue présente, tout d‘abord, un bilan de la production du lait et du fromage au Canada et dans le monde. Puis, il décrit les différentes variétés de lactosérum et leurs techniques de traitement. Enfin, cet article présente la production par catalyse enzymatique du 2,3-butanediol à partir de divers saccharides en présence de microorganismes sous différentes conditions.
Mots-clefs: Industrie laitière, petit lait, microorganismes, 2,3-butanediol, conditions d’opération, fermentation.
2.2
Abstract
Whey is a liquid waste issued from the transformation of milk into cheese. Whey is a major environmental problem for the dairy industry due to its high organic load, linked to its high content of lactose. It can be valorized by biological processes based on lactose fermentation into different products such as (1) lactic acid (as food additive), (2) 2,3-butanediol (as feedstock to get products such as methyl-ethyl-ketone or 2-butene for the pharmaceutical and chemical industries), (3) biogas (to obtain energy). The production of 2,3-butanediol from saccharides, such as glucose, has been actively studied over previous decades using several types of microorganisms such as Enterobacter aerogenes, Paenibacillus polymyxa, Klebsiella sp., Serratia marcescens and Escherichia coli. Some of these have even been genetically modified to improve the 2,3-butanediol production. The potential whey fermentation process into 2,3-butanediol depends on several operating conditions such as microorganisms, composition of the culture medium, temperature, pH and aeration. This review first presents a summary of the situation of milk and cheese production in Canada and around the world. It also describes the different kinds of whey and their treatment techniques. Finally, this paper
8
describes the production of 2,3-butanediol from saccharides by various microorganisms under different operating conditions.
Keywords: Dairy industry, whey, microorganism, 2,3-butanediol, operating conditions, fermentation.
2.3
Introduction
Dairy industry is one of the most important industries inside the agri-food sector around the world. For instance, in Canada in 2015, the dairy industry generated almost 0.17 billion CAD representing 16% of the total profits generated by the agri-food sector (Canadian Dairy Information Center (CDIC) 2017a). Therefore, the dairy industry not only has an important economic impact but creates thousands of direct and indirect jobs, representing local and regional economic benefits (Castañeda Martínez et al. 2009). For example, in 2015 in Canada and Quebec (a province of Canada), the number of people employed in the dairy industry was close to 23000 and 8900, respectively (CDIC 2017b). However, the dairy industry also generates detrimental compounds for the environment such as: (1) greenhouses gases (GHG); mainly methane (CH4) and carbon dioxide (CO2) (FAO 2010); (2) liquids (wastewater and
whey); around 11000 million m3 of wastewater/year are generated in the world containing
high organic loads (i.e. between 30 and 50 g of biochemical oxygen demand (BOD)/L water) (Mukhopadhyay et al. 2003; Tikariha and Sahu 2014), which could perturb the aquatic life; and (3) solids (manure, a cow produces an average of 62 kg of manure per day (feces and urine)) (Statistic-Canada 2006).
The dairy industry generates effluents when milk is processed. One of the most important products is cheese. One kg of manufactured cheese generates 9 L of whey, the main effluent of dairy industry (Guimaraes et al. 2008; Pintado et al. 2001). This must be processed to avoid the deterioration of the ecosystem. For this purpose, whey can be treated by coagulation-flocculation (Prazeres et al. 2012). It can also be upgraded by physicochemical treatments like membranes in order to get proteins (de Wit 2001; Madureira et al. 2007) or by biological treatments into biogas (hydrogen (H2)), lactic acid, and alcohols such as 2,3-butanediol
(2,3-BD) (Antonopoulou et al. 2008; Ghaly et al. 2003; Guimarães et al. 2010; Panesar et al. 2007; Parra Huertas 2009; Ukpai and Nnabuchi 2012).
2.4
Current status of the dairy industry
Milk for human consumption can be produced from cows, goats, etc. (Claeys et al. 2014; FAO-FAOSTAT 2017c). The worldwide production of milk was around 802 million tons in 2014, around 81% of the global production was cow milk (FAO-FAOSTAT 2017c).
Milk transformation produces a great variety of foods such as butter, yogurt or cheese. Cheese is one of the most consumed products (Muehlhoff et al. 2013). For example, in Canada, more than 1000 kinds of cheese are produced which include cheddar, cottage cheese and mozzarella (CDIC 2017c).
9
2.4.1
Current status in the world
In 2014, the worldwide production of cow milk was around 656 million tons. Among continents and countries, Europe and United States were respectively the largest global producers of cow milk, 33.1 and 14.3%, respectively (CDIC 2017d; FAO-FAOSTAT 2017c). In the case of cheese, its worldwide production was 22.6 million tons of cheese produced in 2014 (FAO-FAOSTAT 2017d). Once again, Europe and United States were the largest producers of cheese in the world (52.4 and 24.7% of global cheese production respectively). Milk and cheese production is an important part of the agro-food industry. Both products present an important role from an economic point of view for every country. For instance, in case of cheese, France exported around 33% of its cheese production (Vlahović et al. 2014). Hence, this fact in addition to the number of employees needed to process milk and manufacture cheese makes the dairy industry an important worldwide economic support (Hirsch and Hartmann 2014; Prakash 2015).
2.4.2
Current status in Canada and Québec
In 2015, the Canadian milk production was near 1.3% of world milk production, being the 5th biggest producer of cow milk in the American continent (CDIC 2017e; FAO-FAOSTAT 2017c). Quebec and Ontario were the main producers of milk (36.7 and 32.9% of the milk produced in Canada, respectively) (CDIC 2017e).
In the case of cheese, Canada produced near 1.9% of the world cheese production in 2015, this being the 3rd biggest producer of cheese in the American continent (FAO-FAOSTAT 2017d). Quebec and Ontario were the biggest producers (50.5 and 27.8%, respectively) of Canadian cheese (CDIC 2017f).
Hence, the dairy industry has a huge economic impact in Canada. For instance, in the particular case of Quebec, the dairy industry represented 38.2% of the number of employees in Canada (23322 in total) in 2015 (CDIC 2017b).
2.4.3
Environmental impacts of the dairy industry
On the other hand, milk production and its transformation cause important environmental impacts such as high consumption of energy and water, as well as emissions of gases, wastewater and solid waste (Capper et al. 2009; Saggar et al. 2004).
2.4.3.1 Gases
The main atmospheric pollutants emitted by the dairy industry are: ammonia (NH3), nitrogen
dioxide (NO2), nitric oxide (NO) and GHG like CH4, CO2 and nitrous oxide (N2O) (Saggar et
al. 2004; United-Nations 2006). The gases are mainly due to animals metabolism (e.g., CH4),
the energy consumption necessary to operate barns and transport of raw materials and products, in addition to the transformation and preservation processes such as pasteurization, sterilization and refrigeration (Bertsch 2005; Ramirez et al. 2006). The dairy sector worldwide
10
emissions were near 1970 million tons of CO2 equivalent in 2007 (4% of the total emissions of
GHG) (FAO 2010). Milk production is responsible for 2.6% of global emissions of GHG in 2007 (FAO 2010). In the world, the average emission rates linked to the production of 1 kg of milk and 1 kg of cheese are 1 kg of CO2 equivalent/kg milk and 8.8 kg CO2 equivalent/kg
cheese (Guignard et al. 2009). Therefore, the dairy industry is an important source of GHG.
2.4.3.2 Liquid effluents and consumption of water
The predominant environmental problem from the dairy industry is the large quantity of wastewater which is generated in two focal points: transformation processes and cleaning (CAR/PL 2002). The liquid effluents present high loads of organic matter from 2 to 10.2 g chemical oxygen demand (COD)/L; as well as phosphorus (P) and nitrogen (N) with loads up to 150 mg/L (phosphates (PO43-) and pyrophosphates (P2O74-)) and 663 mg/L (organic
nitrogen; ammonium (NH4+); nitrites (NO2-) and nitrates (NO3-)) (Cristian 2010; Demirel et al.
2005; Omil et al. 2003). In terms of the COD, its value can be higher than 60 g COD/L in streams from dairy products production (e.g., liquid stream from the cheese manufacturing, i.e. the whey) (Demirel et al. 2005; Omil et al. 2003).
Another point of consideration in understanding the environmental impact of the dairy industry is the rate of water consumption expressed as water footprint. For example, to produce 1 L of milk and 1 kg of cheese, 1 m3 and 5 m3 of fresh water are needed, respectively (Guignard et al. 2009; Mekonnen and Hoekstra 2010; Ridoutt and Pfister 2010).
2.4.3.3 Solid waste
Manure is the most important solid waste in the dairy industry. Solid cattle manure can contain up to 5 kg of N (NH4+, NH3), 2.2 kg of P (phosphorus pentoxide (P2O5)), and 5 kg of K
(potassium oxide (K2O)) per metric ton of solid manure (Pennington et al., 2009; USEPA,
2012). Therefore, dry manure must be well managed because it can increase the salinity, pH and the concentrations of NH4+ and NO3- in soils and emissions of NH3 gas by decomposition
of manure. Ammonia can cause respiratory illness (CDC 2017c; Lehtomäki et al. 2007; Moral et al. 2005).
2.5
Whey
Whey is the liquid portion of milk which is obtained during the milk coagulation to produce cheese. Whey presents a high organic load (COD around 68 g/L) and thus it should be treated before being released to the environment as wastewater (Saddoud et al. 2007). Whey can also be valorized in high value added products such as nutritional food (e.g. as an additive for milk intended for children) and used in drugs manufacturing (Gunasekaran et al. 2007). In addition, whey can be used to obtain fermentative products such as alcohols (e.g., ethanol or 2,3-BD) or biogas (Chatzipaschali and Stamatis 2012; de Wit 2001; Dragone et al. 2009; Parra Huertas 2009; Perego et al. 2000). The valorization of whey depends on its composition which is a result of different factors including (1) the animal source of milk, (2) the kind of animal feed, (3) the stage of lactation, (4) the season of the year, (5) the acidity of whey and, (6) how the
11
cheese is processed (Madureira et al. 2007; Pescuma et al. 2015; Pintado et al. 2001). Figure 2.1 shows an overall scheme of the different processes used to valorize the whey produced by the dairy industry.
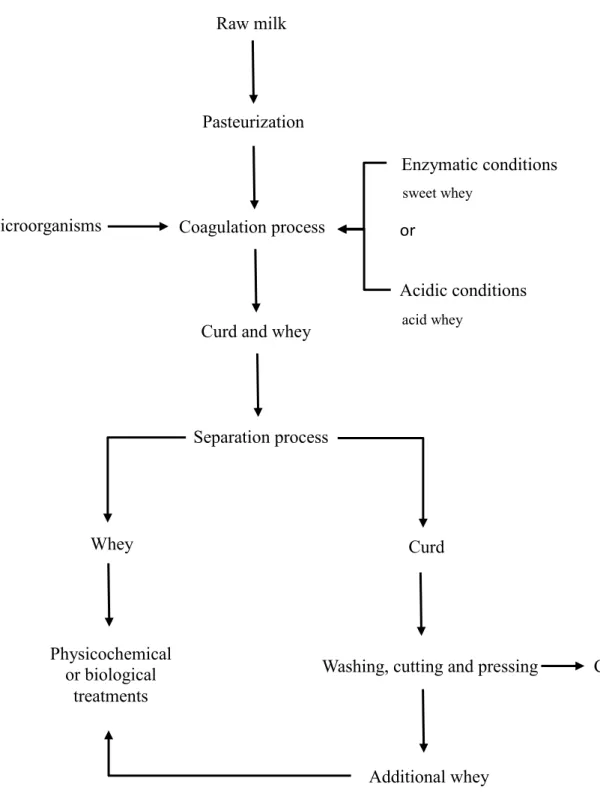
2.5.1
Whey generation
Figure 2.2 shows a simplified schematic representation of cheese and whey production from milk transformation. Raw milk is treated using a pasteurization process (a thermal process to reduce the population of pathogens). After the pasteurization stage, a culture of microorganisms (e.g., a strain of Lactobacillus or Streptococcus) is inoculated to the pasteurized milk to transform lactose into lactic acid (Miranda et al. 2009). Then, the coagulation process is performed. If the coagulation is carried out by rennet (complex of enzymes composed primarily of chymosin and pepsin), a sweet whey is generated (Miranda et al. 1989; Panesar et al. 2007); while if the coagulation process is performed by organic acids (e.g., acetic acid), an acid whey is obtained (Pintado et al. 2001). During the coagulation process, curd and whey are produced and thus have to be separated. The curd is then washed, cut, and pressed generating additional whey (Spalatelu 2012; Türkmenoglu 2006).
The cheese production has increased worldwide from 1.9x10⁷ in 2005, to 2.2x10⁷ tons in
2013. Hence, the whey generation around the world is estimated between 1.7x10¹¹ L in 2005, to near 1.9x10¹¹ L in 2013 (FAO-FAOSTAT 2017d; Smithers 2015). According to the CDIC (2017f), the production of cheese was 4.3x10⁸ kg in Canada in 2013 (i.e. 3.9x10⁹ L of whey).
2.5.2
Composition of whey
Whey is mainly composed of water which represents 93-95% (w/w) and contains around 50% of milk nutrients (Lievore et al. 2015). In 1 L of whey, there are between 60 and 70 g of solids (de Wit 2001; Panesar et al. 2007). The dry matter fraction is composed as follows: 66-77% (w/w) of lactose, 8-15% (w/w) of proteins and 7-15% (w/w) of minerals; and a lower portion of non-protein nitrogen (e.g., amino acids), vitamins (e.g., vitamins A, D and B5), trace elements (e.g., zinc) and proteins (e.g., lactoperoxidase) (Casper et al. 1998; Chegini and Taheri 2013; de Wit 2001; Ghaly et al. 2003; Panesar et al. 2007). The proteins of whey are albumins (up to 90% w/w), lactoferrin and immunoglobulins, which represent approximately 20% w/w of milk proteins (Keri Marshall 2004; Patel 2015). These proteins have antiviral, antimicrobial and antioxidative properties and thus whey proteins have become a very valued product in the food industry (Madureira et al. 2007; Patel 2015).
12
13
Figure 2.2: Whey production during cheese manufacturing
Cheese Raw milk Pasteurization Coagulation process Enzymatic conditions Microorganisms
Curd and whey
Curd Separation process
Washing, cutting and pressing Whey Additional whey Acidic conditions sweet whey acid whey Physicochemical or biological treatments or
14
2.5.3
Acidity of whey
Milk coagulation is performed to generate curd and whey. The coagulation process determines the acidity and the composition of whey. Table 2.1 shows the differences between both types of whey depending on the generation process.
1) Sweet whey has a pH value around 6.5 and contains near 70 g/L of dry matter. The composition of dry matter is mainly formed by up to 77% (w/w) of lactose, up to 15% (w/w) of proteins, 15% (w/w) of minerals, up to 3% (w/w) of lactic acid besides trace elements, vitamins and minor proteins (Hernández-Rojas and Vélez-Ruiz 2014; Panesar et al. 2007; Pescuma et al. 2015; Tsakali et al. 2010).
2) Acid whey has a pH value, between 4.5 and 4.7 and contains nearly 70 g/L of dry matter mainly formed by up to 72% (w/w) of lactose, up to 15% (w/w) of proteins, up to 15% (w/w) of minerals and up to 13% (w/w) of lactic acid. When comparing sweet and acid wheys, it is possible to observe a smaller amount of lactose present in acid whey. This is due to a higher formation of lactic acid in the acid whey (Hernández-Rojas and Vélez-Ruiz 2014; Panesar et al. 2007; Pescuma et al. 2015; Tsakali et al. 2010).
Table 2.1: Composition of sweet and acid wheys. Source: Hernández-Rojas and Vélez-Ruiz (2014); Panesar et al. (2007); Pescuma et al. (2015); Tsakali et al. (2010).
*Data based on the percentage (w/w) of the dry matter
2.5.4
Whey as an environmental problem
Whey is the most polluting substance issued from the manufacture of cheese (Prazeres et al. 2012). It has been estimated that only 50% of the whey is valorized into different products used in the food and chemical industries (Baldasso et al. 2011; Koutinas et al. 2014; Panesar et al. 2007). When whey is released as a wastewater, it can cause environmental problems. In order to be able to discharge the effluent in the environment, whey must be treated, for
Components Sweet whey (% (w/w))
Acid whey (% (w/w))
Enzymatic production Acid production
Water 93 – 94 93 – 95 Dry matter 6.0 – 7.0 5.0 – 7.0 Lactose* 70 – 77 66 – 72 Proteins* 8 – 15 8 – 15 Minerals* 7 – 15 7 – 15 Lactic acid* Up to 3 10 – 13
15
example, by an ozonation treatment with hydrogen peroxide (Martins and Quinta-Ferreira 2010). This allows lactose and the rest of the organic loads of the whey to be degraded into CO2 and water (H2O) thus decreasing its negative environmental impact.
2.5.5
Processes applied to treat whey
Whey can directly be used as an animal food supplement since it is a source of proteins and minerals, or as a fertilizer without treatment (Audic et al. 2003; Baldasso et al. 2011; Schaafsma 2008). It is also possible to treat whey as a raw material in order to obtain added-value products (de Wit 2001; Karadag et al. 2015).
2.5.5.1 Physical and physicochemical processes
Whey can be treated by coagulation-flocculation using chemical compounds, such as iron (III) chloride (FeCl3) or iron (II) sulfate (FeSO4), to decrease the COD present in the whey.
However, it is also possible to use membranes to obtain products (e.g., proteins) from whey (Canli 2005). Whey protein concentrates (WPC) are used in food such as emulsifier (Parra Huertas 2009; Rebouillat and Ortega-Requena 2015; Walzem et al. 2002). Whey possesses fat and casein particles in suspension which can be removed using a microfiltration process to prevent the obstruction of the ultrafiltration membranes (Das et al. 2015). The streams after recovering WPC by ultrafiltration is named permeate whey and contains a lactose concentration higher than 80 g/L of permeate (Becerra et al. 2015; de Wit 2001; FEDNA 2017; INTI 2017; USDairy 2017). Nanofiltration is also used to remove salts from whey. The non-salts whey can be used as follows: (1) in the food industry because it has a low salt content and thus prevents illnesses, such as hypertension; (2) in the pharmaceutical industry; and (3) in the chemical industry to make sugar-cellulose fibers (de Wit 2001; Minhalma et al. 2007; Rebouillat and Ortega-Requena 2015). The demineralization process can also be used to manufacture additives for milk intended for children (Parra Huertas 2009). The removal of lactose from whey, by crystallization or by using hollow fiber membranes, can be used in the pharmaceutical industry to make tablets for people unable to digest lactose; or lactose can be hydrolyzed to produce glucose and galactose which could be valorized by chemical or biological processes (Audic et al. 2003; Das et al. 2015; de Wit 2001).
2.5.5.2 Biological processes
Whey can be fermented to produce biogas, H2, lactic acid, and different types of alcohols,
such as ethanol, butanol and 2,3-BD (Roncal et al. 2010; Roncal et al. 2009).
1. Biogas
Biogas can be produced by anaerobic digestion of organic compounds (García et al. 2012). In this regard, whey can be used as feedstock because it contains lactose which could be fermented by microorganisms (e.g., Methanobacterium) under strict anaerobic conditions to
16
produce a biogas containing 50-70% (v/v) of CH4, 30-40% (v/v) of CO2 and 1-10% (v/v) of
H2 (COITAVC 2011; Ukpai and Nnabuchi 2012). The biogas yield depends mainly on the
temperature and pH. If bacteria are mesophilic, the optimal temperature is ranged between 30 and 40ºC, while if bacteria are thermophilic, the temperature is ranged between 50 and 60ºC (Gerardi 2003; Khanal 2008). In the case of the pH, methanogenic bacteria produce biogas when the pH value is close to neutral (Ertem 2011). Whey as a culture medium (50 mL in serum bottles) produced around 23 L CH4/L whey at 35ºC in 68 days (Ergüder et al. 2001). In
Quebec (Canada), around 200000 m3 of biogas/year are produced using more than 5 million of liters of whey (Chatzipaschali and Stamatis 2012).
2. Hydrogen
Traditionally, H2 is derived from fuel processing (e.g., hydrocarbon reforming or pyrolysis); or
from water (e.g., hydrolysis) but H2 can also be obtained by anaerobic fermentation. Its
production has been widely studied as an energy source in order to substitute fossil fuels due its higher heating value (HHV) of 142 kJ/g (Blanco Londoño and Rodríguez Chaparro 2012; Holladay et al. 2009; Pescuma et al. 2015; Sinha and Pandey 2011; USDE 2017). Nowadays, only 1% of worldwide production of H2 is produced by anaerobic fermentation using
microorganisms such as Clostridia (Ferchichi et al. 2005; Venetsaneas et al. 2009; Wu et al. 2008). For a day of production, 25 L of H2 per L of whey were produced by means of
fermentation in a 2-stage process (1 bar and 22ºC). A yield of 2.8 moles of H2/mol of lactose
was attained using granular sludge (an aggregate of microorganisms) (Cota-Navarro et al. 2011).
3. Lactic acid
Lactic acid has several applications in food, pharmaceutical, and chemical industries to give flavor (to increase the sweetness) and texture of products, and as a precursor of biodegradable polymers (Narayanan et al. 2004; Pescuma et al. 2008; Vijayakumar et al. 2008). Currently, near 90% of lactic acid produced around the world comes from the fermentation of saccharides by lactic acid bacteria (LAB) (Pescuma et al. 2015). These bacteria can use whey and thereafter hydrolyze the lactose in order to produce glucose and galactose (Black 2012; Pescuma et al. 2015). Glucose can be transformed into pyruvic acid by means of glycolysis, and the pyruvic acid can be fermented by lactic acid bacteria (e.g., Lactobacillus) into lactic acid (Hugenholtz and Kleerebezem 1999). Therefore, whey is a potential feedstock for fermentation processes due to its high content of lactose. For instance, up to 95% w/v of lactose from the whey can be transformed into lactic acid by Lactobacillus casei at 37ºC, pH 6.5 and 100 rpm, producing 0.84 g lactic acid/g of lactose for a reaction time of 36h (Panesar et al. 2010). The yield and concentration of lactic acid can be higher using a different species of Lactobacillus. A yield of 0.98 g lactic acid/g lactose was obtained for a reaction time of around 24h at 45ºC and pH 5.0 with L. bulgaricus NRRL B-548 (Venkatesh et al. 1993), whereas, Burgos-Rubio et al. (2000) found a lactic acid yield near 1.2 g lactic acid/g lactose for a reaction time of around 10h at 42ºC and pH 5.6 using the same bacteria (Burgos‐Rubio et al. 2000).