DIVERSITY AMONG GENOTYPES OF CONILON COFFEE SELECTED IN
ESPÍRITO SANTO STATE
DIVERSIDADE ENTRE GENÓTIPOS DE CAFÉ CONILON SELECIONADOS NO
ESTADO DO ESPÍRITO SANTO
Wagner Nunes RODRIGUES1; Marcelo Antonio TOMAZ2; Maria Amélia Gava FERRÃO3; Romário Gava FERRÃO4; Aymbiré Francisco Almeida da FONSECA3
1. D. Sc., Pós-Doutorando pelo Programa de Pós-Graduação em Produção Vegetal, Centro de Ciências Agrárias - CCA, Universidade Federal do Espírito Santo - UFES, Alegre, ES, Brazil. [email protected]; 2. D. Sc., Departamento de Produção Vegetal - CCA-UFES, Alto Universitário, Alegre, Espírito Santo, Brazil; 3. D. Sc., Empresa Brasileira de Pesquisa Agropecuária, EMBRAPA
CAFÉ, Parque Estação Biológica, PqEB, Brasília, Brazil; 4. D. Sc., Instituto Capixaba de Pesquisa, Assistência Técnica e Extensão Rural, INCAPER, Vitória, ES, Brazil.
ABSTRACT: The use of multivariate techniques for factor analysis is an efficient alternative for coffee breeding programs. This study aimed to evaluate the genetic diversity of 60 genotypes of conilon coffee based on agronomic performance in the northern state of Espírito Santo and to estimate the relative contribution of different agronomic characteristics towards the diversity of the species. The data were collected in an experiment conducted on the Experimental Farm of Bananal do Norte (Instituto Capixaba de Pesquisa, Assistência Técnica e Extenção Rural – INCAPER) in the southern state of Espírito Santo, and 12 agronomic characteristics were evaluated over four sequential harvests (4 years). Significant differences between the genotypes were observed for all of the characteristics, indicating the possibility of exploiting the high genetic variability to classify the genotypes into different groups based on their similarities. Of the agronomic characteristics, the duration of the ripening cycle was the variable that contributed the most to the variability among the 60 genotypes, with a relative contribution of 70.02%.
KEYWORDS: Coffea canephora. Breeding. Biometrics. Clones. INTRODUCTION
Coffea canephora presents high cross-fertilisation and self-incompatibility; therefore, populations of this species of coffee tend to express significant variability with regard to many agronomic traits, such as plant architecture, duration of ripening cycle, uniformity of maturation, size and weight of grains, susceptibility to coffee pests, and productive potential (FONSECA, 1999).
Since 1985, the Instituto Capixaba de Pesquisa, Assistência Técnica e Extenção Rural (INCAPER), formerly Empresa Capixaba de Pesquisa Agropecuária (Emcapa), has been developing a breeding programme for conilon coffee, selecting and evaluating genotypes with desirable agronomic characteristics, assembling and recombining the superior genetic material, and ensuring the continued genetic variability of the species (FONSECA et al., 2008). With the breeding program, INCAPER was responsible for releasing nine cultivars of conilon coffee, recommended for the State of Espírito Santo, 8 clonal cultivars (Emcapa 8111, Emcapa 8121, Emcapa 8131, Emcapa 8141 “Robustão Capixaba”, Incaper 8142 “Conilon Vitória”, Incaper 8112 “Diamante”, Incaper 8122 “Jequiitibá” and Incaper 8132
“Centenária“) and 1 propagated by seeds (Emcaper 8151 “Robusta Tropical”).
For years, the main criterion for the selection of coffee genotypes to be used in new cultivars was the crop yield. However, the current breeding programmes have been investigating several others agronomic characteristics with the objective of increasing the efficiency of the selection process (SEVERINO et al., 2002).
For the process of plant breeding, studies about genetic diversity are essential to provide information for the identification of desirable parents, which can be used for crossings and allow the exploitation of heterosis, ensuring a greater chance of success in the recovery of superior genotypes in segregating generations. Furthermore, studies on genetic diversity can allow inferences to be made about the genetic basis of the studied population (ALI et al., 1995; CRUZ et al., 1994; FALCONER, 1981).
The use of multivariate techniques for factor analysis is an efficient alternative for coffee breeding programmes (FERREIRA et al., 2005). Using a set classification criteria, cluster analysis aims to bring together genotypes into groups that present higher homogeneity for the measured characteristics, which highlights the heterogeneity between groups (FONSECA et al., 2006). This
procedure requires the estimation of the similarity or dissimilarity between genotypes and the adoption of a clustering technique to form the groups (CRUZ & REGAZZI, 1994).
This study aimed to evaluate the genetic diversity of 60 genotypes of conilon coffee based on their agronomic performance in the northern state of Espírito Santo and to estimate the relative contribution of different agronomic characteristics to the diversity of the species.
MATERIAL AND METHODS
The experiment was established in May 2004 at the Experimental Farm of Bananal do Norte, led by INCAPER in the Pacotuba district, municipality of Cachoeiro de Itapemirim, southern state of Espírito Santo. The region has an altitude of 140 m and soil classified as dystrophic oxisol. The climate is classified as Cwa according to the Kopen classification, with well-defined climate seasons involving rainy summers and dry winters. The annual rainfall is near 1,200 mm, and the annual mean temperature is 23 °C.
The genotypes of Coffea canephora Pierre ex Froehner were selected in the northern state of Espírito Santo by the breeding programme developed by INCAPER and installed in a competition field. Within the selection, 60 genotypes were sampled in the same proportions within populations of different ripening cycles (early: 01, 02, 03, 04, 05, NP-06, NP-07, NP-08, NP-09, NP-10, NP-11 NP-12, 13, 14, 15, 16, 17, 18, NP-19, and NP-20; intermediate: NI-01, NI-02, NI-03, NI-04, NI-05, NI-06, NI-07, NI-08, NI-09, NI-10, NI-11 NI-12, NI-13, NI-14, NI-15, NI-16, NI-17, NI-18, NI-19, and NI-20; and late: NT-01, NT-02, 03, 04, 05, 06, 07, 08, NT-09, NT-10, NT-11 NT-12, NT-13, NT-14, NT-15, NT- 16, NT-17, NT-18, NT-19, and NT-20).
The experiment followed a statistical design of randomised blocks, with four replications and experimental plots composed of four plants arranged in a line, planted with a spacing of 3.5 x 1.2 meters.
The agronomic traits were evaluated over the first four harvests, between 2006 and 2009, and the mean of 4 years for each characteristic were calculated.
The severity of naturally occurring pests, such as leaf rust (Hemileia vastatrix – RUS), brown eye spot (Cercospora coffeicola – BES), dieback (DIE), and leaf miners (Leucoptera coffeella – LMI), was evaluated accord to descriptive scales based on the method proposed by Eskes & Costa
(1983). The scales establish different levels of severity between score 1, corresponding to the absence of injury, and score 9, indicating a large number of affected leaves or diseased branches, with significant leaf fall.
The canopy size (CAN) was evaluated with a descriptive scale using scores from 1 to 3, where 1 is low, 2 is medium, and 3 is high. The vegetative vigour (VIG), expressing the potential of development and growth of the plant, was asserted using scores from 1 (not productive, notably depleted, and presenting severe defoliation) to 10 (maximum vigour). The plants were evaluated with a visual assessment index (VAI), demonstrating their potential for development even when subjected to environmental and metabolic stresses, and were evaluated with scores from 1 to 10, where higher scores correspond to better development.
The fruit size (SIZ) was studied using scores from 1 to 5 according to size classes based on the descriptors of the Serviço Nacional de Proteção de Cultivares (SNPC), which features five classes: very small, small, medium, large, and very large (Guerreiro Filho et al. 2,008).
The uniformity of maturation (UNI) was evaluated using a scale from 1 to 3, where 1 corresponds to over 90% mature fruits, 2 corresponds to intermediate maturation, and 3 corresponds to uneven maturation, with less than 50% mature fruit and the presence of fruits from all stages of maturation.
The percentage of fruits with empty locules (FEL) was determined through separation and direct counting of the fruits with this defect.
After ripening, the fruits of each experimental plot were harvested, dried, processed, and weighed to determine the mass of processed coffee, in bags of 60 kg, produced by each genotype, in each plot. Using the spacing and the number of plants that would fit in one hectare, the value of the plots were converted to crop yield (YIE), expressed in bags of 60 kg of processed coffee per hectare per year.
The duration of the ripening cycle (CYC) was evaluated in days between flowering and the full maturation of the fruits when they reach a level sufficient to perform the harvest (FERRÃO et al., 2007).
The experiment was conducted following the current management practices recommended for the cultivation of conilon coffee in the Espírito Santo state (FERRÃO et al., 2007; PREZOTTI et al., 2007).
The data were subjected to analysis of variance by the F test (at 1 and 5% probability) and,
based on the detection of significant differences between genotypes, were classified into homogeneous groups according to the Scott-Knott criteria.
The genetic divergence was assessed by means of multivariate cluster analysis. The Mahalanobis distance was used as a dissimilarity measure, from which a dendrogram was constructed using the nearest neighbour method. The optimisation technique based on the method proposed by Tocher and cited by Rao (1952) was used for delineation of the groups. The relative importance of each agronomic characteristic was calculated by the method proposed by Singh (1981) based on the total partition of the estimative of dissimilarity between pairs of individuals. The analyses were performed with the statistical software GENES (CRUZ, 2013).
RESULTS AND DISCUSSION
The analysis of variance indicated the presence of significant differences among genotypes for all agronomic characteristics evaluated in the experiment, indicating the expression of variability. Other genetic studies involving C. canephora also highlighted the existence of differences between genotypes regard different characteristics, such as crop yield, number of orthotropic and plagiotropic branches emitted per plant, canopy size, plant height, fruit size, beverage quality, maturation cycle,
percentage of fruits with empty locules, length of reproductive branches, and stem diameter (FONSECA, 1999; FERREIRA, 2003; FONSECA et al., 2006; FERRÃO et al., 2008).
These results demonstrate the significant variability that exists for this species, an initial condition that is favourable for a breeding programme designed to enhance those agronomic characteristics, making it possible to identify genotypes with superior characteristics and to explore those in breeding programs.
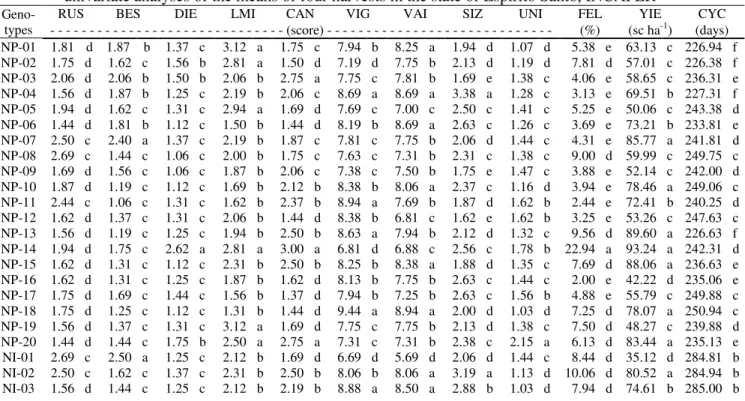
In the univariate study, according to the Scott-Knott criteria, there were distinct groupings for all of the agronomic traits (Table 1). It was possible to identify a large number of different groups for fruit size and duration of the ripening cycle, followed by the percentage of fruits with empty locules; six and five homogeneous groups were formed, respectively. For rust severity, canopy size, vigour, visual assessment index, uniformity of maturation, and crop yield, the genotypes formed four groups. For brown eye spot and dieback severities, it was possible to identify three homogeneous groups. Among all of the characteristics, there was greater homogeneity for the means of severity of leaf miners, with the differentiation of only two statistically distinct groups; therefore, this is one of the traits with lesser variability within the set of agronomic traits studied in the experiment.
Table 1. Grouping of 60 genotypes of conilon coffee in terms of 12 agronomic characteristics based on univariate analyses of the means of four harvests in the state of Espírito Santo, INCAPER
Geno-types
RUS BES DIE LMI CAN VIG VAI SIZ UNI FEL YIE CYC - - - (score) - - - (%) (sc ha-1) (days) NP-01 1.81 d 1.87 b 1.37 c 3.12 a 1.75 c 7.94 b 8.25 a 1.94 d 1.07 d 5.38 e 63.13 c 226.94 f NP-02 1.75 d 1.62 c 1.56 b 2.81 a 1.50 d 7.19 d 7.75 b 2.13 d 1.19 d 7.81 d 57.01 c 226.38 f NP-03 2.06 d 2.06 b 1.50 b 2.06 b 2.75 a 7.75 c 7.81 b 1.69 e 1.38 c 4.06 e 58.65 c 236.31 e NP-04 1.56 d 1.87 b 1.25 c 2.19 b 2.06 c 8.69 a 8.69 a 3.38 a 1.28 c 3.13 e 69.51 b 227.31 f NP-05 1.94 d 1.62 c 1.31 c 2.94 a 1.69 d 7.69 c 7.00 c 2.50 c 1.41 c 5.25 e 50.06 c 243.38 d NP-06 1.44 d 1.81 b 1.12 c 1.50 b 1.44 d 8.19 b 8.69 a 2.63 c 1.26 c 3.69 e 73.21 b 233.81 e NP-07 2.50 c 2.40 a 1.37 c 2.19 b 1.87 c 7.81 c 7.75 b 2.06 d 1.44 c 4.31 e 85.77 a 241.81 d NP-08 2.69 c 1.44 c 1.06 c 2.00 b 1.75 c 7.63 c 7.31 b 2.31 c 1.38 c 9.00 d 59.99 c 249.75 c NP-09 1.69 d 1.56 c 1.06 c 1.87 b 2.06 c 7.38 c 7.50 b 1.75 e 1.47 c 3.88 e 52.14 c 242.00 d NP-10 1.87 d 1.19 c 1.12 c 1.69 b 2.12 b 8.38 b 8.06 a 2.37 c 1.16 d 3.94 e 78.46 a 249.06 c NP-11 2.44 c 1.06 c 1.31 c 1.62 b 2.37 b 8.94 a 7.69 b 1.87 d 1.62 b 2.44 e 72.41 b 240.25 d NP-12 1.62 d 1.37 c 1.31 c 2.06 b 1.44 d 8.38 b 6.81 c 1.62 e 1.62 b 3.25 e 53.26 c 247.63 c NP-13 1.56 d 1.19 c 1.25 c 1.94 b 2.50 b 8.63 a 7.94 b 2.12 d 1.32 c 9.56 d 89.60 a 226.63 f NP-14 1.94 d 1.75 c 2.62 a 2.81 a 3.00 a 6.81 d 6.88 c 2.56 c 1.78 b 22.94 a 93.24 a 242.31 d NP-15 1.62 d 1.31 c 1.12 c 2.31 b 2.50 b 8.25 b 8.38 a 1.88 d 1.35 c 7.69 d 88.06 a 236.63 e NP-16 1.62 d 1.31 c 1.25 c 1.87 b 1.62 d 8.13 b 7.75 b 2.63 c 1.44 c 2.00 e 42.22 d 235.06 e NP-17 1.75 d 1.69 c 1.44 c 1.56 b 1.37 d 7.94 b 7.25 b 2.63 c 1.56 b 4.88 e 55.79 c 249.88 c NP-18 1.75 d 1.25 c 1.12 c 1.31 b 1.44 d 9.44 a 8.94 a 2.00 d 1.03 d 7.25 d 78.07 a 250.94 c NP-19 1.56 d 1.37 c 1.31 c 3.12 a 1.69 d 7.75 c 7.75 b 2.13 d 1.38 c 7.50 d 48.27 c 239.88 d NP-20 1.44 d 1.44 c 1.75 b 2.50 a 2.75 a 7.31 c 7.31 b 2.38 c 2.15 a 6.13 d 83.44 a 235.13 e NI-01 2.69 c 2.50 a 1.25 c 2.12 b 1.69 d 6.69 d 5.69 d 2.06 d 1.44 c 8.44 d 35.12 d 284.81 b NI-02 2.50 c 1.62 c 1.37 c 2.31 b 2.50 b 8.06 b 8.06 a 3.19 a 1.13 d 10.06 d 80.52 a 284.94 b NI-03 1.56 d 1.44 c 1.25 c 2.12 b 2.19 b 8.88 a 8.50 a 2.88 b 1.03 d 7.94 d 74.61 b 285.00 b
Geno-types
RUS BES DIE LMI CAN VIG VAI SIZ UNI FEL YIE CYC - - - (score) - - - (%) (sc ha-1) (days) NI-04 2.12 d 1.81 b 1.12 c 3.12 a 2.37 b 8.25 b 7.94 b 2.88 b 1.06 d 13.75 c 60.94 c 284.81 b NI-05 2.56 c 2.00 b 1.31 c 2.94 a 1.25 d 6.69 d 6.31 d 2.13 d 1.44 c 6.13 d 42.84 d 284.69 b NI-06 2.75 c 1.94 b 1.37 c 3.00 a 2.37 b 7.63 c 6.88 c 2.50 c 1.38 c 24.44 a 66.40 b 285.06 b NI-07 2.06 d 1.94 b 1.37 c 2.06 b 1.69 d 7.50 c 7.06 c 3.13 a 1.38 c 9.69 d 53.55 c 284.81 b NI-08 2.62 c 1.69 c 1.00 c 2.56 a 2.00 c 8.38 b 8.31 a 3.25 a 1.10 d 12.12 c 79.45 a 285.25 b NI-09 3.00 c 2.40 a 1.44 c 2.81 a 2.06 c 6.94 d 6.44 d 2.38 c 1.31 c 4.25 e 56.45 c 284.94 b NI-10 2.25 d 1.87 b 1.25 c 2.69 a 1.50 d 8.25 b 7.63 b 2.94 b 1.50 b 13.06 c 70.76 b 285.88 b NI-11 2.50 c 1.50 c 1.62 b 2.69 a 2.44 b 8.06 b 7.56 b 1.44 f 1.25 c 11.94 c 76.71 b 285.69 b NI-12 1.62 d 1.56 c 1.00 c 2.37 b 2.37 b 9.00 a 7.75 b 2.00 d 1.19 d 2.81 e 62.50 c 285.88 b NI-13 3.25 b 1.94 b 1.06 c 2.94 a 1.62 d 8.38 b 7.88 b 1.69 e 1.00 d 8.25 d 57.16 c 285.81 b NI-14 2.94 c 1.81 b 1.31 c 2.69 a 1.62 d 8.06 b 7.63 b 2.00 d 1.29 c 4.19 e 65.67 b 285.69 b NI-15 2.50 c 1.81 b 1.06 c 1.87 b 2.06 c 7.56 c 7.13 c 2.50 c 1.25 c 5.19 e 52.71 c 285.63 b NI-16 1.94 d 1.87 b 1.19 c 3.00 a 1.75 c 8.25 b 7.19 b 2.44 c 1.10 d 4.63 e 40.91 d 285.75 b NI-17 3.75 a 2.12 b 1.06 c 2.44 b 1.87 c 7.75 c 7.31 b 2.25 c 1.19 d 16.00 b 60.05 c 285.94 b NI-18 2.19 d 2.06 b 1.56 b 2.25 b 2.12 b 8.19 b 7.88 b 2.50 c 1.13 d 3.50 e 57.43 c 285.44 b NI-19 3.56 b 2.56 a 1.31 c 3.19 a 1.69 d 6.44 d 6.06 d 2.69 c 1.69 b 6.25 d 38.40 d 285.88 b NI-20 3.12 b 1.94 b 1.50 b 1.62 b 2.75 a 8.06 b 7.69 b 2.75 c 1.41 c 11.50 c 74.13 b 285.31 b NT-01 2.56 c 1.62 c 1.12 c 2.19 b 1.37 d 8.63 a 7.56 b 2.31 c 1.69 b 7.81 d 80.66 a 312.63 a NT-02 2.25 d 1.50 c 1.12 c 3.81 a 2.94 a 8.88 a 7.31 b 1.63 e 1.47 b 14.94 b 91.50 a 314.56 a NT-03 4.25 a 2.37 a 1.69 b 2.12 b 2.44 b 7.25 c 6.13 d 1.63 e 2.03 a 2.50 e 62.17 c 314.56 a NT-04 1.81 d 2.19 a 1.12 c 2.81 a 1.94 c 8.63 a 7.38 b 2.56 c 1.25 c 16.75 b 52.42 c 311.63 a NT-05 2.50 c 2.44 a 1.19 c 2.87 a 1.94 c 7.75 c 6.50 c 1.69 e 1.94 a 4.94 e 49.97 c 312.56 a NT-06 3.31 b 2.56 a 1.62 b 2.87 a 2.69 a 7.06 d 5.88 d 2.38 c 1.75 b 4.00 e 57.67 c 314.81 a NT-07 2.44 c 1.87 b 1.00 c 2.25 b 1.44 d 8.81 a 5.88 d 1.50 e 1.53 b 3.00 e 31.44 d 313.19 a NT-08 2.44 c 1.81 b 1.19 c 3.00 a 1.25 d 8.25 b 6.69 c 1.31 f 1.47 c 11.81 c 53.43 c 310.25 a NT-09 2.87 c 1.94 b 1.25 c 2.25 b 2.50 b 8.06 b 7.50 b 2.69 c 1.47 c 15.69 b 81.03 a 311.88 a NT-10 2.25 d 1.37 c 1.19 c 2.87 a 2.75 a 8.06 b 6.88 c 2.63 c 1.41 c 9.44 d 67.06 b 310.38 a NT-11 2.87 c 2.06 b 1.19 c 2.81 a 2.00 c 8.38 b 8.25 a 3.19 a 1.53 b 6.19 d 80.36 a 312.56 a NT-12 2.06 d 1.69 c 1.25 c 2.87 a 2.19 b 8.44 b 8.13 a 3.13 a 1.34 c 7.38 d 71.90 b 311.56 a NT-13 3.25 b 1.50 c 1.06 c 3.00 a 2.56 b 8.13 b 7.19 b 1.44 f 1.47 c 6.13 d 81.12 a 315.63 a NT-14 2.19 d 2.00 b 1.25 c 2.87 a 2.44 b 8.88 a 7.25 b 1.75 e 1.59 c 6.63 d 72.17 b 310.50 a NT-15 2.31 d 1.50 c 1.00 c 2.94 a 1.37 d 8.63 a 7.13 c 2.63 c 1.69 b 7.50 d 50.12 c 316.56 a NT-16 2.94 c 2.50 a 1.12 c 3.31 a 2.00 c 8.56 a 7.44 b 1.19 f 1.09 d 12.44 c 56.18 c 316.69 a NT-17 1.94 d 1.87 b 1.44 c 2.56 a 2.12 b 6.88 d 6.25 d 2.81 c 1.81 b 8.56 D 37.53 d 314.19 a NT-18 1.94 d 1.81 b 1.25 c 3.25 a 1.94 c 7.94 b 7.75 b 3.19 a 1.56 b 16.12 B 50.39 c 310.56 a NT-19 2.75 c 1.75 c 1.25 c 4.06 a 2.56 b 7.44 c 6.56 c 1.13 f 1.50 b 8.00 D 62.47 c 313.88 a NT-20 2.19 d 1.87 b 1.12 c 2.81 a 2.37 b 8.63 a 7.25 b 3.25 a 1.34 c 8.44 D 67.25 b 312.19 a Means followed by the same letter in each column do not differ by the Scott-Knott test at 5% of probability. Agronomic characteristics: leaf rust severity (RUS), brown eye spot severity (BES), dieback severity (DIE), leaf miner severity (LMI), canopy size (CAN), vegetative vigour (VIG), visual assessment index (VAI), fruit size (SIZ), uniformity of maturation (UNI), percentage of fruits with empty locules (FEL), crop yield (YIE), and duration of ripening cycle (CYC).
The mean for crop yield over the four seasons was 63.58 bags per hectare, showing the significant productive potential of some genotypes and their ability to maintain this production throughout the years. It is worth noting that the overall mean of crop yield of the genotypes is approximately three times the overall mean for conilon coffee in the state of Espírito Santo. Furthermore, the means for the severity of the naturally occurring phytosanitary problems in the region were relatively low, without any highly severe scores. This fact demonstrates that those genotypes already show some resistance to the major coffee pests, resistance that was obtained during the selection processes used in the breeding programme from which they were extracted.
Regarding the dissimilarity between the pairs of genotypes, estimated by the Mahalanobis
distance, larger distances are observed between pairs of genotypes from populations with different ripening cycles, as observed between the genotypes NP-13 (early ripening) and NT-16 (late ripening), among which the largest distance were observed (D2= 604.49). The lowest dissimilarity was observed
between NT-12 and NT-20, both belonging to the late ripening cycle population with D2 equal to 7.61.
The genotype NP-14 stood out as one of the most dissimilar, in general, as well as the genotype NP-13, which belonged to 13 of the 30 largest distance groups observed in the study (01, NT-03, NT-05, NT-06, NT-07, NT-11, NT-12, NT-13, NT-15, NT-16, NT-17, NT-18, and NT-19). The genotype NI-15, although showing considerable distances for some genotypes (01, 02, NP-04, NP-13, NP-14, and NP-20), proved to be, in general, more similar to the others genotypes.
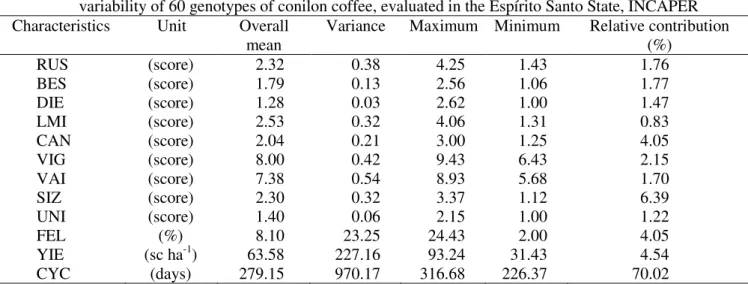
The relative contribution of each variable to the differentiation of the genotypes is shown in Table 2. The relative contribution of each agronomic trait in studies of genetic divergence can help to identify those most important for the differentiation of genotypes and can help identify
the characteristics that contribute less to the evaluation of the genetic material, allowing better planning and management of the selection to reduce the time and cost of the experimental evaluations (PEREIRA, 1989; CRUZ et al., 2006; FERRÃO, 2004).
Table 2. Descriptive analyses and relative contribution of 12 agronomic characteristics in the genetic variability of 60 genotypes of conilon coffee, evaluated in the Espírito Santo State, INCAPER Characteristics Unit Overall
mean
Variance Maximum Minimum Relative contribution (%) RUS (score) 2.32 0.38 4.25 1.43 1.76 BES (score) 1.79 0.13 2.56 1.06 1.77 DIE (score) 1.28 0.03 2.62 1.00 1.47 LMI (score) 2.53 0.32 4.06 1.31 0.83 CAN (score) 2.04 0.21 3.00 1.25 4.05 VIG (score) 8.00 0.42 9.43 6.43 2.15 VAI (score) 7.38 0.54 8.93 5.68 1.70 SIZ (score) 2.30 0.32 3.37 1.12 6.39 UNI (score) 1.40 0.06 2.15 1.00 1.22 FEL (%) 8.10 23.25 24.43 2.00 4.05 YIE (sc ha-1) 63.58 227.16 93.24 31.43 4.54 CYC (days) 279.15 970.17 316.68 226.37 70.02
Agronomic characteristics: leaf rust severity (RUS), brown eye spot severity (BES), dieback severity (DIE), leaf miner severity (LMI), canopy size (CAN), vegetative vigour (VIG), visual assessment index (VAI), fruit size (SIZ), uniformity of maturation (UNI), percentage of fruits with empty locules (FEL), crop yield (YIE), and duration of ripening cycle (CYC).
The duration of the ripening cycle was the variable that contributed the most to the variability among the genotypes, with a relative contribution of 70.02%. This result, combined with the importance that this agronomic trait has for planning the cultivation of this crop, particularly for predicting the period of harvest, demonstrates the importance of maintaining this characteristic in the experimental evaluations. The classification for maturation cycle allows the definition of groups of more homogeneous genotypes regarding the time when their fruits complete the process of physiological maturation and hence the determination of the period in which the harvest must be performed.
The clustering based on the Mahalanobis distance is presented in Figure 1. Considering a cutoff value of 0.70 for similarity in the dendrogram, six groups of genotypes can be delimited. Although the maturation cycle has been the most important feature to explain the genetic variability, the genotypes were not grouped together only using this feature.
Using the Tocher method (Table 3), nineteen genotype groups were formed. It is possible to observe the influence of the maturation cycle on the formation of groups, with the groups formed solely by genotypes of the same cycle. The groups I, IX, XI, and XVIII show a higher
proportion of genotypes from the early cycle, whereas the groups VI, XIV, XVII, and XIX contain a higher proportion of genotypes from the intermediate cycle, and the groups V, XII, and XIII contain genotypes from the late cycle. The groups II, III, IV, V, VII, VIII, X, XV, and XVI were formed by genotypes that did not show a specific cycle tendency.
The formation and characterisation of genotype groups are essential to guide the selection of parents in breeding programs, to establish combinations based on the magnitude of the dissimilarity between genotypes, and to explore the potential of parents by selecting dissimilar parents that also present high agronomic performance.
Cruz et al. (2004) suggest employing individuals with different patterns of dissimilarity in the breeding programs, evading the restriction of the genetic variability and providing greater gains through the selection process.
Figure 1. Dendrogram representing the similarity of 60 genotypes of conilon coffee based on the Mahalanobis distance obtained in the study of 12 agronomic characteristics in the Espírito Santo state, INCAPER. Table 3. Grouping of 60 genotypes of conilon coffee by the Tocher method based on 12 agronomic
characteristics and the means of four harvests in Espírito Santo state, INCAPER
Group Genotypes I NP-01, NP-02, NT-20, NP-10 II NP-07, NI-11 III NP-08, NI-10, NT-15, NP-14, NT-19 IV NP-09, NI-08 V NP-11, NI-07, NT-14, NT-17, NI-03, NT-10 VI NP-12, NI-09
VII NP-13, NI-06, NT-16, NT-12, NI-01
VIII NP-15, NI-12, NT-11, NT-08, NP-20 IX NP-16, NI-13, NT-07, NP-19 X NI-17, NT-13, NT-04, NI-20 XI NP-17, NP-18 XII NT-01, NT-05, NT-09 XIII NT-02, NT-18, NT-03
XIV NI-15, NI-19
XV NP-05, NI-02
XVI NI-16, NT-06
XVII NP-03, NI-04, NI-14
XVIII NP-04, NP-06, NI-18
CONCLUSIONS
The genotypes of conilon coffee selected in Espírito Santo state feature high diversity for all agronomic characteristics studied, making it possible to explore the genetic variability for the
classification of genotypes in different homogeneous groups.
The duration of the maturation cycle is the agronomic characteristic that has the highest relative contribution to the observed diversity.
RESUMO: A utilização de técnicas multivariadas de análise de fatores é uma alternativa eficiente utilizada no melhoramento genético do cafeeiro. O presente trabalho objetivou avaliar a divergência genética de 60 clones de café conilon, selecionados pelo seu desempenho no norte do Estado do Espírito Santo, e estimar a contribuição relativa de diferentes características agronômicas para a diversidade da espécie. Os dados foram coletados em experimento conduzido na Fazenda Experimental Bananal do Norte (INCAPER), considerando 12 características agronômicas, avaliadas através de médias de quatro safras. Diferenças significativas entre os genótipos foram observadas para todas as características avaliadas, indicando a possibilidade de exploração da alta variabilidade genética para a classificação dos genótipos em diferentes grupos homogêneos, baseado em suas similaridades. Dentre as características agronômicas, a duração do ciclo de maturação foi a variável que mais contribuiu para a variabilidade entre os 60 genótipos, com contribuição relativa de 70,02%.
PALAVRAS-CHAVE: Coffea canéfora. Melhoramento. Biometria. Clones. REFERENCES
ALI, M.; COPELAND, L. O.; ELIAS, S. G.; KELLY, J. D. Relationship between genetic distance and heterosis for yield and morphological traits in winter canola (Brassica napus L.). Theoretical and Applied Genetics, Heidelberg, v. 91, n. 1, p. 118-121, 1995. http://dx.doi.org/10.1007/bf00220867
CRUZ, C. D.; CARVALHO, S. P.; VENCOVSKY, R. Estudos sobre divergência genética. II. Eficiência da predição do comportamento de híbridos com base na divergência genética de progenitores. Revista Ceres, Viçosa, v. 41, n. 234, p. 183-190, 1994b.
CRUZ, C. D.; REGAZZI, A. J.; CARNEIRO, P. C. S. Modelos biométricos aplicados ao melhoramento genético. Viçosa: Imprensa Universitária, 2004. 480p.
CRUZ, C. D. GENES - a software package for analysis in experimental statistics and quantitative genetics. Acta Scientiarum. Agronomy, Maringá, v. 35, p. 271-276, 2013.
ESKES, A. B.; COSTA, W. M. Characterization of incomplete resistance to Hemileia vastatrix in the Icatu coffee population. Euphytica, Wageningen, v. 32, n. 1, p. 649-657, 1983.
http://dx.doi.org/10.1007/BF00021478
FALCONER, D. R. Introduction to quantitative genetics. 2. ed. London: Longman, 1981. 340 p.
FERRÃO, R. G.; FONSECA, A. F. A.; BRAGANÇA, S. M.; FERRÃO, M. A. G.; DE MUNER, L. H. Café Conilon. Vitória: INCAPER, 2007. 702p. http://dx.doi.org/10.1590/S0100-204X2008000100009
FERRÃO, R. G.; CRUZ, C. D.; FERREIRA, A.; CECON, P. R.; FERRÃO, M. A. G.; FONSECA, A. F. A.; CARNEIRO, P. C. S.; SILVA, M. F. Parâmetros genéticos em café Conilon. Pesquisa Agropecuária Brasileira, Brasília, v. 43, n. 1, p. 61-69, 2008.
FERREIRA, A.; CECON, P. R.; CRUZ, C. D.; FERRÃO, R. G.; SILVA, M. F.; FONSECA, A. F. A.; FERRÃO, M. A. G. Seleção simultânea de Coffea canephora por meio da combinação de análise de fatores e
índices de seleção. Pesquisa Agropecuária Brasileira, Brasília, v. 40, p. 1189-1195, 2005. http://dx.doi.org/10.1590/S0100-204X2005001200005
FERREIRA, A. Índice de seleção e análise de fatores na predição de ganhos genéticos em Coffea
canephora var. Conilon. 2003. 132f. Dissertação (Mestrado em Genética e Melhoramento) – Universidade
Federal de Viçosa. Viçosa, 2003.
FONSECA, A. F. A. Análises biométricas em café Conilon (Coffea canephora Pierre). 1999. 121f. Tese (Doutorado em Fitotecnia) – Universidade Federal de Viçosa. Viçosa, 1999. http://dx.doi.org/10.1590/S0100-204X2006000400008
FONSECA, A. F. A.; SEDIYAMA, T.; CRUZ, C. D.; SAKAYAMA, N. S.; FERRÃO, M. A. G.; FERRÃO, R. G. Divergência genética em café conilon (Coffea canephora Pierre). Pesquisa Agropecuária Brasileira, Brasília, v. 41, n. 5429, p. 599-605, 2006.
FONSECA, A. F. A.; FERRÃO, R. G.; FERRÃO, M. A. G.; VOLPI, P. S.; VERDIN FILHO, A. C.; FAZUOLI, L. C. Cultivares de café robusta. In: Carvalho, C. H. S. de. Cultivares de café: origem, características e recomendações. Brasília: Embrapa Café, 2008. p. 255-280.
GARCIA, C. H. Tabelas para classificação de coeficiente de variação. Piracicaba: IPEF, 1989. 12p. GUERREIRO FILHO, O.; SILVAROLLA, M. B.; CARVALHO, C. H. S.; FAZUOLI, L. C. Características utilizadas para a identificação de cultivares de café. In: Carvalho, C. H. S. Cultivares de café: origem, características e recomendações. Brasília: Embrapa-café, 2008. p. 141-155.
PEREIRA, A. V. Utilização da análise multivariada na caracterização de germoplasmas de mandioca (Manihot esculenta Crantz.). Piracicaba, 1989. 180 f. Dissertação (Doutorado em Agronomia) – Escola Superior de Agricultura Luiz de Queiroz. Piracicaba, 1989.
PREZOTTI, L. C.; GOMES, J. A.; DADALTO, G. G.; OLIVEIRA, J. A. Manual de recomendação de calagem e adubação para o Estado do Espírito Santo: 5ª aproximação. Vitória:
SEEA/INCAPER/CEDAGRO, 2007. 305p.
OLIVEIRA JÚNIOR, A. Metodologias de análise de dialelo circulante e de meia-tabela desbalanceados e correlações inter e intrapopulacionais: exemplo com a cultura do feijão (Phaseolus vulgaris L.). 1995. 136 f. Dissertação (Mestrado em Genética e Melhoramento) – Universidade Federal de Viçosa. Viçosa, 1995.
SEVERINO, L. S.; SAKIYAMA, N. S.; PEREIRA, A. A.; MIRANDA, G. V.; ZAMBOLIM, L.; BARROS, U. V. Associações da produtividade com outras características agronômicas de café (Coffea arabica L.
“Catimor”). Acta Scientiarum. Agronomy, Maringá, v. 24, p. 1467-1471, 2002.
SINGH, D. The relative importance of characters affecting genetic divergence. The Indian Journal of Genetic and Plant Breeding, New Delhi, v. 41, p. 237-245, 1981.