HAL Id: hal-03219828
https://hal.archives-ouvertes.fr/hal-03219828
Submitted on 6 May 2021
HAL is a multi-disciplinary open access
archive for the deposit and dissemination of
sci-entific research documents, whether they are
pub-lished or not. The documents may come from
teaching and research institutions in France or
abroad, or from public or private research centers.
L’archive ouverte pluridisciplinaire HAL, est
destinée au dépôt et à la diffusion de documents
scientifiques de niveau recherche, publiés ou non,
émanant des établissements d’enseignement et de
recherche français ou étrangers, des laboratoires
publics ou privés.
Distributed under a Creative Commons Attribution - NonCommercial - ShareAlike| 4.0
Toolpath planning optimization for end milling of
free-form surfaces using a clustering algorithm
Mahfoud Herraz, Jean-Max Redonnet, Mohammed Sbihi, Marcel Mongeau
To cite this version:
Mahfoud Herraz, Jean-Max Redonnet, Mohammed Sbihi, Marcel Mongeau. Toolpath planning
opti-mization for end milling of free-form surfaces using a clustering algorithm. Procedia CIRP,
ELSE-VIER, 2021, 99, pp.139-144. �10.1016/j.procir.2021.03.021�. �hal-03219828�
Toolpath planning optimization for end milling of free-form surfaces using
a clustering algorithm
Mahfoud Herraz
a, Jean-Max Redonnet
a, Mohammed Sbihi
band Marcel Mongeau
baUniversit´e Paul Sabatier and Institut Cl´ement Ader, Universit´e de Toulouse, France bENAC, Universit´e de Toulouse, France
Procedia CIRP, vol. 99, pp 139–144, 2020
14th CIRP Conference on Intelligent Computation in Manufacturing Engineering, 15-17 July 2020 DOI: 10.1016/j.procir.2021.03.021
Abstract
A two-step approach to address the toolpath planning optimization problem is introduced. The first step divides the surface into zones with similar local geometric properties in order to improve efficiency of toolpath planning algorithms. To do this, an unsupervised clustering algorithm (like K-means) is used on a mesh defined by isoparametric curves. The second step applies a toolpath planning algorithm to each zone, according to its optimal machining direction. This optimal direction is calculated using a black-box optimization software. The final goal is to enhance gradually the formulation of the optimization problem to obtain better and better results.
Keywords: end-milling; free-form surface; toolpath planning; clustering; black-box optimization
Contents
1 Introduction 1
2 Partitioning the surface by a clustering
algo-rithm 1
2.1 Formulating the clustering problem . . . 2 2.2 Running the K-means algorithm on the 4D
pa-rameter vectors . . . 3 2.3 Dividing disconnected zones . . . 3 3 Optimizing machining direction within each
zone 4
4 Discussion 5
5 Conclusion 6
1
Introduction
Tool path planning is a very important issue for the end milling of free-form surfaces, due to the high machining cost commonly observed for manufacturing high added value parts such as molds and stamping dies. Therefore, optimizing the toolpath planning process may lead to sig-nificant gains in terms of machining costs.
In order to make progress in optimizing toolpath plan-ning of free-form surface machiplan-ning, a two-step approach,
that we shall call C4DO1D1(pronounced “CADOID”), is
introduced in this paper. Because it is well established that toroidal cutter may lead to better results than its ball-end counterpart [1], this type of cutter have been chosen to carry on this study. Actually, a toroidal cut-ter provides betcut-ter results than a ball-end one when ma-chining along the steepest-slope direction, but when used perpendicularly to the steepest-slope direction, its per-formances are worse than those of a ball-end cutter. Be-cause the steepest-slope direction may vary a lot across a free-form surface, partitioning this surface into several zones (each of which will then be machined along an ap-propriate direction) is considered as the best approach to improve efficiency of the toroidal-cutter choice [2].
2
Partitioning the surface by a
clustering algorithm
In this section, a new method to define zones suitable for machining with a toroidal cutter is presented. This method relies on a clustering approach. Clustering rithms are part of unsupervised machine learning algo-rithms. From an initial set of sample points, they pro-vide a predefined number, K, of clusters gathering sam-ple points according to a given metric. One of the most
commonly used clustering algorithm is the K-means al-gorithm.
2.1
Formulating the clustering problem
In order to apply the K-means algorithm to the surface partitioning problem, a set of sample points must first be defined. To do this, a mesh over the entire surface S(u, v) is defined by a set of (u, v) isoparametric curves. This way, a set of elementary meshes is also defined. Tak-ing the center of each elementary mesh as a sample point provides a suitable set of sample points ensuring the en-tire surface is covered (Figure 1). In other words, the sample points Si, i ∈ {1, . . . , n}, are defined such that
Si= S(ui, vi), where uiand vi are parametric values
dis-cretizing the whole parametric domain.
sample point Si Legend: elementary mesh S(u, v) u v
Figure 1: Sampling-point definition
The second element required to implement the K-means algorithm is a metric space adapted to the sought objective. A metric space consists of two components: a vector of significant features, and the definition of dis-tance between two vectors: that we shall call the metric. Actually, a metric provides a measure of the dissimilarity between a pair of sample points. Thus, two points that are similar, have a reduced dissimilarity distance, while two points that are very different have a greater distance. As a first naive approach, the dissimilarity can be evalu-ated directly through the Euclidean distance between the two 3D points Si and Sj. However, this distance does
not totally represent the nearness of these sample points from a milling point of view. In fact, to be suitable for milling with a toroidal cutter, one expects the zones pro-posed by clustering algorithm to be connected (in the mathematical sense, i.e., roughly speaking, a zone must not show any discontinuity). Indeed, a discontinuity in a zone leads to a tool lifting that is harmful to the total machining time. Thus, some definition of geometric prox-imity of the sample points should intervene in the chosen metric. The parametric values ui and vi are well suited
to give such an insight.
Moreover, in order to improve the efficiency of the toroidal cutting tool, the resulting zones are expected to feature rather uniform steepest slopes. In other words, the steepest-slope value and its orientation should vary as little as possible within a single zone. Thus, these two values should also be taken into account in the chosen metric.
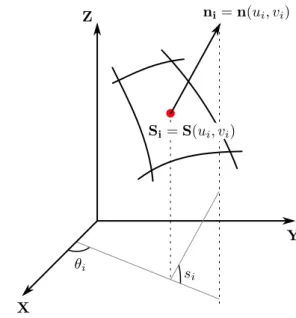
To summarize, for each sample point Si, i ∈ {1, . . . , n},
we define the four-component feature vector Fi ∈ R4
whose four components are (Figure 2):
the ui parametric value of the sample point Si
the vi parametric value of the sample point Si
the steepest-slope angle, noted si. This is the
an-gle between the vector ni= n(ui, vi), normal to the
surface at Si, and the horizontal plane (X, Y).
the steepest-slope orientation, noted θi. This is the
angle between the projection of the vector ni onto
the horizontal plane (X, Y), and the X axis.
Si= S(ui, vi) ni= n(ui, vi) X Y Z θi si
Figure 2: The four components (ui, vi, si and θi) of the
feature vectors
To obtain a fully defined metric space, a distance cal-culation method (the metric) must also be defined. The most natural choice is the Euclidean distance in R4, the
space of the chosen parameters (u, v, s and θ). The dis-similarity between two sample points Siand Sjis thereby
defined as:
d(i, j) = kFi− Fjk = (ui− uj)2+ (vi− vj)2
+(si− sj)2+ (θi− θj)2
The clustering problem aims at partitioning the given n sample points (or, to be more precise, the n feature vectors) into K (≤ n) clusters Z1, Z2, . . . , ZK so as to
minimize the sum of intra-cluster distances (squared, sim-ply to avoid discontinuity in the derivative of the objec-tive function). More precisely, the objecobjec-tive is to find (Z1, . . . , ZK) ∈ P minimizing: K X k=1 X i∈Zk kFi− ¯Fkk2
where P denotes the set of all possibles K-partitions (into K sets) of the sample-point index set {1, . . . , n}, and ¯Fk=
1 |Zk|
P
i∈ZkFi(called the centroid of Zk) is the barycenter
of the features vectors of all sample points belonging to Zk.
2.2
Running the K-means algorithm on
the 4D parameter vectors
Once the sample-point dataset with their feature vectors and the metric defined, the K-means algorithm may be carried out. Let K be the number of clusters chosen. The K-means algorithm is described in Algorithm 1.
Algorithm 1: The K-means algorithm
/* Initialize centroids */ choose K initial centroids ¯F1, . . . , ¯FK among the n
feature vectors repeat
/* allocate points to clusters */ foreach sample point Sido
attach Si to the cluster k corresponding to
argminkkFi− ¯Fkk
end
/* cluster-centroid update */ foreach cluster k do
recalculate centroid ¯Fk as the barycenter of
cluster-k feature vectors end
until no more change occur
In general, the resulting K-partition of the K-means algorithm depends on the particular choice of the initial centroids. Empirical tests showed however that in the case of machinable surfaces, the resulting zones are al-most not sensitive to the choice of the initial centroids. This is due to the (relative) regularity of machinable sur-faces and the large (enough) number of sampling points, so that outliers are avoided and the final result is less sen-sitive to initialization. In this study, an equally-spread angular repartition, in the parametric space, of initial centroids is adopted.
The running loop of the algorithm is divided into two parts. In the allocation step, each sample point Si is
attached to the closest centroid, according to the met-ric distance (1), i.e. a sample point Si is attached to
the cluster k corresponding to argminkkFi− ¯Fkk. In the
update step, the centroids are recalculated to reflect the allocation changes. To do this, for each cluster Zk, the 4D
barycenter of the feature vectors (ui, vi, si, θi), i ∈ Zk,
of the sampling points belonging to the cluster Zk, is
cal-culated, which gives a new centroid, ¯Fk. Remark that
this new centroid does not generally correspond to one of the n given sample points. Finally the repeat loop ends when stabilization occurs, i.e. no more sample point is switching from a cluster to another one and the position of centroids remain constant.
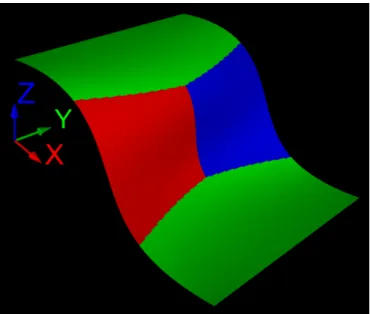
Figure 3 shows an example of surface partitioning ob-tained on the surface used in [3] with K = 3 and a 200 × 200 tessellation grid.
Figure 3: Example of a surface partitioned into K = 3 zones
2.3
Dividing disconnected zones
Carrying out the K-means algorithm is fast, even for fine tessellation meshes (for example the partitioning scheme presented in Figure 3 is fully computed within only 684 ms on a 16 cores Intel(R) Xeon(R) 1.70GHz sys-tem). However, it may happen that the above procedure provides disconnected zones, like in the case depicted by Figure 4, where the green zone is composed of two discon-nected sub-zones. This green zone must then be further partitioned into two zones, to prevent the toolpath plan-ning algorithm to provide a machiplan-ning process involving a single run, without lifting the cutter, which may cause severe damages to the surface, and lead to unexpected results.
We therefore propose a connectivity-check procedure to ensure that the zones provided by the above K-means al-gorithm are connected. The connected-component search algorithm we are proposing to carry out this task goes as follows. Finding connected components is a well-known polynomial problem in graph theory, but to be able to use it with a partitioning scheme, an undirected graph
Figure 4: Example of disconnected zone (in green)
corresponding to this partitioning scheme must first be defined. Each sample point corresponds to a vertex of the graph. Any two sample points belonging to a same clus-ter are connected with an edge if and only if they come from side-by-side elementary meshes. Once the graph corresponding to the partitioning scheme is defined, a connected-component search can be performed, e.g., us-ing the software package JGraphT [4]. As a result, any disconnected zone will simply be sub-divided into several connected zones. The time needed to perform this task is heavily dependant on the number of sample points. How-ever, even if it is a bit longer than the K-means procedure itself, it is still short enough to be used interactively. For example, the connected-component search on the surface presented in Figure 4 requires less than 15 seconds of CPU time (on the same computer as above). As expected, for this particular case, the procedure results in four different zones displayed on Figure 5.
To summarize, using the proposed connected-component search strategy appears to be a fast an ef-ficient choice to deal with the zone-partitioning issue.
3
Optimizing machining direction
within each zone
Once the zone-partitioning scheme defined, the optimal milling process for machining the resulting K zones still needs to be determined. For a given zone, let us call X the vector of the (numerous) variables that can have an impact on the machining time, and Pi(X), the ith
point of the toolpath (i = 1 . . . n(X)). For each zone, the
Figure 5: Result of the connected component search
optimization problem can then be expressed as: min
X machining time(X)
s.t. shi(X) 6 shmax, i = 1 . . . n(X)
(2)
where:
shi(X) is the scallop height at the vicinity of the
point Pi(X)
shmaxis the maximum scallop height allowed for this
surface.
From an optimization point of view, this is a fairly difficult problem as it is complicated to characterize the entire search space. Moreover, even for a given path, the objective function (machining time) cannot be cal-culated analytically (i.e. as an explicit mathematical for-mula in terms of optimization variables X). Actually, the objective function is the result of a computer simu-lation. Therefore, the machining time has to be consid-ered as a so-called black-box objective function involving numerous variables and constraints. In a preliminary ap-proach, some choices can be made to simplify the objec-tive function. First of all, we restrict our study to 3-axis machines. Second a given toolpath generation strategy is chosen: the strategy of zig-zag parallel planes. This strategy is widely used in the industry as it ensures that the entire surface is covered and it is easy to implement. The paths are thereby defined as the intersection of sur-face of the part and parallel vertical planes. The distance between two adjacent planes (called step-over distance, noted sod) is defined as the maximum distance such as the scallop-height constraint (2) is respected for the whole path. This choice facilitates the management of the qual-ity criterion. Indeed, at a given plane, the position of the
adjacent plane is easy to determine: it suffices to consider the worst point, in terms of scallop height, of the path de-fined by the given plane. This is enough to ensure that the quality criterion will be satisfied for the entire trajec-tory. From the optimization point of view, this strategy is very useful because the constraints are thereby satisfied by construction. Using a fast scallop height calculation method, such as in [5], the above-described toolpath plan-ning process is rapid enough to be used as the objective function of an optimization procedure.
The only parameter that remains to be defined is, for each zone, the direction of the parallel planes used to run the machining strategy. For the zone Zk, this
angle-determination problem may be summarized as: min
Θk
machining time(Θk) (3)
where Θk is the angle defining the machining direction of
zone Zk with reference to the X axis.
This is a univariate (one-dimensional) optimization problem whose objective function is, again, a black-box (i.e., its analytic form is not known). Thus, one single evaluation of this function requires a full toolpath plan-ning simulation. Therefore, the optimization process may be time expensive, especially if running the whole proce-dure within a time suitable for interactive usage is re-quired. Such a problem can be solved using a simple optimization algorithm, like the popular Nelder-Mead al-gorithm, used in [6] to solve (3) over the entire surface considered as a single zone. However, given the previous considerations on the computation time, in the present study, a more efficient black-box optimization approach is chosen. An extensive review of black-box optimization methods can be found in [7]. The software package used in the present study to perform optimization is NOMAD [8,9]. It is a LGPL-licence software that relies on the al-gorithms described in [10,11]. Using this package makes the resolution more flexible, and suitable for parallel com-puting.
In order to run the optimization procedure an initial guess of the angle Θk is advised. For this, we choose
the θ value of the initial centroid of zone Zk, as it may
be interpreted as the overall steepest-slope direction for the zone Zk. As the steepest-slope direction is the most
effective machining direction when using a toroidal cutter, this choice should be close to the optimal direction.
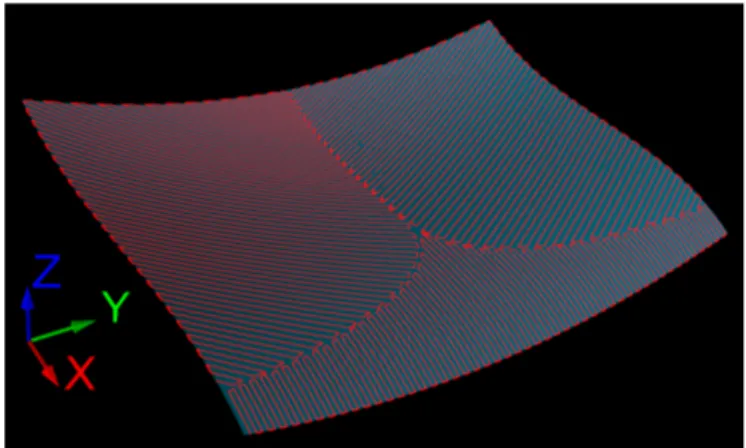
Applying this optimization procedure on the surface studied in [3] (see also Figure 3) provides the toolpath planning depicted in figure 6.
To carry out the parallel-planes strategy, a cutter of outer radius 5 mm and torus radius 2 mm is used, and the maximum scallop height is set to 0.01 mm, a value commonly used in industry.
Using the optimized toolpath, the two symmetric zones of Figure 6 need about 36 s to be machined, while the front zone requires about 28 s. Thus, the total machining
Figure 6: Example of toolpath optimization
time is around 100 s. This value should be considered keeping in mind the bulk size of the part is about 50 × 75 mm on the (X, Y) plane.
4
Discussion
We perform empirical tests comparing K-means with other clustering algorithms, namely the Hierarchical clus-tering [12] and the Rival penalized competitive learning [13]. These tests reveals that the latter are more sensi-tive to algorithm parameters, such as learning coefficients and mesh size, and that the K-means algorithm provides the best results.
The choice of the particular metric used in the clus-tering algorithm has a deep impact on the quality of the results. This choice deserves thereby attention in a deeper study.
The optimization process duration is heavily dependant on the implementation parameters chosen. It ranges from a few seconds of CPU time to several minutes, depending on: whether the surrogate-model option is activated or not, which stopping criterion is chosen, the mesh size, and so on. More work needs to be pursued to find out a good trade-off between CPU time and quality of the results.
Toolpath planning for milling of free-form surfaces is a field of research where very few authors release enough data to allow relevant comparisons between methods. Nevertheless, a comparison can be conducted between the C4DO1D method introduced in this paper and the one proposed by Choi & Banerjee in [3] because numerical result values are published in their paper. However, this comparison should be considered with caution because the cutter used in their paper is a ball-end cutter. Re-mark also that the measurement units in their paper are inches, thus conversion to millimeters gives unusual val-ues. The cutter radius used in [3] is 0.125 in = 3.175 mm; thus we choose a toroidal cutter with same outer radius to carry out the comparison. The torus radius was set
to 0.05 in = 1.27 mm. Choi & Banerjee present two experimental simulations: one with a maximum scallop height shmax = 0.01 in = 0.254 mm, and the other
us-ing shmax= 0.05 in = 1.27 mm. Besides, the machining
time is not precised in [3]; thus, we only compare total toolpath lengths. The resulting values are summarized in table 1.
shmax C4DO1D Choi & Banerjee
0.254 1437 1717 1.27 323 955
units: millimeters
Table 1: Comparison results with Choi & Banerjee’s method
Computation time is not specified in [3], but simply to give a rough idea, running the full C4DO1D method (clustering and optimization) takes less than 1 min of CPU time on a 16 cores Intel(R) Xeon(R) 1.70GHz sys-tem.
These comparative results show a significant improvement of performances using the proposed clustering/black-box optimization method. But once again, they should be considered with caution because the surface is rather small and the maximum scallop height values are relatively high. It would be interesting to compare both methods on parts that are more representative of industrial ones, and using parameters commonly used in industry.
5
Conclusion
In the context of machining free-form surfaces, the tool-path optimization problem is a challenge. The C4DO1D approach introduced in this paper provides the optimal solution (given the restricting choices made). First, a K-means algorithm is carried out to define machining zones. A zone segmentation verification is then performed, and finally, for each zone, a black-box optimization procedure is carried out to define an optimal machining direction.
This work is a first attempt to address the toolpath planning optimization problem using a clustering/black-box optimization approach. Future tracks of research in-clude improvements of both the clustering step and the optimization step. In regard to this latter point, the choice of a black-box optimization software may be very helpful to integrate, step by step, new degrees of com-plexity into the optimisation model.
References
[1] Bedi DS, Ismail F, Mahjoob MJ, Chen Y (1997) Toroidal versus ball nose and flat bottom end
mills. The International Journal of Advanced Man-ufacturing Technology 13(5):326–332, DOI 10.1007/ BF01178252
[2] Senatore J, Segonds S, Rubio W, Dessein G (2012) Correlation between machining direction, cutter ge-ometry and step-over distance in 3-axis milling: Ap-plication to milling by zones. Computer-Aided De-sign 44:1151–1160, DOI 10.1016/j.cad.2012.06.008 [3] Choi YK, Banerjee A (2007) Tool path generation
and tolerance analysis for free-form surfaces. Inter-national Journal of Machine Tools and Manufac-ture 47(3):689–696, DOI 10.1016/j.ijmachtools.2006. 04.014
[4] Michail D, Kinable J, Naveh B, Sichi JV (2019) Jgrapht–a java library for graph data structures and algorithms. arXiv preprint arXiv:190408355
[5] Redonnet JM, Djebali S, Segonds S, Senatore J, Ru-bio W (2013) Study of the effective cutter radius for end milling of free-form surfaces using a torus milling cutter. Computer-Aided Design 45(6):951–962, DOI 10.1016/j.cad.2013.03.002
[6] Redonnet JM, V´azquez AG, Michel AT, Segonds S (2018) Optimization of free-form surface machining using parallel planes strategy and torus milling cut-ter. Proceedings of the Institution of Mechanical En-gineers, Part B: Journal of Engineering Manufacture 232(2):240–250, DOI 10.1177/0954405416640175 [7] Audet C, Hare W (2017) Derivative-Free and
Black-box Optimization. Springer Series in Operations Re-search and Financial Engineering, Springer Interna-tional Publishing, DOI 10.1007/978-3-319-68913-5 [8] Abramson M, Audet C, Couture G, Dennis, Jr
J, Le Digabel S, Tribes C (2018) The NOMAD project. Software available athttps://www.gerad. ca/nomad/
[9] Audet C, Le Digabel S, Tribes C (2009) NO-MAD user guide. Tech. Rep. G-2009-37, Les cahiers du GERAD, URL https://www.gerad.ca/nomad/ Downloads/user_guide.pdf
[10] Le Digabel S (2011) Algorithm 909: NOMAD: Non-linear optimization with the MADS algorithm. ACM Transactions on Mathematical Software 37(4):1–15 [11] Audet C, Dennis, Jr J (2006) Mesh adaptive
di-rect search algorithms for constrained optimization. SIAM Journal on Optimization 17(1):188–217, DOI doi:10.1137/040603371
[12] Szekely GJ, Rizzo ML (2005) Hierarchical clus-tering via joint between-within distances: Ex-tending ward’s minimum variance method. Jour-nal of Classification 22(2):151–183, DOI 10.1007/ s00357-005-0012-9
[13] Xu L, Krzyzak A, Oja E (1993) Rival penalized com-petitive learning for clustering analysis, RBF net, and curve detection. IEEE Transactions on Neural Networks 4(4):636–649, DOI 10.1109/72.238318
![Figure 3 shows an example of surface partitioning ob- ob-tained on the surface used in [3] with K = 3 and a 200 × 200 tessellation grid.](https://thumb-eu.123doks.com/thumbv2/123doknet/12425565.334137/4.892.456.829.453.670/figure-shows-example-surface-partitioning-tained-surface-tessellation.webp)