HAL Id: hal-01891943
https://hal.archives-ouvertes.fr/hal-01891943
Submitted on 10 Oct 2018
HAL is a multi-disciplinary open access
archive for the deposit and dissemination of
sci-entific research documents, whether they are
pub-lished or not. The documents may come from
teaching and research institutions in France or
abroad, or from public or private research centers.
L’archive ouverte pluridisciplinaire HAL, est
destinée au dépôt et à la diffusion de documents
scientifiques de niveau recherche, publiés ou non,
émanant des établissements d’enseignement et de
recherche français ou étrangers, des laboratoires
publics ou privés.
High sensitivity optical biosensor based on polymer
materials and using the Vernier effect
Paul Azuelos, Pauline Girault, Nathalie Lorrain, Luiz Poffo, Mohammed
Guendouz, Monique Thual, Jonathan Lemaitre, Parastesh Pirasteh, Isabelle
Hardy, Joël Charrier
To cite this version:
Paul Azuelos, Pauline Girault, Nathalie Lorrain, Luiz Poffo, Mohammed Guendouz, et al.. High
sensitivity optical biosensor based on polymer materials and using the Vernier effect. Optics Express,
Optical Society of America - OSA Publishing, 2017, 25 (24), pp.30799-30806. �10.1364/OE.25.030799�.
�hal-01891943�
High sensitivity optical biosensor based on
polymer materials and using the Vernier effect
P
AULA
ZUELOS,
1*P
AULINEG
IRAULT,
1N
ATHALIEL
ORRAIN,
1L
UIZP
OFFO,
1M
OHAMMEDG
UENDOUZ,
1M
ONIQUET
HUAL,
1J
ONATHANL
EMAÎTRE,
1P
ARASTESHP
IRASTEH,
1I
SABELLEH
ARDY 1,2 ANDJ
OËLC
HARRIER11UMR FOTON, CNRS, Université de Rennes 1, ENSSAT, F22305 Lannion, France 2 UMR FOTON, CNRS, IMT Atlantique, F29238 Brest, France
Abstract We demonstrate the fabrication of a Vernier effect
SU8/PMATRIFE polymer optical biosensor with high homogeneous
sensitivityusing a standard photolithography process. The sensor is based on
one micro-resonator embedded on each arm of a Mach-Zehnder interferometer. Measurements are based on the refractive index variation of the optical waveguide superstrate with different concentrations of glucose solutions. The sensitivity of the sensor has been measured as 17558 nm/RIU
and the limit of detection has been estimated to 1.1.10-6 RIU.
© 2017 Optical Society of America under the terms of the OSA Open Access Publishing Agreement References and links
1. M. C. Estevez, M. Alvarez, and L. M. Lechuga, “Integrated optical devices for lab-on-chip biosensing applications,” Lasers & Photonics Review 6(4), 463-487 (2012).
2. D. Duval, and L. M. Lechuga, “Breakthroughs in photonics 2012: 2012 breakthroughs in lab-on-a-chip and optical biosensors,” IEEE Photonics Journal 5(2), 0700906 - 0700906 (2013).
3. Q. Liu, X. Tu, K. W. Kim, J. S. Kee, Y. Shin, K. Han, Y. J. Yoon, G. Q. Lo, and M. K. Park, “Highly sensitive Mach–Zehnder interferometer biosensor based on silicon nitride slot waveguide,” Sensors and Actuators B 188, 681-688 (2013).
4. J. Dostalek, J. Ctyroky, J. Homola, E. Brynda, M. Skalsky, P. Nekvindova, J. Spirkova, J. Skvor, and J. Schrofel, “Surface plasmon resonance biosensor based on integrated optical waveguide,” Sensors and Actuators B 76(1-3), 8-12 (2001).
5. J. Adrian, S. Pasche, J. M. Diserens, F. Sanchez-Baeza, H. Gao, M. P. Marco, and G. Voirin, “Waveguide interrogated optical immunosensor (WIOS) for detection of sulfonamide antibiotics in milk,” Biosensors and Bioelectronics 24(11), 3340-3346 (2009).
6. S. Chakravarty, W. C. Lai, Y. Zou, H. A. Drabkin, R. M. Gemmill, G. R. Simon, S. H. Chin, and R. T. Chen, “Multiplexed specific label-free detection of NCI- H358 lung cancer cell line lysates with silicon based photonic crystal microcavity biosensors,” Biosensors and Bioelectronics 43, 50-55 (2013).
7. C. Ciminelli, F. Dell’Olio, D. Conteduca, C. M. Campanella, and M. N.Armenise, “High performance SOI microring resonator for biochemical sensing,” Optics and Laser Technology 59, 60-67 (2014).
8. C. Ciminelli, F. Dell’Olio, C. E. Campanella, and M. N. Armenise, “Label-free optical resonant sensors for biochemical applications,” Progress in Quantum electronics 37(2), 51-107 (2013).
9. R. Boeck, N. Jaeger, N. Rouger, and L. Chrostowski, “Series-coupled silicon racetrack resonators and the Vernier effect: theory and measurement,” Opt. Express 18(24), 25151–25157 (2010).
10. M. La Notte, B. Troia, T. Muciaccia, C. E. Campanelle, F. De Leonardis, and V. M.N. Passaro, “Recent advanves in gas and chemical detection by Vernier effect-based photonic sensors,” Sensors 14(3), 4831-4855 (2014).
11. V.Zamora, P. Lutzow, M. Weiland, and D. Pergande, “A highly sensitive refractometric sensor based on cascaded SiN microring resonators,” Sensors 13(11), 14601–14610 (2013).
12. B. Troia, A. Z. Khokhar, M. Nedeljkovic, S. A. Reynolds, Y. Hu, G. Z. Mashanovich, and V. M. N. Passaro, “Design procedure and fabrication of reproducible silicon Vernier devices for high-performance refractive index sensing,” Sensors 15(6), 13548-13567 (2015).
13. T.Claes, W.Bogaerts, and P.Bienstman, “Experimental characterization of a silicon photonic biosensor consisting of two cascaded ring resonators based on the vernier-effect and introduction of a curve fitting method for an improved detection limit.,” Optics Express 18(22), 22747–22761 (2010).
14. J.Hu, and D. Dai, “Cascaded-ring optical sensor with enhanced sensitivity by using suspended si-nanowires,” IEEE Photonics Technology Letters 23(13), 842-844 (2011).
15. X.Jiang, Y.Chend, F.Yu, L.Tang, M.Li, and JJ.He, “High-sensitivity optical biosensor based on cascaded mach-zehnder interferometer and ring resonator using Vernier effect,” Optics Letters 39(22), 6363–6366 (2014). 16. X.Tu, J.Song, T.-Y.Liow, M.K.Park, J.Q.Yiying, J.S.Kee, M.Yu, and G.-Q.Lo, “Thermal independent
silicon-nitride slot waveguide biosensor with high sensitivity,” Optics Express 20(3), 2640–2648 (2012).
17. Y. Liu, Y. Li, M. Li, and J.J. He, “High sensitivity and wide-range optical sensor based on three cascaded ring resonators,” Optics Express 25(2), 972-978 (2017).
18. H.Yi, D.S.Citrin, Y.Chen, and Z.Zhou, “Dual-microring-resonator interference sensor,” Applied Physics Letters
95(), 191112 (2012).
19. P.Girault, J.Lemaitre, M.Guendouz, N.Lorrain, L.Poffo, M.Gadonna, and D.Bosc, “Micro-resonators based on integrated polymer technology for optical sensing,” Proc. SPIE 9141, 914121 (2014).
20. P.Girault, N.Lorrain, L.Poffo, M.Guendouz, J.Lemaitre, C.Carré, M.Gadonna, D.Bosc, and G.Vignaud, “Integrated polymer micro-ring resonators for optical sensing applications,” Journal of applied Physics 117, 104504 (2015).
21. E.A.J. Marcatili, “Dielectric Rectangular waveguide and directional coupler for integrated optics,” Bell syst. Tech. 48, 2071 (1969).
22. D.-X.Xu, A.Densmore, A.Delâge, P.Waldron, R.McKinnon, S.Janz, J.Lapointe, G.Lopinski, T.Mischki, E.Post, P.Cheben, and J.H.Schmid, “Folded cavity SOI microring sensors for high sensitivity and real time
measurement of biomolecular binding,” Optics Express 16(19), 15137-15148 (2008)
23. S.D.Le, E.Delcourt, P.Girault, A.Gutierrez-Arroyo, P.Azuelos, N.Lorrain, L.Bodiou, L.Poffo, J-M. Goujon, Y.Dumeige, I.Hardy, P.Rochard, J.Lemaitre, P.Pirasteh, M.Guendouz, T.Chartier, L.Quétel, S.Claudot, J.Charrier, and M.Thual, “Study of optimized coupling based on micro-lensed fibers for fibers and photonic integrated circuits in the framework of telecommunications and sensing applications,” Communications in Physics 26(4), 325-334 (2016).
1. Introduction
The increasing demand for ultra-sensitive and compact sensors for rapid and specific detection of various biochemical analytes has induced a large development of integrated optical waveguide-based label free sensors. Unlike optical fiber sensors, integrated optical sensors can be easily miniaturized and thus have the potential to be integrated in large numbers over a small area in order to implement laboratories-on-chip (LOC) [1]. Multi-detection is possible since integrated optical sensor arrays for the detection of different molecules from the same sample can be fabricated on the same chip [2].
Several configurations of integrated optical sensors using bulk materials have been demonstrated with the objective of increasing the sensitivity as well as reducing the limit of detection as in, for example, Mach-Zehnder (MZ) interferometers [3], surface Plasmon sensors [4], grating couplers [5], photonic crystal [6] and micro-resonators (MR) [7]...
One solution for increasing the sensitivity of an integrated interferometer based on an optical sensor such as the Mach-Zehnder is to increase the length interaction between the target molecules and the light, but this however reduces the capacity for miniaturization. MR-based sensors have been extensively researched the last few years to exploit their resonant properties [8] which makes it possible to overcome the increase in the interaction length.
To further increase the sensitivity of such an integrated optical sensor, Vernier effect configurations based on cascaded MRs or using both MZ and MR, are now widely recognized in integrated optics applications not only for filtering applications [9] but also increasingly for the detection of various substances [10]. Sensitivities are enhanced by a factor, up to several hundred times that of a single MR, which can then reduce the sensor limit of detection or ease the detection of low concentration analytes using simplified experimental setups. State of the art Vernier effect devices and performances have been described in [11], [12]. Various Vernier effect configurations in silicon-on-insulator (SOI) or in silicon nitride (SiN) have been proposed experimentally as, for example, the commonly used cascaded MR [11], [13], [14], a MR cascaded with a MZ [15], two cascaded MZs [16] and very recently, three cascaded MRs [17]. A structure with one MR embedded on each arm of a MZ has also been studied theoretically [18].
In this work, the advantage of the last configuration is investigated theoretically and
experimentally using polymer materials as they offer both low cost mass production with
standard clean room setups and low propagation losses [19]. PMATRIFE (Poly(2,2,2 MethAcrylate of TRIFluoro-Ethyl)) polymer is used as optical confinement layer for both cladding and superstrate and SU8 is used for the waveguide core. The novelty consists in taking advantage of these low cost polymer materials to implement a Vernier effect biosensor, based on MR embedded on each arm of a MZ, which achieves very high sensitivity in agreement with a theoretical study. After the presentation of the design and the fabrication of the Vernier effect sensor, theoretical and experimental results of sensing are presented and discussed.
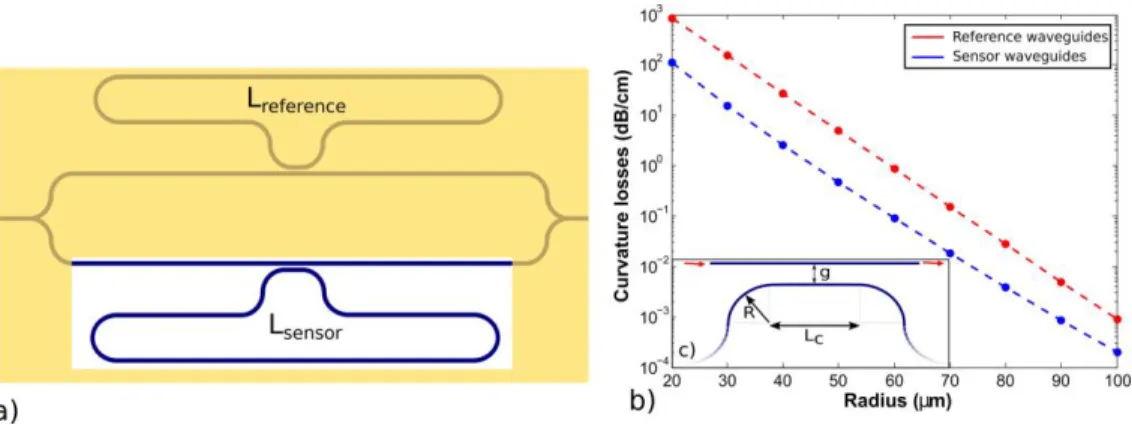
2. Design of Vernier effect polymer optical transducer
The MZ pass configuration sensor studied is represented in Fig. 1(a). It is made up of a sensor MR on the sensing arm and a reference MR on the reference arm, both based on SU8/PMATRIFE waveguides. The sensor MR is directly exposed to the solution to be detected by means of a reservoir (white rectangle) etched in the PMATRIFE superstrate covering the reference part of the sensor. The transmission function of this sensor is given by the expression [18]:
2 2
. . . .
1 1
( ) | | | | | || | cos arg | | arg | |
4 sens ref 2 sens ref sens ref
T E E E E E E
(1)
With Eref. and Esens., the expression of the electromagnetic field at the output of the sensor MR
and the reference MR respectively for a unit amplitude TE polarization electromagnetic field excitation. The expression of the electromagnetic field at the output of the reference and sensor MR are given by the expression [20]:
., . ., . ., . ., . ., . ., . ., .
1
ref sens ref sens ref sens ref sens
L j ref sens ref sens L j in ref sens
e
e
E
E
e
e
(2)
With Ein the amplitude of the incident field at the input of the Vernier effect transducer. Lref. and
Lsens. noticed as Lref.,sens. in Eq. (2), are the length of the reference and sensor MR respectively.
Similarly, αref. and αsens. noticed as αref.,sens. are the propagation losses in the reference and sensor
MR respectively. Likewise, τref. and τsens., expressed as τref.,sens., are the self-coupling coefficient
of the reference and sensor MR respectively. In this study, lossless coupling is considered, so the relation between self-coupling τ and cross coupling coefficient κ is
ref sens2 ., .
ref sens2 ., .
1
. The single pass phase shift is defined as
., .
., . ref sens
ref sens eff
L
n
with β the propagationconstant, . reff eff n and . sens eff
n are the respective effective indices of the reference MR and the sensor
MR as calculated by P.Girault et.al. for SU8/PMATRIFE waveguides [19,20].
In order to design the Vernier effect transducer, the length of each MR must be carefully calculated to achieve both high sensitivity and measurable envelope period in the range of
detection. Indeed, the Vernier sensitivity Sv is defined as [13]:
. . . | | ref V MR V MR sens ref FSR S S G S FSR FSR
(3)
with 𝑆𝑀𝑅 the sensitivity of a single polymer MR and Gv the amelioration factor between single
MR sensor and Vernier sensor sensitivity. 𝐹𝑆𝑅𝑟𝑒𝑓. and 𝐹𝑆𝑅𝑠𝑒𝑛𝑠. are the free spectral range of
the reference MR or of the sensor MR and are given by :
., . 2 ., . ., . reff sens res ref sens
ref sens eff FSR
L n
(4)
The sensitivity of one MR (sensor MR) is then given by :
. .
. . . .
( / ) sens sens
sens sens sens sens
eff res eff MR eff s eff s n n S nm RIU n n n n
(5)
with ns,sens, the refractive index of the superstrate (solution in the sensing reservoir) and
. . sens sens
eff s
n n
the variation of the effective index of the MR sensor waveguide with the variation
of the superstrate refractive index in the reservoir. The period of the Vernier transmission function envelope is defined as [13]:
. . . . | | ref sens V sens ref FSR FSR T FSR FSR
(6)
The MR perimeter has been calculated as 5500 μm and 5559 μm for the sensor MR and reference MR respectively to achieve both high sensitivity and measurable envelope period, taking into account Eq. (1) and Eq. (4) and experimental tunable laser source range limitation of 100 nm between 1500 nm and 1600 nm.
The overall losses for SU8/PMATRIFE polymer waveguides have been estimated
previously for the determination of a single MR characteristics as αref. = 2 dB/cm [19] for the
reference part of the MR and αsens. = 6 dB/cm for the waveguide exposed to the analyte solution
(glucose solubilized in deionized water) [20]. A radius R=100 μm is defined in Fig. 1(c) in all bend radii in the device to minimize curvature losses calculated with FIMMWAVE commercial software and represented in Fig. 1(b). This radius limits the curvature losses for both sensor and reference waveguides compared to the overall losses as polymer waveguide mode confinement is low compared to SOI waveguides.
For these values of MR perimeters and propagation losses, evanescent coupling has been calculated for MR critical symmetrical coupling conditions with a gap g = 0.6 μm between the
access waveguide and the MR waveguide and coupling lengths of Lc = 17 µm and Lc = 34 μm
for the sensor MR and reference MR respectively. For these coupling conditions the
self-coupling coefficients has been calculated by the marcatili’s method [21] to τsens. = 0.6 and τref. =
0.694 at 1500 nm with a positive slope of 0.09 on the range 1500-1625 nm for both MRs. The structure has been designed to simplify the photomask fabrication, however, a folded structure with spiral MRs presented in reference [22] could be considered to further reduce the transducer footprint without reduction of the radius of curvature.
Fig. 1. a) Representation of the Vernier effect MZ-pass configuration sensor, b) Dependence of the curvature losses with the radius for the reference waveguides and the sensor waveguides, c) Coupling region of the MR
From the refractive index of the material as defined in [19], the effective refractive index of the SU8/PMATRIFE polymer waveguides have been calculated as a function of the wavelength in [20] for a PMATRIFE superstrate and for a water superstrate using the commercial FIMMWAVE software. Then, by calculating the effective refractive index
variation (neff,sens) induced by a small variation of refractive index superstrate (ns,sens) in the
reservoir, the sensor MR theoretical sensitivity has been estimated using the expression defined in Eq. (5) as 70 nm/RIU.
From these geometrical parameters, and using the expressions given by Eq. (3) and Eq. (6),
a Vernier gain Gv and Tv the theoretical period of the transmission function has been calculated
respectively as 250 and 55 nm at 1550 nm. A very promising Vernier sensitivity Sv of 17500
nm/RIU has been deduced from the relation given by Eq. (3) with the sensor MR theoretical
sensitivity SMR of 70 nm/RIU calculated before.
3. Fabrication of the transducer
The transducer is fabricated using SU8 2000 polymer as the core waveguide material and PMATRIFE polymer as both cladding layer and superstrate for the reference part of the sensor (Fig. 1(a)). Fabrication steps are detailed in Fig. 2. In step 1, the Si wafer is cleaned and dehydrated. In step 2, a 5 μm thick cladding layer is fabricated with PMATRIFE diluted in THF (TetraHydroFuran) to 500 g/L concentration, is spin coated onto the wafer. Then, in step 3, a 1.5 μm thick SU8 2000 polymer layer is spin coated onto the cladding and polymerized with
thermal treatment and UV exposure. In step 4, a 50 nm thick layer of SiO2 is deposited by
PECVD (Plasma Enhanced Chemical Vapor Deposition) and standard photolithography is performed with SPR700 positive resin. In step 5, the waveguides are etched in three steps :
firstly, the SiO2 is etched for 20 seconds with a SF6 plasma treatment, then the SU8 waveguides
are etched for 10 minutes with 150 nm/min etching speed and the remaining SiO2 under the
resin mask is etched with a SF6 plasma. In step 6, a 50 nm thick layer of SiNx is deposited onto the waveguides by PECVD, to ease superstrate adherence. In step 7, PMATRIFE with a concentration of 300g/L is deposited as a superstrate in order to cover the waveguides. This superstrate has a maximum thickness of 2 μm in order to limit its etching time in step 9. In step
8, a 50 nm thick layer of SiO2 is deposited as etching stop layer. After this, the reservoir of the
photolithography. Finally in step 9, the reservoir is etched with the same etching process as used for the SU8 waveguides.
Fig. 2. Fabrication steps of the sensor
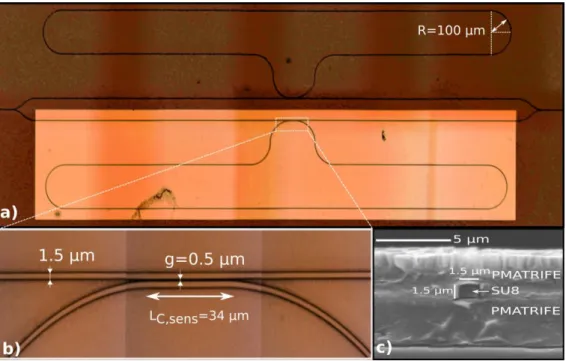
The X5 magnification optical microscope image in Fig. 3(a) shows a top view of the whole made up of MRs embedded on each arm of a MZ; the darker part corresponds to the reference part of the MR sensor covered by the PMATRIFE polymer superstrate while in the lighter part, the MR sensing part of the sensor in the reservoir is open to the air and will be covered by glucose/water solutions. In Fig. 3(b), the gap opening is observed with X50 times optical magnification. Cross-section view of the cleaved surface with the SU8 and the PMATRIFE cladding and superstrate can be seen in the Scanning Electronic Microscope (SEM) image shown in Fig. 3(c). The dimensions of the SU8 waveguides are 1.5 µm² square in cross section, with less than 0.1 μm variation in the size of the waveguide measured at different wafer positions.
Fig. 3. a) Optical microscope image of the polymer Vernier effect sensor with the reference MR on the upper arm and the sensor MR in the reservoir in the lower arm. b) Optical microscope image of the directional coupler of the sensor MR c) Scanning electronic microscope (SEM) cross section of the optical waveguide at the input of the sensor
4. Experiment and results
The sensor is characterized with a fibered broadband 1500-1625nm tunable laser source (Yenista Tunics T100S-HP). Its 10 mW output power is coupled into the SU8 waveguide using a lensed fiber with a mode radius of 2.5 μm mounted on micro-alignment bench fabricated in the lab [23]. A second lensed single mode fiber is used to couple the output of the waveguide to a power-meter. Piezo-controlled stages are used to position the input and output fibers with the
help of an infra-red camera. A polarization controller isplaced between the laser and the input
micro-lensed single mode fiber to select the TE polarization mode. A temperature controller is also used to maintain the sample at room temperature and to reduce the impact of temperature fluctuation on the spectral responses. The spectral responses of the structure, made up of one MR embedded on each arm of a MZ, was measured over the full wavelength range of the laser in steps of 1 pm.
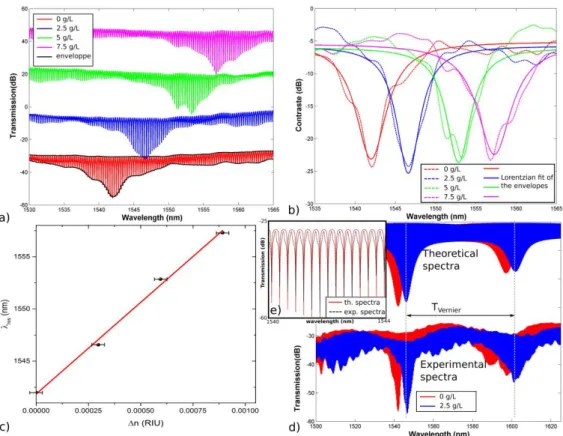
The characterization of the sensor is performed with glucose solutions of 2.5 g/L, 5 g/L and 7.5 g/L with an accuracy of 0.25g/L and the reference transmission spectra is registered with deionized water after each measurement with the glucose/water solution. The experimental spectra are shown near the peak of the envelope in the range 1530-1565nm in Fig. 4(a). The envelope spectra characteristic of the Vernier effect appears at the output with up to 20 dB contrast, which eases the sensor characterizations and the envelope is extracted by peak detection of the maximum values of the spectra.
Fig. 4. a) Shift of the envelope function with different concentrations of the glucose solution spectra of glucose water solutions ; the envelopes are translated by 20dB for representation b) Lorentzian fit of the envelope function maximum values with glucose solution refractive index variation c) Linear fit of the resonant wavelength shift with the refractive index variation of the solution d) Comparison between theoretical and experimental transmission spectra; the envelopes are translated for representation e) fit of the experimental spectra with the theoretical spectra
A shift of the envelope appears when glucose concentrations vary. A linear fit can be applied on the Lorentzian fit of the envelope function of the resonance peaks of the transmission spectra represented in Fig.4.b. and then, the sensitivity can be calculated from the slope of the linear fit of the maximum position of the fitted Lorentzian peaks and the variation of the solution refractive index as represented in Fig. 4(c). The dependence of the solution refractive index
variation on the concentration of glucose has been calculated to 1.189.10-4 RIU/(g/L) by
Ciminelli.et.al [7]. The experimental sensitivity obtained here is 17558 nm/RIU with a standard error on the slope of less than 5%. The period of the experimental envelope is 55 nm which
corresponds to a maximum variation of refractive index of 3.1 10-3 or a glucose concentration
of 27 g/l.
The theoretical transmission function of the Vernier MZ pass sensor calculated with Eq. (1) can be simulated according to the geometry defined in part 2 and from the optical parameters defined in [19-20]. The experimental spectra is compared to theoretical spectra for the fundamental mode TE polarization over the full wavelength range of measurement in Fig. 4(d), and the superposition of the resonant peaks is represented over the range 1540-1544 nm in Fig. 4(e). The sensitivity and the Vernier envelope period of the theoretical and experimental spectra
compare well. The slight difference to the theoretical sensitivity can be attributed to fabrication tolerances on the size of the polymer waveguides and polarization dependence of the tunable laser source. The difference in contrast between the theoretical and experimental spectra can be explained by coupling coefficient and loss variations with the wavelength. Taking into account the minimum detectable wavelength shift value of 0.02 nm of our experimental setup, the
transducer limit of detection is calculated as 1.1.10-6 which corresponds to a glucose
concentration of 9.10-3 g/L.
5. Discussion and conclusion
A new optical transducer based on the Vernier effect has been developed for glucose detection. The transducer is based on one MR embedded on each arm of a MZ interferometer and has been fabricated with polymer materials using standard photolithography process. This work demonstrates the ability to develop a highly sensitive and low cost polymer optical transducer for biological detection with several interferometers. The sensitivity of the transducer developed in this work is more than 250 times higher than that of a single SU8/PMATRIFE polymer MR with similar fabrication process which demonstrates the advantage of Vernier effect sensor over to a single MR in achieving high sensitivity [20].
The obtained experimental transducer sensitivity of 17558 nm/RIU in the RIU range of
[1.1.10-6 - 3.1 10-3] is greatly increased compared to 5866 nm/RIU and 6317 nm/RIU sensitivity
obtained with other Vernier effect transducers based on cascaded MRs developed by Y.Liu.et.al. [17] using SOI materials or by V.Zamora.et.al [11] using SiN material. The advantage of the use of polymers in this work is their low cost and the ease standard technological process compared to e-beam technology. Additionally, the 20dB contrast of the envelope function of the transducer eases detection and longer interferometers could be developed to surpass the extremely high sensitivity of 21500 nm/RIU reached by Jiang.et.al. with SOI MR cascaded with a MZ [15].
Funding
This work was funded by Lannion Trégor Communauté, Région Bretagne and the French government.