MODEL FOR OPTIMUM DESIGN OF STANDALONE HYBRID RENEWABLE ENERGY MICROGRIDS
A. Abdulkarim1, S. M. Abdelkader2and D. J. Morrow3
1
Department of Electrical & Electronics Engineering, University of Ilorin, Nigeria 2
Electrical Engineering Department, Mansoura University, Mansoura 35516 Egypt 3
School of Electronics, Electrical Engineering and Comp Sci. QUB, United Kingdom
Received: 30 September 2016 / Accepted: 29 April 2017 / Published online: 01 May 2017
ABSTRACT
An optimization model for the design of a hybrid renewable energy microgrid supplying an isolated load has been developed. This is achieved in two steps. The first step developed a linear programming model that uses the average pattern of demand, wind, and solar energy to determine the optimal configuration. The second step used a clustering algorithm to investigate the methods of improving the reliability of the system. These include increasing the storage capacity and increasing the rated power of the wind energy conversion system (WECS) or solar energy conversion system (SECS). The results have shown that increasing the capacity of storage is the most economical way of improving the reliability of the system. The model has been verified through applications to a test microgrid of common size. The results have shown a 70% reduction in gas emissions and an 80% reduction in energy costs.
Keywords: Wind, solar, storage, diesel generator, optimization
Author Correspondence, e-mail:[email protected] doi:http://dx.doi.org/10.4314/jfas.v9i2.30
ISSN 1112-9867
Available online at http://www.jfas.info
Journal of Fundamental and Applied Sciences is licensed under aCreative Commons Attribution-NonCommercial 4.0 International License.Libraries Resource Directory. We are listed underResearch Associationscategory.
1. GENERAL INTRODUCTION
Isolated loads and communities rely on the use of diesel generators for their daily energy needs. Fortunately, some of these places are blessed with renewable energy such as wind and solar power. It has been suggested that these renewable energy resources be used to support the existing diesel generator. Because of the nature of the output power of the renewable energy resources, there is a need to add storage. Therefore, in order to achieve continuous, economical and reliable energy supply to these loads, there is a need to use all the mentioned resources together. Also, it is necessary to supply isolated loads with constant frequency and continuous electricity. These requirements make the design of a standalone microgrid very complex. It is paramount to design all the parts correctly in order to achieve an economic and reliable supply. To this end, a proper sizing methodology for the hybrid microgrid system is required. The design of the proposed system is site-specific and depends on the amount of renewable energy generation, prices of diesel and load [1,2].
There have been many attempts to design the optimum hybrid microgrid. The cost of generation and battery life loss was optimized with a non-dominated sorting genetic algorithm (NSGA II) in [3]. In [4] the diving the rectangle (DIRECT) algorithm was used for optimum sizing of a PV/wind/diesel/storage microgrid. Modified particle swarm optimization was introduced in [5] to optimize cost and reliability. The method proposed in [2] found the optimal configuration of a microgrid for northern Iran using particle swarm optimisation PSO. Multi-objective optimization was proposed to minimize the cost of energy, customer outage and emission pollution in [6]. Simulated annealing has been applied for optimal system operation and the unit cost of hybrid microgrids [7]. An algorithm for the determination of wind-PV generation capacities was developed in [8]. A constrained mixed-integer multi-objective particle swarm optimization (CMIMOPSO) algorithm was applied to maximize reliability and minimize system cost of a PV-wind hybrid system in [9]. Time matching simulation was proposed for the optimal design of a microgrid in [10].
Another effort includes the optimal sizing of a PV/wind/diesel hybrid energy system to supply a building in Malaysia [11]. The possibility of using wind and solar power in the form of a microgrid was studied in [12,13]. More details about the recent hybrid microgrid introduced in the last 12 years and the outcome can be found in [1,14].
Therefore, there are three approaches in the optimal configuration of the hybrid system both technically and economically. These can be categorised into iterative, probabilistic and trade-off approaches [15]. The drawback of these methods is that they are time-consuming and it is difficult to adjust any of the input variables.
None of the previous studies have proposed a model capable of utilizing all the possible design variables in the optimum design of a standalone microgrid. The decision variables according to the proposed model include the rated power of each unit, output power of the diesel generator at each interval, previous and present storage levels, and the charging and discharging powers of the storage system. Also, the previous works usually determined the number of components by assuming the rated power of each unit. Similarly, studies on carbon (CO2) emission are very limited. Therefore, there is a need to quantify the carbon emission in the design of the proposed microgrid.
This paper proposes a model for the optimal design of a hybrid microgrid that minimizes the annual cost of the system, taking all the factors above as decision variables. The optimization problem is formulated as a linear program and solved with Matlab. The optimization determines the carbon emission and system operating cost with and without renewable energy sources. Also, presented in this paper is a sensitivity analysis to assess the effects of parameter changes on the system performance.
2. DEVELOPMENT OF THE MATHEMATICAL MODEL
The proposed microgrid structure is shown in Figure 1. It can be observed that it consists of five major building blocks; these are WECS, SECS, the storage system, the diesel generator unit and the static energy conversion system. The proposed microgrid consists of conventional and non-conventional resources, therefore is hybrid in nature. These components should be properly operated in a way that guarantees continuous power supply to the load. The intermittent nature of the renewable energy sources causes the output to fluctuate. The storage system is connected to reduce the fluctuations and store the excess power produced by the renewable energy sources. When the power produced by the two renewable energy sources is less than the demand, the battery supplies the deficit. However, when the power supplied by both renewable energy sources and the battery is less than the demand, the diesel generator supplies the deficit. Sometimes dump
loads are added to take care of the excess power when the battery storage system is fully charged and the demand is satisfied [16].
Fig.1. Proposed hybrid microgrid
2.1. Wind Energy Conversion System
The power output of a wind energy-generating system is a function of the three wind speeds, resulting in different design alternatives [16,17]. The wind speeds include the cut-in speed
( ), the cut-out speed ( ) and the rated speed of the wind turbine ( ). The wind speed and
output power are linearly approximated in the range < < as shown in Figure 2.
Fig.2. Linearized curve of a wind turbine
Wind speed Output
After the random distribution is obtained, the power output of the wind energy conversion system is expressed as a function of rated power,
( ) =∝. (1)
∝ = 1.0 ≤ << <
0 ≤ ≥
(2)
∝, is a constant, and it can be observed that the output power can be determined as a piecewise linear relationship of the rated power. Therefore, the rated capacity of the wind energy conversion system can be used as a decision variable. Finally, the model decides on the capacity for each design.
2.2. Solar Energy Conversion System
The power output of the photovoltaic system (PV) system can be determined from the different mathematical models expressed in [17,18]. In these models, the output power of the PV depends on its rated power, light intensity, and operating ambient temperature, etc. The model used for the determination of the output power of the solar energy conversion system is expressed in Equation (3)
= (3)
where is the solar radiation of the operating point ( / ), is the instantaneous efficiency of the PV generator, is the area of a single module used in the analysis ( ) and is the number of modules. The module efficiency can be determined according to the mathematical model defined in [19] given by
= (1 − ( − )) (4)
where is the PV generator reference efficiency, the efficiency of power tracking equipment which is equal to one when a perfect maximum power point tracker is assumed, the PV cell temperature (℃ ), the reference temperature and the temperature coefficient of efficiency ranging from 0.004 to 0.006 (per ℃ ). Because of the absence of the mention quantities, it is not possible to evaluate the exact value of . Most of the papers assumed a value in the range of 16% to 20%, In this design a value equal to 20% is assumed.
In order to consider the variation of the PV model output power as a function of the SECS rated power, a variable is introduced. Consequently, the output of the solar energy conversion system is expressed as a linear function of the unit rating and a constant. In the same way, the rated
capacity of the PV modules system is part of the decision variables. Therefore, at each solar radiation level, the corresponding PV modules output is determined with the proposed linear model.
= (5)
= (6)
The solar energy conversion system is made up of the number of PV modules connected in series ( . ) and parallel ( . ). It is also possible to determine the number of series and parallel PV. Depending on the application, the PV modules may be connected in parallel for higher current or in series for higher voltage.
2.3. Diesel Generator and Estimation of Carbon Emission
In this section, a model is defined for the determination of the carbon emission. In order reduce the gas emission, the amount of carbon produced by the system must be known and quantified. To this end, depending on the amount of carbon produced, a carbon emission factor based on the kWh produced by a diesel generator is defined. The emission factor in this case is assumed to be 0.699 kg/kWh [20]. The daily operational cost of the diesel generator is defined as
= ∑ ( ) (7)
In the proposed microgrid, the diesel generator serves as a backup power source. Therefore, the fuel consumption ( ) and the output power of the unit are related linearly [3].
( ) = × + × (8)
where and are curve-fitting parameters selected according to the manufacturer's recommendation. and are the rated power and output power of diesel generator respectively. Based on the manufacturer's recommendations and load characteristics, and are assumed to be 0.2246 and 0.08415 respectively. Therefore, it can be seen that the hourly fuel consumption depends on the rated capacity of the diesel generator and the output powers at each interval. That is why manufacturers usually specify the operating range of the diesel generator in Equation (9).
≤ ( ) ≤ (9)
The mathematical model for the determination of the cost of operating the diesel generator has been obtained. It is possible to compare the cost of operating the system with diesel only or with the renewable energy source. The difference between the costs amounts to the saving as a result of operating the system with a renewable energy system. A similar analysis can be performed for
the amount of carbon emission. Therefore, the amount of carbon emission of the diesel generator at each interval is determined from the corresponding kWh produced by running the DG defined by
= × ∆ × (10)
and the amount of carbon emission over an average day can be estimated from Equation (11)
= ∑ (11)
2.4. Mathematical Model Based on the Annual Cost of the System
In this paper, the economic analysis is based on the concept of the annual cost of the system ( ).The annual cost of system components is defined as the sum of annual capital cost ( ), annual recovery cost ( ), annual replacement cost ( ), annual operation and maintenance ( ) and annual fuel cost ( ). Therefore the objective function to be minimized is expressed as
= + + + (12)
2.1.1. Annual capital cost
Annual capital cost needs to be economical for a payback period of years and discount rate . of each unit is determined by
= ( , ) ∑ (13)
Another factor called capital recovery factor is defined as the ratio used to determine the present value (or a series equal to the annual cash flow) and is defined as
( , ) = (( )) (14)
where and are the capital cost of generator in $/kW and R is the rating of the unit. 2.1.2. Annual replacement cost
Annual replacement cost (ARC) is the cost of replacing a unit during the entire lifetime of the project. In this design, the unit that needs to be replaced is the battery. Other units do not need to be replaced, because the lifetime is the same as the project lifetime. Mathematically ARC is defined as
= . ( , ) (15)
where is the replacement cost of the unit and SFF is the sinking fund factor. The SFF is defined as the ratio to calculate the future value of a series equal to the annual cost. In other word
is defined as a fund or account into which a person or company deposit money on regular basis in order to repay some debt or other liability that will come due in the future, the factor is defined as
( , ) =( ) (16)
2.1.3. Annual fuel cost
Fuel consumption of other units except DG is zero. Therefore, it is assumed that the system annual fuel consumption is equal to the annual fuel consumption of the DG. It can be defined as the accumulated fuel consumption from hourly fuel consumption of DG per annum. It is assumed to be a function of the CRF for the period of the project and is defined in Equation (17)
= ∙ ( , ) (17)
2.1.1 Annual operating and maintenance cost
There are several models for estimating the AOM system. It is assumed to be a function of both inflation rate and the lifetime of the project. Therefore it is defined as
= · (1 + ) (18)
2.1.2 The cost of the wind energy conversion system
The cost of the unit consists of capital cost ( ,$/kW), land, operation and maintenance ( , $/kW) and the cost of the rectifier unit ( , $/kW). It is assumed that the lifetime of the unit is the same as the project lifetime. Therefore, the replacement cost as a result of this unit is zero. Using the factors mentioned above, the expression relating the total cost of the wind energy conversion system and the power rating of the unit is given in Equation (19)
= × (19)
where is the cost of WECS, $/kW, is the rated power of the WECS, $/kW and therefore for all WECS design alternatives ( ) is given by Equation (20).
= × (20)
where is the cost of design $/kW, is the rated power of the design $/kW and k is the number of available designs.
2.1.3 The cost solar energy conversion system
Similarly, using a similar approach, the cost of the solar energy conversion system is
= × (21)
where is the cost of the solar energy conversion system for all available design alternatives $/kW, is the cost of the solar system for design $/kW and is the rated power of the design , kW.
2.1.4 Battery storage system cost
The design variable in the case of battery storage is the capacity in kilowatt-hours. It is assumed that the lifetime of the battery is less than the life of the project. Therefore, apart from the capital, operation and maintenance costs; replacement cost is added as the coefficient of the design variable. The cost of the storage system (CST) is
= × (22)
=energy storage cost , $/kWh and = capacity of the storage, kWh.
2.1.5 Diesel generating unit cost
It is assumed that the diesel generator has a lifespan equal to that of the project, and the replacement cost is zero. The cost component includes the capital cost, operating, maintenance and fuel cost. The annual fuel consumption is also assumed to be a function of CRF during the life of the project. Therefore, the total cost of the unit is defined in Equation (23)
Capital cost = ×
Operation and maintenance= × Fuel cost = 365 ∑ × ∆ ×
where is the capital cost of the diesel generator, is the rated power of the diesel generator, is the operation and maintenance cost of the diesel generator, is the fuel cost consumed by the diesel generator at interval , is the diesel generator output at the interval
, T is the number of intervals/day, ∆ is the duration interval . The total cost of the diesel
generating unit is
= ( × ( , ) + × (1 + ) ) × + 365 × ( , )
× × ∆ ×
= × + ∑ ∆ × (23)
2.1.6 Cost of static energy conversion system
The cost of the static energy conversion system is related to the rating of the unit. Therefore it is assumed to be a function of the capital recovery factor only. The expression relating to the total cost of the unit is presented in Equation (24)
= × ( , ) × (24)
where ℎ cost of the inverter unit, $/kW, and is the power rating of the inverter unit, kW.
2.2. Objective Cost Function
The first step in the optimization problem is the development of the mathematical model of the objective function. The mathematical model is divided into the objective function and constraints. The objective of the model is to optimize annual system cost while satisfying the load requirements of the system. The objective cost function is obtained by the summation of the component costs that make up the microgrid system. The costs can be subdivided into the costs of the WECS, SECS (solar energy conversion system), storage system, diesel generating system, and fuel cost. Therefore, these combined formulate the objective function to be minimized in Equation (25)
= × + × + × + × + × + ∑ ∆ ×
(25) 2.3. Constraints
The constraints in this optimization problem always maintain a balance between power generation and demand. In this case, the constraints are classified under three main subheadings. They include power balance, energy balance and component rating constraints. Therefore, the next section determines the imposed constraints to minimize the objective function .
2.3.A. Power balance
+ × + × + × − = = 1,2 … (26)
is the decision variable representing the power output of the diesel generator at interval , kW, is the ratio of the output power of the WECS at interval to its rated power, is the ratio of the output power of the SECS at interval to its rated power, & is the decision variable representing the rated power of both wind and solar systems, is the decision variable representing the discharge efficiency of the battery, is a decision variable representing the discharge power of the batteries at the interval , kW, is a decision variable representing the amount of power needed to charge the batteries, kW and is the charging efficiency of the battery
2.3.B. Energy balance equation
The total energy supply needed to charge and discharge the storage is defined in equation (27), another constraint relating to the storage level is given in Equation (28), Equation (29) presented a constrain relating the storage level at any interval and the unit rated power, For better
performance of the battery, the battery level at any interval is kept larger than γ as in Equation (30). ∑ × ∆ = ∑ × ∆ = 1,2 … (27) + × ∆ − − × ∆ = 0 = 1,2 … (28) − QS ≤ 0 = 1,2 … (29) − γ. QS ≥ 0 = 1,2 … (30)
2.3.C. Component rating limitation
Power delivered by the diesel generator is less than or equal to its rated capacity ( )
− ≥ 0 = 1,2 … (31)
The rectifier and converter units must have a rating equal to the WECS and SECS respectively. Therefore, the corresponding costs are added to the energy conversion system.
2.3.C.1. Inverter-rectifier unit acting in inverted mode
− ( × + × + × ) ≥ 0 = 1,2 … (32)
Fig.3. Inverter mode
2.3.C.2. Inverter-rectifier unit acting in rectifier mode
When this unit is in rectifier mode, the power rectified by the unit is the excess power produced by the diesel generator, as shown in Figure 4. The expression of this constraint is
− + ≥ 0 = 1,2 … (3) DG Load Storage × × + × + × × + ×
Fig.4. Rectifier mode
It can be seen that the objective cost function and the imposed constraints are linear, and therefore linear programming is used to test the application of the developed model. Generally, linear programming may be defined as the problem of minimizing or maximizing a linear function subject to linear constraints. It has the following standard form.
min( )
Subject to the constraints as follows:
· ≤ · =
≤ ≤
where, , , , , , are vectors and and are matrices.
The output of the optimization can be used to estimate the energy output of the diesel generator on the average day ( ), the maximum possible output on any day( ) and the total annual output energy of the of the diesel generator ( ), as shown in Equations (34), (35) and (36) respectively
= ∑ × ∆ (34)
= × 24 (35)
= × 365 (36)
2.4. Application of the Developed Model
The application of the model is demonstrated using the load profile presented in Figure 4. It has peaks in the morning and evening. The wind speed and solar radiation of Belfast, United Kingdom and the data shown in Table 1 are used [21].
DG
Load
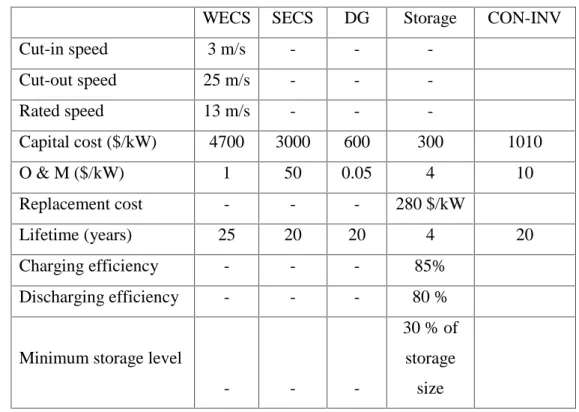
Table 1. Specification of the system components
WECS SECS DG Storage CON-INV
Cut-in speed 3 m/s - - -Cut-out speed 25 m/s - - -Rated speed 13 m/s - - -Capital cost ($/kW) 4700 3000 600 300 1010 O & M ($/kW) 1 50 0.05 4 10 Replacement cost - - - 280 $/kW Lifetime (years) 25 20 20 4 20 Charging efficiency - - - 85% Discharging efficiency - - - 80 %
Minimum storage level
- -
-30 % of storage
size
The results of this optimization procedure are shown in Table 2. The power absorbed and supplied by the system is shown in Figures 6 to 7. It can be observed that the imposed constraints are satisfied.
Fig.5. Load demand 0 20 40 60 80 100 120 140 160 180 200 1 2 3 4 5 6 7 8 9 10 11 12 13 14 15 16 17 18 19 20 21 22 23 24 L oa d de m and (kW ) Time (hr)
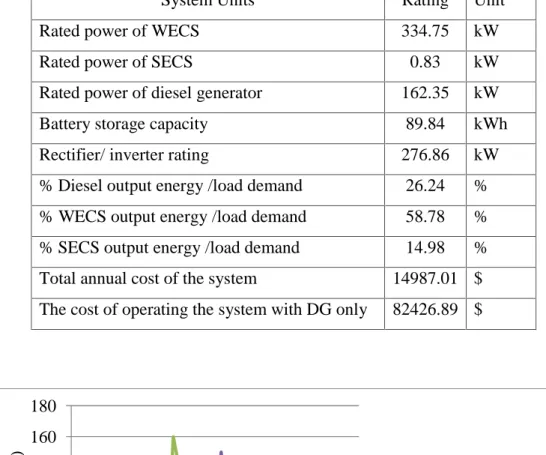
Table 2. Output of the optimization
System Units Rating Unit
Rated power of WECS 334.75 kW
Rated power of SECS 0.83 kW
Rated power of diesel generator 162.35 kW
Battery storage capacity 89.84 kWh
Rectifier/ inverter rating 276.86 kW
% Diesel output energy /load demand 26.24 % % WECS output energy /load demand 58.78 % % SECS output energy /load demand 14.98 % Total annual cost of the system 14987.01 $ The cost of operating the system with DG only 82426.89 $
Fig.6. Total power supplied. 0 20 40 60 80 100 120 140 160 180 1 3 5 7 9 11 13 15 17 19 21 23 T ot al pow er s uppl ie d (kW ) Time (hr) PSECS PWECS DG Discharging power of the battery
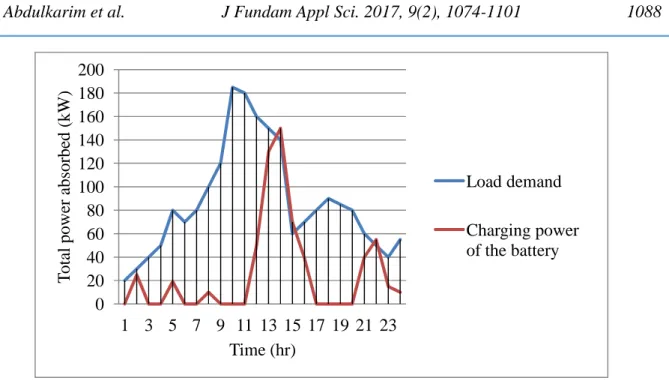
Fig.7. Total power absorbed
2.4.A. Total annual cost of the system
Figure 8 shows that the annual replacement cost of the system is very small compared with the capital, maintenance and fuel cost. The annual fuel cost of the proposed hybrid system is $7421 In the same way, the annual capital cost of the system is $5522. Similarly, the AOM of the system is $1095; which is very small compared with the capital and all other costs. Ways of reducing these costs include subsidy by the government or the manufacturers of renewable energy equipment. Another alternative is to subsidise the price of diesel. With these strategies the price of the energy produced by this type of configuration may become affordable for rural areas. Therefore, if any of the proposed strategies is implemented, the price of the energy will decrease and the affordability of the system increase.
0 20 40 60 80 100 120 140 160 180 200 1 3 5 7 9 11 13 15 17 19 21 23 T ot al pow er a bs or be d (kW ) Time (hr) Load demand Charging power of the battery
Fig.8. Annual cost of different components
2.4.B. Cost of energy produced
The output of the optimization procedure is also used to estimate the cost of energy produced by the hybrid system. This is compared with the cost when the system operates on a diesel generator alone. Analysis of the result has shown that the cost of the energy of the hybrid system is 0.020 $/kWh. On the other hand, if the system operates on the diesel generator, the cost of the energy is 0.1099 $/kWh. Figure 9 shows the cost difference between running the system on the hybrid and on the diesel generator alone. This demonstrates the viability of a hybrid renewable energy system in the proposed area of study. It can be observed that the proposed system is cheaper than operating the system on a diesel generator.
0 1 2 3 4 5 6 7 8
AFC ACC AOC ARC
C os t (× $1000/ annum )
Fig.9. Energy prices 2.4.C. Energy contribution of each unit
In terms of energy production, the renewable energy systems contribute about 73.76% of the total energy produced, while the diesel generator contributes only 26.24%. Figure 10 shows comparisons between the energy produced by the renewable energy sources and the output of the diesel generator.
Fig.10. Percentage contribution of each generator
2.4.D. Comparison of carbon emissions
Carbon emission in the atmosphere as a result of operating a system with or without renewable energy resources is also presented in Figure 11. The output shows that the carbon emission of the
0.0000 0.0200 0.0400 0.0600 0.0800 0.1000 0.1200
Hybrid System Diesel Generator Alone
E le ct rc it y pr ic e ($/ kW h ) 0 10 20 30 40 50 60 70 WECS SECS DG P er ce nt ag e of t he t ot al e ne rgy suppl ie d
proposed system is about 171 tons per annum compared with operating the system in the presence of renewable energy sources.
Fig.11. Estimated carbon mission 2.4.E. Other gas emissions
In addition to the carbon emission, other emissions as a result of burning fuels include NOx, SO2, diesel particulate matter (DPM), and NO2. In this section, the emission factors used in the analysis include 0.0021, 0.0006, 0.0001 and 0.00006 Kg/ kWh of NOx, SO2, and nitrous oxide respectively. The results of the analysis are shown in Table 3. It can be observed that the hybrid system reduced annual emissions by 318, 53, 32 and 1112 kg/kWh for SO2, DPM, NO2and NOx respectively. This represents a 70% decreased compared with operating the system on the diesel generator alone.
Table 3. Other gas emissions.
Compound Hybrid system Diesel generator Emission reduction SO2 136.43 454.43 318.00 DPM 22.74 75.74 53.00 NO2 13.64 45.44 31.80 NOx 477.50 1590.49 1112.99 0 100 200 300 400 500 600 C ar bon em is son (T onne s)
proposed system is about 171 tons per annum compared with operating the system in the presence of renewable energy sources.
Fig.11. Estimated carbon mission 2.4.E. Other gas emissions
In addition to the carbon emission, other emissions as a result of burning fuels include NOx, SO2, diesel particulate matter (DPM), and NO2. In this section, the emission factors used in the analysis include 0.0021, 0.0006, 0.0001 and 0.00006 Kg/ kWh of NOx, SO2, and nitrous oxide respectively. The results of the analysis are shown in Table 3. It can be observed that the hybrid system reduced annual emissions by 318, 53, 32 and 1112 kg/kWh for SO2, DPM, NO2and NOx respectively. This represents a 70% decreased compared with operating the system on the diesel generator alone.
Table 3. Other gas emissions.
Compound Hybrid system Diesel generator Emission reduction SO2 136.43 454.43 318.00 DPM 22.74 75.74 53.00 NO2 13.64 45.44 31.80 NOx 477.50 1590.49 1112.99 Diesel Generator Hybrid System
1. TECHNICAL EVALUATION OF THE SYSTEM
The optimization procedure uses the average day for both system demand and the renewable energy potential of the study area. It has been shown that the system uses the input data to determine the system configurations such that the ratio of the total annual cost of the system is minimized while both energy and power balances are met. Because of the fluctuations in both demand and supply, there may be days on which the system demand may not be satisfied or some days when the output of the renewable energy resources may be greater than the demand. This results in a situation when the energy not supplies to have a significant value and hence the system reliability will be altered.
Before now this type of configuration was used for pumping water only, but the present shift in the interest in the renewable energy resources has resulted in a different perspective. This means there is a need for the system to be available throughout the year. In addition, both energy and power balance must be satisfied. This results in the need for investigations on possible alternatives for improving the reliability of the system.
There are many ways of improving the reliability of the proposed system. These include increasing the installed capacity on days with energy shortage or storing the excess energy when generation is higher than demand. The former method could be achieved by increasing the capacity of the wind and solar energy conversion systems or committing diesel generator for longer periods. Improving the system reliability by storing the excess energy for another day could be done by increasing the storage system capacity. The challenge of these alternatives is to develop a method that will utilize all the fluctuations in terms of demand and the renewable energy resources.
It can be seen that the available methods in the literature are not suitable for the reliability evaluation of the proposed model [22]. This is because the effects of conventional and unconventional units on the reliability of power systems are different. In this case, the FASTCLUS method is selected for data clustering because it is suitable for large data sets [23]. The advantage of the proposed method is its suitability for taking the fluctuations in the output power of the unconventional unit on an hourly basis. Finally, the output of the clustering is combined with the conventional unit in order to evaluate the reliability of the system. It is assumed that the output of the procedure includes the cluster centroid (mean values) of each variable, frequency (number of each observations for each variable) and in-cluster (the standard
deviation of each variable). The FASTCLUS algorithm for sorting m data units into k cluster consists of the following steps [23]
Take the first data unit in the data set as a cluster of one member each. These are called cluster seeds.
Assign each of the remaining (m-k) data units to the cluster with the nearest centroid. After each assignment, the cluster seed is updated as the current mean of the cluster After all the observations are assigned, make the existing cluster a fixed seed point and
make one or more pass through the data set, assigning each data unit to the closest point. This step can be repeated until the changes in the cluster seeds become small or zero. Final clusters are formed by assigning each observation to the nearest seed.
In this case, the output of the procedure takes into consideration the correlation between the demand and the output powers of the renewable energy. On the other hand, it cannot take the relations between the successive days of the procedure into account. Therefore an improvement is introduced to the procedure of calculating the transition rates between clusters. The modification means determining the transition rates from cluster to cluster . This is achieved by counting the number of occasions that cluster j occurs subsequent to cluster and dividing by the total number of occurrences of cluster .
The procedure above is applied to chronological data of the load and out powers of the renewable energy resources. These data are converted into a number of states which is much lower than the number of original data points. This is described by a vector ( ) defined as follows
= [ , , , … , ] (37)
where = load in terms of the fraction of the peak load for state n
= ratio of the output powers of wind and solar energy conversion system to their rated powers in state .
The outputs of the optimal design are used to determine the chronological sequence of the WECS and SECS during each day. In the case of load demand, a random variable generator is used to produce a series of loads with the desired average value and standard deviation. The modification is to combine the output powers of solar and wind energy conversion systems during each day. This is achieved by dividing the maximum energy value that occurred during the whole year. Therefore, a value in the range(0 < <) is obtained. The same procedure applies to
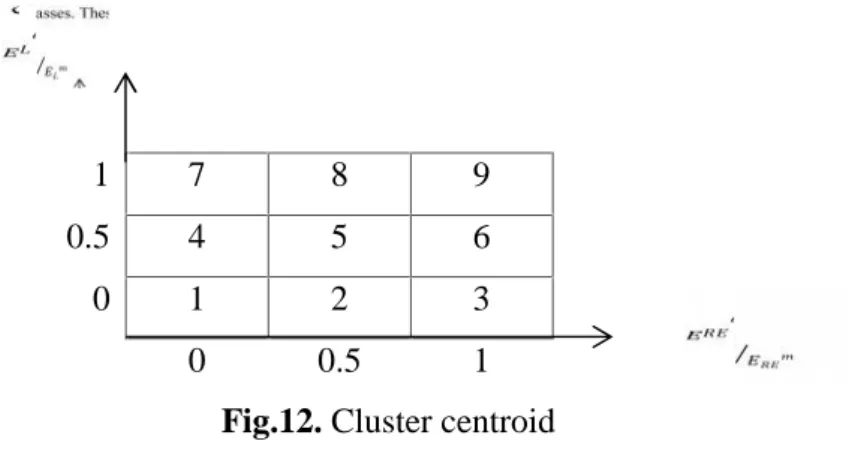
the load demand. The normalised data of the renewable energy resources and the load demand are divided into three classes. These result in nine clusters, as shown in Figure 12.
1 7 8 9
0.5 4 5 6
0 1 2 3
0 0.5 1
Fig.12. Cluster centroid
The output of the procedure is shown in Tables 4 and 5. The result of the analysis shows the cluster centroid, the frequency of occurrences and the probability.
Table 4. Data of cluster
Centroid Cluster Mean RE Mean Load Frequency Probability 1 0.1378 0.5384 43 0.1181 2 0.1861 0.5714 45 0.1236 3 0.2025 0.6389 40 0.1099 4 0.1865 0.5587 42 0.1154 5 0.1462 0.5222 33 0.0907 6 0.1750 0.5468 30 0.0824 7 0.1601 0.6045 43 0.1181 8 0.1213 0.6088 46 0.1264 9 0.1236 0.6068 42 0.1154
This presentation enables us to determine the reliability of the microgrid. When the reliability of the system is less than a predetermined value, it is possible to explore different options for improving the reliability of the system. The first step in determining the system reliability is to distribute the diesel generated power in each cluster. In this case, the algorithm for such
representation is explained as follows. When the output power of the solar and wind energy conversion systems is greater than or equal to the system demand the diesel generator will not run. In some states when the output power of the solar and wind energy conversion systems is less than the system demand, the diesel generator will run for a longer time. Applying this procedure to the output of the clustering procedure means the energy not supplied can be determined. If it is above the threshold, then the system design from the optimum design model will be optimal. The algorithm used for the determination of the system reliability is presented in [24]. If the energy not supplied is greater than the acceptable limit, then it must be decreased by one of the alternatives. In order to explore different options of improving the reliability of the proposed system, the following alternatives are described.
3.1 Reliability Improvement by Increasing Capacity of Diesel Generator
In this section a method for the improvement of system reliability by adding the capacity of the diesel generator is proposed. This is achieved by increasing the capacity by a factor EDA in the range of 0≤ ≤ , so the diesel energy is distributed according to the algorithm below
1- For the states having ≥ , = 0.0 (38)
2- For states having < , = − (39)
It can be seen that the diesel generator is limited in the range of maximum energy output of the diesel generator as determined from the optimal design. But in a state when the output required is greater than , the only option is to increase the capacity of the diesel generator. The diesel generator capacity required is defined as follows
= [( − ) ] × (40)
where & are the load and the output powers of the renewable resources for the state with a maximum energy shortage. On the other hand, is the rated power of the diesel generator determined from the optimal design. By modelling the proposed option, it is possible to obtain the additional costs defined by
= × ( − ) + × ∑ × (41)
Finally, the total cost as a result of the additional capacity of the diesel generator is given by
where F is the annual cost of the plant determined from the optimal design. In order to test the application of the proposed algorithm, the data presented in Table 3 are used. Therefore, for any value EENS similar evaluation is carried out and the result is presented in Figure 13.
Fig.13. Annual system cost against the EENS (DG option).
Also, the data presented in Table 3 are used for the determination of the renewable energy requirements of the system. The results are presented in Figures 14 and 15 for the SEC and WEC systems respectively.
Fig.14. Annual system cost against the EENS (SECS option) 0 100 200 300 400 500 600 700 800 1.40 1.05 0.70 0.35 T ot al a nnua l s y st em c os t (× $1000 )
Energy not supllied (%)
0 100 200 300 400 500 600 700 800 900 1.397 1.389 1.384 1.379 T ot al a nnua l s y st em c os t (× $ 1000 )
Fig.15. Annual system cost against the EENS (WECS option)
3.2 Reliability Improvement by the Use of Storage Units
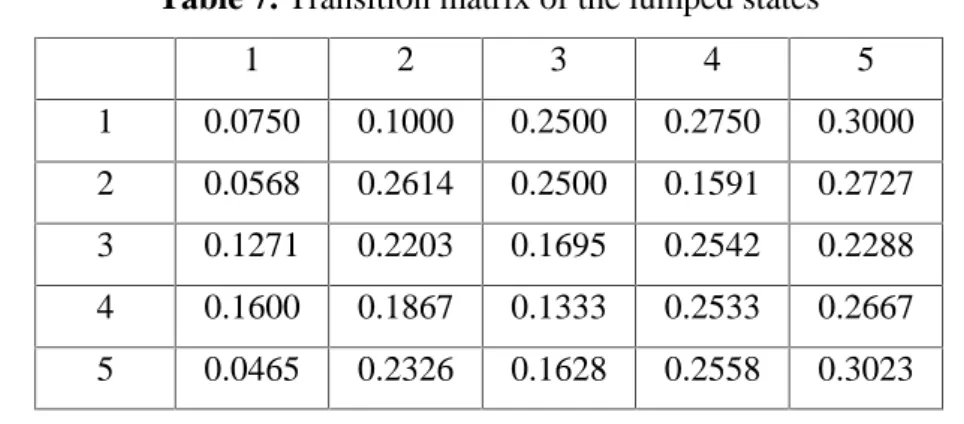
In order to investigate the capacity requirement of the system on the system cost, the knowledge of the condition between successive days is important. This is obtained by representing the relationship between these days with the help of the Markov transition matrix. The elements of this matrix are the transitions between states. Such representation enables us to construct the system cycle that is eventually used to determine the average capacity required in order to keep the system reliability within a specified value.
Average duration in each state
It is possible to obtain the mean number of days to reach a state given that the system starts at cluster . This is obtained by defining j as an absorbing state. Finally, the average number of steps in obtained by defining a matrix N as follows:
= [ − ] (43)
where Q is the matrix obtained from the transition matrix T.
Once the matrix N is obtained, the average duration in each state is defined as the average duration in the state before entering state .
, = ∑ , (44)
where
N is the number of states, 0 500 1000 1500 2000 2500 3000 3500 1.40 1.23 1.06 0.89 T ot al a nnua l s y st em c os t (× $1000 )
, : is the average time required to enter given that system in state ,.
In the case of storage capacity requirements, Figure 12 is used to lump states together. Similar states are lumped into one state. It is possible to see the following relations
= for = 1, 5 and 9 (45)
− ≈ 0.5 for = 2 and 6 (46)
− ≈ 0.5 for = 4 and 8 (47)
In this case, states 1, 5 and 9 can be seen as one state. Similarly, states 2 and 6 are lumped together as another state. States 4 and 8 are lumped together as another state while states 3 and 7 remain unchanged. The result of this analysis is also presented in Table 6. The renewable energy output powers of the system and load demand are converted as a ratio of the daily average. Table 7 shows the transition rates between the lumped states and the system cycle, these are used to obtained reliability figures.
Table 6. Lumped states
Centroid Cluster
SEC WEC Mean Load Frequency Probability
1 0.9551 1.2664 1.1065 40 0.1099
2 2.0021 1.9250 2.0220 88 0.2418
3 2.3698 2.5491 2.8878 118 0.3242
4 2.5064 2.2583 1.9367 75 0.2060
Table 7. Transition matrix of the lumped states 1 2 3 4 5 1 0.0750 0.1000 0.2500 0.2750 0.3000 2 0.0568 0.2614 0.2500 0.1591 0.2727 3 0.1271 0.2203 0.1695 0.2542 0.2288 4 0.1600 0.1867 0.1333 0.2533 0.2667 5 0.0465 0.2326 0.1628 0.2558 0.3023
Hence it is applicable for the determination of the storage capacity required to keep the system within a specified level of reliability. Finally, the annual system cost as a result of increase in the capacity of the storage system is shown in Figure 16.
Fig.16. Annual system cost against the EENS (storage option).
The results show that the wind energy conversion system is most expansive, followd by the, SECS diesel generator and storage, in that order. Hence the most economical way of improving the system reliability is to increase the capacity of the storage unit. On the other hand, the most expensive option for improving the system reliability is increasing the capacity of the WECS.
0 10 20 30 40 50 60 70 1.39708 0.00004 0.00002 0.00001 T ot al a nnul al s y st em c os t (× $ 1000 )
4.1 CONCLUSION
In this paper, the mathematical model for the optimal design of a hybrid microgrid has been developed. The output of the optimal design determined the sizes of system components. Application of the proposed procedure has been tested using the renewable energy of Belfast. The model is able to reduce the cost of energy by 80%. Also, the emissions are reduced by 70.40% compared with operating the system on a diesel generator alone. This indicates the viability of the proposed optimization procedure.
REFERENCES
[1] R.K Ullah, R. Akikur, and K.R. Saidur, "Comparative study of stand-alone and hybrid solar energy systems suitable for off-grid electrification: A review," Elsevier, no. 27, pp. 738-752, November, 2013.
[2] F Riahy and G. H. Jahanbani, "Optimum design of hybrid renewable energy system,"
Renewable Energy Trend and application, vol. 11, no. 1, pp. 231-250, 2013.
[3] Bo Zhao, X. Zhang, J. Chen, C. Wang, and L. Guo, "Operation optimization of standalone microgrids considering lifetime characteristics of battery energy storage system," IEEE
Transactions on Sustainable Energy, vol. 4, no. 4, pp. 934- 943, 2013.
[4] Lu Zhang, G. Barakat, and A. Yassine, "Design and optimal sizing of hybrid PV/wind/diesel system with battery storage by using DIRECT search algorithm," in Power Electronics and
Motion Control Conference (EPE/PEMC), Novi Sad, 2012.
[5] Lingfeng Wang and C. Singh, "PSO-based hybrid generating system design incorporating reliability evaluation and eneration/Load forecasting," in Power Tech, IEEE, Lausanne, 2007.
[6] M. Meiqin, J. Meihong, D. Wei, and L. Chang, "Multi-objective economic dispatch model for a microgrid considering reliability," in 2nd IEEE International Symposium on Power
Electronics for Distributed Generation Systems (PEDG), 2010, Hefei, 2010.
[7] Y. Yang, W. Pei, and Z. Qi, "Optimal sizing of renewable energy and CHP hybrid energy microgrid system," in Innovative Smart Grid Technologies - Asia (ISGT Asia), IEEE, Tianjin, 2012.
[8] W.D. Kellogg, M.H. Nehrir, G. Venkataramanan, and V. Gerez, "Generation unit sizing and cost analysis for stand-alone wind, photovoltaic, and hybrid/pv systems," IEEE Trans.
Energy Conversion, vol. 13, no. 1, pp. 70-75, March 1998.
[9] L. Wang and C. Singh, "Compromise between cost and reliability in optimum design of an autonomous hybrid power system using mixed-integer PSO algorithm," in International
Conference on Clean Electrical Power, ICCEP '07., Capri, 2007.
community," in International Conference on Clean Electrical Power (ICCEP), 2011, Ischia. [11] G. Halasa and J.A. Asumadu, "Wind-solar hybrid electrical power production to support
national grid: Case study - Jordan," in IEEE 6th International Power Electronics and Motion
Control Conference, IPEMC '09., Wuhan, 2009.
[12] A. Mohamed and T. Khatib, "Optimal Sizing of a pv/wind/diesel hybrid energy system for Malaysia," in IEEE International Conference onIndustrial Technology (ICIT), , Cape Town, 2013.
[13] M Laidi, S. Hanini, B. Abbad, N. K. Merzouk, and M. Abbas, "Study of a solar PV-wind-battery hybrid power system for a remotely located region in the southern Algerian sahara: case of refrigeration," Journal of Technology Innovations in Renewable Energy, vol. 1, no. 1, pp. 30-38, 2012.
[14] S.N. Bhaskara and B.H. Chowdhury, "Microgrids — A review of modeling, control, protection, simulation and future potential," San Diego, CA, 2012.
[15] A.A. Nafeh, "Optimal economical sizing of a PV-wind hybrid energy system using genetic algorithm," International Journal of Green Energy, vol. 8, pp. 25-43, 2911.
[16] L Zhang, G Barakat, and A. Yassine, "Deterministic optimization and cost analysis of hybrid PV/wind/battery/diesel power system," International journal of Renewable Energy
Research, vol. 2, no. 4, pp. 687-696, 2012.
[17] Y. Yang, W. Pei, and Z. Qi, "Optimal sizing of renewable energy and CHP hybrid energy microgrid system," in Innovative Smart Grid Technologies - Asia (ISGT Asia), IEEE, Tianjin, 2012.
[18] B. Zhao, Z. Xuesong, C. Jian, W. Caisheng, and G. Li, "Operation optimization of standalone microgrids considering lifetime characteristics of battery energy storage System,"
IEEE Transaction on Sustainable Energy, vol. 4, no. 4, pp. 934-942, 2013.
[19] S.M.M Tafreshi, H.A. Zamani, S.M. Ezzati, and H. Vahedi, "Optimal unit sizing of distributed energy resources in microrid using genetic algorithm," in Electrical Engineering
(ICEE), 18th Iranian Conference on, Isfahan, 2010.
[20] M. Vafaei and M. Kazerani, "Optimal unit-sizing of a wind-hydrogen-diesel microgrid system for a remote community," in PowerTech, IEEE Trondheim, Trondheim, 2011.
[21] M. Ghazvini, A. Abbaspour-Tehrani-Fard, M. Fotuhi-Firuzabad, and M.M. Othman, "Optimizing size and operation of hybrid energy systems," in Power Engineering and
Optimization Conference (PEOCO), IEEE 7th International, Langkawi, 2013.
How to cite this article:
Abdulkarim A, Abdelkader S M and Morrow D J. Model for optimum design of standalone hybrid renewable energy microgrids. J. Fundam. Appl. Sci., 2017, 9(2), 1074-1101.