HAL Id: hal-01005289
https://hal.archives-ouvertes.fr/hal-01005289
Submitted on 21 Feb 2017HAL is a multi-disciplinary open access archive for the deposit and dissemination of sci-entific research documents, whether they are pub-lished or not. The documents may come from teaching and research institutions in France or abroad, or from public or private research centers.
L’archive ouverte pluridisciplinaire HAL, est destinée au dépôt et à la diffusion de documents scientifiques de niveau recherche, publiés ou non, émanant des établissements d’enseignement et de recherche français ou étrangers, des laboratoires publics ou privés.
Distributed under a Creative Commons Attribution| 4.0 International License
Behavior of uncemented soils and grouted soils before
maximum shear strength
Christophe Dano, Pierre Yves Hicher
To cite this version:
Christophe Dano, Pierre Yves Hicher. Behavior of uncemented soils and grouted soils before maximum shear strength. Soils and Foundations, Japanese Geotechnical Society, 2003, 43 (4), pp.13-20. �hal-01005289�
BEHAVIOR OF UN CEMENTED SANDS AND GROUNTED SANDS
BEFORE PEAK STRENGTH
CHRISTOPHE DANoiJ and PIERRE- YvEs HrcHERii)
The results of triaxial tests carried out on both uncemented sands and sands injected by a microfine cement grout are presented in order to highlight and compare the main features of their mechanical behavior. The device used to prepare homogeneous samples of grouted sands in the laboratory is first described. The effect of the grout injection on the strength properties of three granular soils is then shown. By use of bender elements, the different evolutions of the shear modulus Gvh,max in the small strain domain along isotropic and deviatoric stress paths are presented for both
uncemented and grouted sands.
Key words: bender elements, grout injection, improvement, stiffness, strength
INTRODUCTION
The grout impregnation consists in injecting, under pressure, a fluid grout which seeps through the porous medium. The setting of the microfine cement which com-poses the grout gives rise to stable bonds between soil par-ticles. Thus, the grout injection involves both a mechani-cal improvement and a decrease of the soil permeability. The improvement of the mechanical properties resulting from the grout injection has not always been considered in a rational way in structural design: the improvement was greatly underestimated when it was not simply ignored. This could be explained by ambivalence about the quality of the grout impregnation (is the cement content homogeneous in the soil mass?) and by lack of knowledge about the mechanical behavior of grouted sands, particularly in the small and intermediate strain domain (t::;;l0-3 ). This paper intends to provide material for an answer to this question.
GROUT INJECTION IN THE LABORATORY Injection Device in the Laboratory
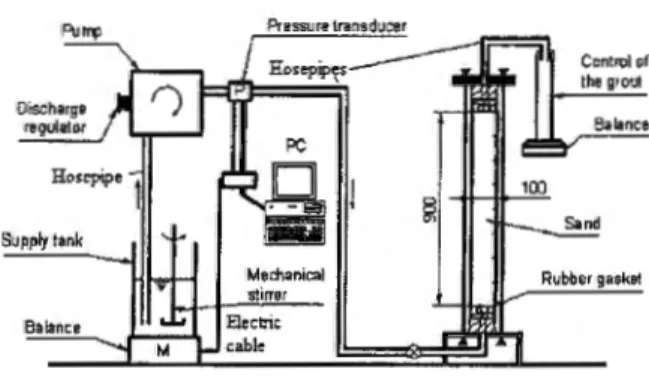
Work site conditions and spatial variability of the geotechnical properties of many soils, even on a local scale, have generally not been conducive to an extensive academic study of the behavior of grouted sands sampled in situ. Therefore, an injection device was developed in the laboratory in order to prepare homogeneous samples of grouted sands. The injection device used in this study (Fig. 1) was inspired by many previous systems described
Fig. 1. The injection device in the laboratory
in the literature (Zebovitz et al., 1989; Benhamou, 1994; Bennabi and Levacher, 1995; Tailliez, 1998).
This device is composed of a cylindrical, rigid and transparent plastic tube. It is different from previous devices (Zebovitz et al., 1989; Benhamou, 1994; Bennabi and Levacher, 1995; Tailliez, 1998) by its height (900 mm) and by its diameter (100 mm) chosen so that it is at least ten times larger than the maximum diameter of the sand particles.
The tube is filled with sand first dried and deposited by successive layers of about 100 mm. Each layer is then manually compacted by means of hammer strokes on the tube. Their number and their intensity determine the final density index Id such as:
I. _ Ymax X Y- Ymin
d-~-y Ymax- Ymin
(1)
'1 Associate Professor, Civil Engineering Laboratory of Nantes Saint-Nazaire, Ecole Centrale de Nantes, BP 92101, 44321 NANTES (Dano@ ec-nantes.fr).
111 Professor, Civil Engineering Laboratory of Nantes Saint-Nazaire, Ecole Centrale de Nantes, BP 92101, 44321 NANTES. Manuscript was received for review on July 5, 2002.
Written discussions on this paper should be submitted before March I, 2004 to the Japanese Geotechnical Society, Sugayama Bldg. 4F, Kanda Awaji-cho 2-23, Chiyoda-ku, Tokyo JOJ-0063, Japan. Upon request the closing date may be extended one month.
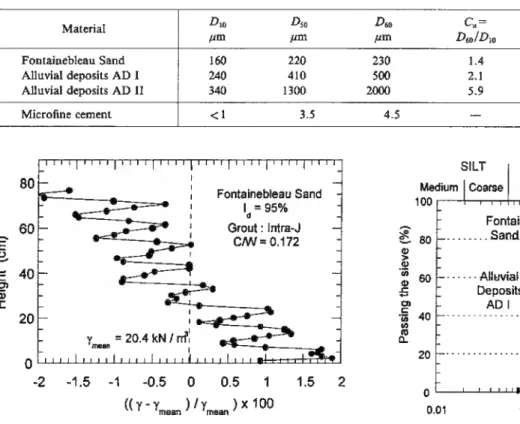
Table 1. Characteristics of the materials
--
E u ._, .E en 'iii :::r:: Material Fontainebleau Sand Alluvial deposits AD I Alluvial deposits AD II Microfine cement 80 60 40 20 D!O Dlo /liD /liD 160 220 240 410 340 1300 <I 3.5 Fontainebleau Sand I =95% ~ Grout : lntra-J CM/=0.172 O ~LULU~~~UiLuLU~~~d±~ -2 -1.5 -1 -0.5 0 0.5 1.5 2 ((y-y )ly )x100 mean meanFig. 2. Density profile of a sample of grollted Fontainebleau sand
where y is the unit weight of the soil; Ymin its minimum
unit weight and Ymax its maximum unit weight (Table 1). These two parameters Ymin and Ymax were experimentally
determined following the French Standard NF P 94-059. The repeatability of the filling method was satisfactory enough for density indexes greater than 85%: the scatter-ing of the mean density was lower than 5% from one tube to another.
The patented microfine cement grout is then injected upwards with a constant rate of discharge equal to 6 em~ /s. During injection, the mass of the grout injected into the tube, the grout pressure at the level of the pump and the height of the injection front are recorded. A linear evolution of these three parameters as a function of time provides a good indication about the homogeneity of the grouted sand over the full height of the tube (Dano, 2001). The grouting process is stopped when a volume of grout equal to 1.2 times the initial volume of voids of the sand is injected. Tubes are finally kept in water for at least 28 days.
Additional Control of the Injection Process
It is also possible to assess the homogeneity of the grouted sand 28 days after the injection in the laboratory, either by carrying out mechanical tests (destructive un-confined compressive tests, non destructive wave propa-gation tests) or by obtaining an "image" of the internal structure of the grouted sand. A density profile by gam-madensimetry was thus established on a Fontainebleau sand injected by a microfine cement grout characterized by a cement to water ratio C/W of 0.172 (Fig. 2). Its mean unit weight Ymean was 20.4 kN /m3 •
D.o /liD 230 500 2000 4.5 ~ ~ Ill > (I) ·;;; ~ Cl c: ·;;; (/) Cll Q. C = " Ymin Ymax D6o!Dw kN/m3 kN/m3 1.4 14.0 16.5 2.1 14.9 17.9 5.9 16.4 19.4 Ratio C/W 0.172 GRAVEL Medium 100.--+-.,.,rrr--+-~~~~++~~~~ · · · A~uvia~ ·; · · · Deposits :·--~'--l'>t/ AD I 40 20 0L-~~~~~~LUllll--LJ~~ 0.01 0.1 1 10 Sieve aperture (mm)
Fig. 3. Grain-size distribution curves of the three soils
The successive unevennesses observed in the profile can be imputed to particle segregation caused by the manual compaction. Indeed, the distance between two density peaks corresponds to the height of a sand layer in-troduced into the tube (100 mm). However, this heter-ogeneity remains negligible enough since the variation around the mean unit weight Ymean is only of ± 2%. The
injection procedure is also perfectly repeatable (Dano,
2001).
MECHANICAL BEHAVIOR OF UN CEMENTED AND GROUTED SANDS
Materials
Three soils were examined:
- a siliceous sand (NE 34 Fontainebleau sand) previously mentioned;
-a first class of alluvial deposits of the Seine River (Paris, France) noted AD I;
-a second class of alluvial deposits of the Seine River noted AD II.
These alluvial deposits are uncemented silico-calcareous sandy gravel. After being dried, the three soils were sub-jected to characterization tests in order to determine their respective grain-size distribution curves (Fig. 3) and their minimum and maximum unit weights (Table 1). D, stands for the diameter of the particles corresponding to a pass-ing of x%.
The patented micro fine cement grout contains water, a microfine cement whose particle diameter is less than
12 ,t.tm, an inert charge which increases the stability and fluidity of the grout, and an additive which vouches for the homogeneity of the grout.
Experimental Set-Up
Drained consolidated triaxial tests on dry uncemented and grouted sands were carried out in order to quantify the improvement of their mechanical properties. The evo-lution of the elastic properties in the small strain domain was more particularly followed. However, such a strain level cannot be reached in conventional triaxial tests because of the error sources listed by Scholey et al. (1995). In order to remedy these problems, the load cell was placed inside the triaxial cell and bender elements (piezoelectric transducers) were embedded in the lower and upper platens of the triaxial cell (Dyvik and Madhus, 1986; Brignoli et al., 1996).
The propagation of the shear wave produced by the bender elements ~}wolves very small strains (e ::-:;10-5) into the soil (Dyvik and Madhus, 1986). Therefore, an elastic behavior can be assumed in order to identify the value of the shear modulus Gvh,max in the small strain domain:
Gvh,max=pX
v~h.s=pX (~f
(2)where p is the unit mass of the soil; Vvh,s the velocity of
the shear wave; L the distance of propagation of the shear wave and Tits travel time. The subscript "vh" stands for a wave vertically propagated with horizontal particle displacements.
For the calculation of the distance L, the penetration
length of the bender elements into the soil (2 x 2.5 mm) is subtracted from the full height of the sample (about 200 mm) (Viggiani and Atkinson, I 995). The evolution of the distance L during shearing is followed on an external micrometer. It is well-known that the external measure-ment of sample shortening is not accurate because of bedding errors. However, in the case of soft uncemented sands, it induces a relative error on the value of the speci-men shortening lower than 10%. On the contrary, in the case of stiffer grouted sands, the results must be taken with precaution since the relative error on specimen shortening can reach 30% and even more (Scholey et al., 1995), even if this does not qualitatively question the evolution of the shear modulus presented in the next sections.
Also note that the repeatability greatly depends on the coupling between the grouted sample and the bender ele-ments. Indeed, a perfect contact is necessary between the sample and the transducers to transmit and receive the shear waves without any signal attenuation in addition to the one due to the propagation itself. Therefore, a small cavity is made out on both sides of the specimen. The cavity is filled in with fresh gypsum. When a good contact is obtained, the scattering of the value of Gvh,rnax remains
quite low (Fig. 8). It is about 10% in the stress range in which the value of Gvh,max is relatively constant. Finally,
volume changes of the sample were determined from the volume of the cell fluid exchanged with a volume-pressure
8 8 )> 3 > 6 6 "E. iii
e:
4 4 c. c Ill OJ 0 'iii 2 2 -'5 ~ c. Ill.=
0 0 0 Q) c :5 -2 -2 ~ 0 OJ -4 -4t5·
'0 ::s ~ -6 -6 !2.a.
E -8 -8 3 <{<
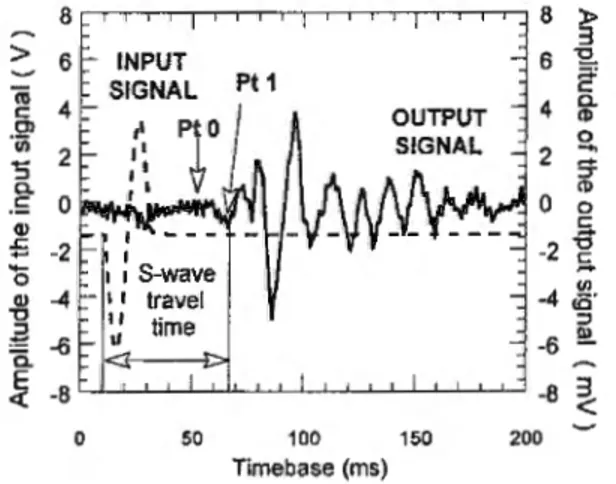
0 50 100 150 200 Timebase (ms)Fig. 4. Input and output signals obtained with the bender elements
controller (from which the cell pressure
a
;
is applied), provided that these volume changes are corrected from the change in volume due to the penetration of the piston inside the cell.The determination of the travel time T of the shear wave is less obvious. Indeed, the shear wave is never pure in that near-field effects cause the shear wave to be accom-panied by a faster compression wave. The multiple events related to the wave propagation (diffraction and reflec-tion on the grains), the finite length of the transmitter, the parallelism defect between the transmitter and the receiver, the contrast between the acoustic impedances of the soil and the transducers, the spectrum of the input signal can explain the difficulty in interpret the outputing signal. Brignoli et al. (1996) have discussed the conditions necessary to attenuate the near-field effects. Following their recommendations, the first deviation of the output signal (point 0 in Fig. 4) corresponds to the arrival of a compression wave due to near-field effects. The shear wave reaches the receiver afterwards, at point 1 in Fig. 4. This corresponds to the first change in the sign of the signal derivative (Viggiani and Atkinson, 1995; Jovicic et al., 1996).
Behavior at Large Strains-Strength Parameters
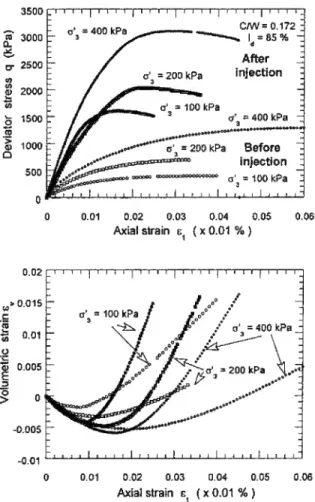
Figure 5 represents the stress-strain curves obtained by carrying out drained triaxial tests on uncemented and grouted alluvial deposits AD I. Similar trends have been observed for Fontainebleau sand and alluvial deposits AD II. In particular, the maximum strength is reached for lower strains for grouted sands than for uncemented sands. In both cases, the maximum strength depends on the mean stress (Fig. 5).
In the (p'- q) diagram (Fig. 6) where p' is the mean stress and q the deviator stress, the maximum strength envelopes of the alluvial deposits AD I, before and after injection, appear to be linear for confining pressures between 0 and 400 kPa. The friction angle of the grouted sand is slightly greater than the one of the uncemented sand. But the difference can be explained by the compac-tion of the granular skeleton during the grouting. Indeed, tests on uncemented and grouted Fontainebleau sand
~ 3000 Q.. 6 CT 2500
"'
"'
2000 ~ (ij.8
1500 .!!! > Ill 0 1000 500 0 0.02 ... 0.015 t: ~ 0.01"'
.g -m E 0.005 :::l 0 > 0 -0.005 -0.01 0 0 0.01 0.02 0.03 0.04 After injection 0.05Axial strain &1 ( x 0.01 % )
0.06
0.01 0.02 0.03 0.04 0.05 0.06
Axial strain E1 ( x 0.01 % )
Fig. S. Comparison of the behavior of alluvial deposits AD I before and afler grout injeetion
3500 !0 a.. 6 0" (I) U) ~ (I)
.,...
,_ Maximum shear 0iii stress envelop
·:; Unbound alluvial · Q) 0 deposits AD I 0 0 500 1000 150
Mean effective stress p' (kPa)
Fig. 6. Maximum strength envelopes for the unceme•ted and the grouted alluvial deposits AD 1
with the same density index for the granular skeleton sand reveal that the maximum strength envelopes are almost parallel. This means that the friction angle is hardly changed by the grout injection since low injection pressures do not disturb the granular skeleton. Conse-quently, the grout injection mainly shows the apparition of a cohesion whose value depends on the nature and the cement to water ratio C
I
W of the grout as wel1 as the nature, the density and the grading curve of the soil(Tailliez, 1998; Dano, 2001). It was found that the cohesion follows a power law of the cement to water ratio
C/W such as:
(C)
"''
c'=m, x W (3)
where m, and m2 are two constant values that mainly depend on the density index.
In both cases, the volumetric behavior is first contract-ing, then dilating. The values of the Poisson's ratio v identified in the contracting portion of the volumetric strain-deviatoric strain curves are typically between 0.2 and 0.3. The values of the dilation angle 111 are always greater for grouted sands than for uncemented sands, for a given mean stress. For the same density index /d of 85%, the values of the dilation angle remain between 5
and 16 degrees for uncemented sands and between 20 and
30 degrees for grouted sands. These values decrease when the mean stress is increased.
However, it is worth noting that differences between uncemented and grouted sands can be observed in the evolution of the volumetric strain. In grouted sands, the behavior is contracting up to about the maximum strength and then becomes strongly dilatant. In un-cemented sands, the dilatant behavior is obtained before the peak deviator stress, for a state of stress corre-sponding to the characteristic state as defined in Luong
(1980). For grouted sands, the maximum rate of
volumet-ric strains no longer coincides with the peak deviator stress, as for uncemented sands. The pre-failure behavior of grouted sands is then mainly contracting.
The values of the tangent modulus £,." were also deduced from the initial part of the stress-strain curves. They correspond to a strain level around 10-3• For
un-cemented sands, the tangent modulus clearly depends on the mean effective stress p' in such a way that:
(p
'
)"
Etan=kX Pb
(4)
where k is the value of the modulus when p'
=
p0 and n is a constant. The power n is between 0.5 and 1 depending on the strain level considered for the determination of the tangent modulus: for a strain level equal to 10-3, the value of the power n is very close to 1. The effect of the mean effective stress is less obvious for grouted sands and can be clarified by the use of bender elements.Behavior at Small Strains
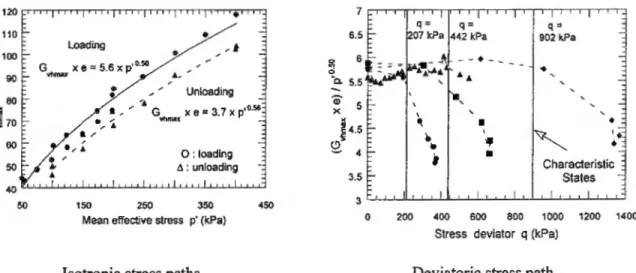
Previous research studies (Hardin and Richart, 1963; Iwasaki and Tatsuoka, 1977; Hieber, 1996) showed that the shear modulus Gvh,max in the small strain domain for uncemented sands (Fig. 7) follows the empirical correla-tion:
(p')"
Gvh,max=KXf{e) X
P
o
(5a)where f(e) is a function of the void ratio. Like (Hieber, 1996), the function f(e) = 1/e is considered.
ex-110 <0100 c..
eoo
Q) X 80i
70 Cl 60 50 50 Loading Gvhmu X e=
5.6 x p'0'50•
•
'6.
'~·
....,.
/.
,..
•
150 250 350Mean effective stress p' (kPa)
Isotropic stress paths.
450 7 6.5 0 6 "1 0 -c. 5,5
-Q) 5 X K ~ 4.5 (!J~ ~ 4 3.5 3 0 I ~•
•
'
I I..
•
200 400 600 600 1000 1200 1400Stress deviator q (kPa)
Deviatoric stress path.
Fig. 7. Evolution of the shear modulus G,h,max in the case of the uncemented Fontainebleau Sand
Fontainebleau Sand
!
= 95 o/o CIW= 0.172 G=
G + 3073 X p'0·03 vhrnu 0;95%~
=G +1301xp'0· . \ t,':J vtnnax: 0;78% Fontainebleau Sand!
=
78 % C/W= 0.172 o~~~~~~~~~~~~~-L~ 0 100 200 300 400 500Mean effective stress p' {kPa)
Isotropic stress paths.
5000rn"'r" " " r r r r . 1r n " 'r" " " r" n 4000- • • - - - ! __ .., -., 3ooo c..
e
= 2000 I-E C)'S 1000 1-Fontainebleau Sand I =95% d Cf\N = 0.172.-
-
-·
-
;-~-Characteristic stale -QWW~~~~~~~~Liww~~~~~~~~~ 0 500 1000 1500 2000 2500 3000Stress deviator q {kPa)
Deviatoric stress paths.
Fig. 8. Evolution of the shear modulus G,o,mn in the case of grouted Fontainebleau Sand
Table 2. Values of the parameters K and n (Eq. (5))
---
---
----
-,---
--
---
-Soil Fontainebleau Sand Alluvial deposits AD I Alluvial deposits AD II Parameter K 4.38 5.60 5.65 Parameter n 0.56 0.50 0.51perimental data can be fitted using a modified equation such as:
(p')n
Gvh,max =K' X Po +Go (5b)
where G0 is the value of the modulus at a confining pres-sure equal to zero and K' a constant. Figure 7 shows the evolution of Gvh,max in the case of alluvial deposits AD I for isotropic and deviatoric stress paths.
Table 2 contains the values of the parameters K and n (Eq. (Sa)) characterizing the three uncemented soils used in this study. The values of the parameter K is typically between 4 and 6 whereas the value of the power n is close
to 0.5, as previously stated by many authors (Hardin and Richart, 1963; Iwasaki and Tatsuoka, 1977; Hieber, 1996). However, the power law is accurate only for isotropic loading or unloading and in the contracting domain for a deviatoric stress path. Indeed, beyond the characteristic state, that is to say the state separating the contracting domain from the dilating domain, the values of the shear modulus Gvh,m•• tend to stabilize, then to decrease smoothly (Fig. 7). This shows the influence of the rearrangement of the contacts between particles of the granular skeleton (Shibuya et al., I 992; Kuwano et al., 1999). Along deviatoric stress paths, Eq. (Sa) should be modified in order to distinguish the effect of the major principal stress O'l and the effect of the minor principal stress a3 as usually done in the literature (see for instance Roesler, 1979).
For grouted sands, the values of the shear modulus Gvh,max in the small strain domain are at least ten times greater than the values of Gvh,max for the uncemented sands at the same density index. These values mainly
de-pend on the density of the granular skeleton (A car and El Tahir, 1986; Lade and Overton, 1989), on the cement to water ratio of the grout (Baig et al., 1997; Dano, 2001) and the filling percentage of voids (Schwarz and Krizek, 1994). The effect of the curing period, the degree of satu-ration, the strain rate, and so on was not investigated here but information can be found in the literature relative to cemented sands (Shibuya et al., 1992; Barbosa Cruz and Tatsuoka, 1999). The effect of the overconsolidation ratio was not studied either: Vucetic and Dobry (1991) showed that its effect was neg]igible in the case of granu-lar materials without fine content.
However, the evolution of Gvh,max with loading for grouted sands is radically different (Fig. 8). On the one hand, for isotropic stress paths, the dependence of the
shear modulus on the mean effective stress p' is much less pronounced. The values of the power n introduced in Eq. {5) are between 0 and 0.1 for sands injected with a grout of cement to water ratio less than 0.235. This observation is similar to the conclusions of experimental programs on cemented sands by Chang and Woods (1987) using a resonant column apparatus and by Baig et al. (1997) using bender elements.
On the other hand, for deviatoric stress paths, the shear modulus Gvh,ma., while relatively constant over a quite restricted strain domain, progressively decreases afterwards. This observation allows us to suppose that damage is here the prevailing mechanism which develops until failure. The formation of vertical cracks on the samples for strains about 2 or 3% tends to confirm this assumption.
Discussion
In the small strain domain, the friction component of the behavior that appears through the dependence of the shear modulus on the mean effective stress for
uncement-ed sands, is strongly concealed by the cementation due to grout injection. The experimental results match the
theo-retical work by Fernandez and Santamarina (2001) who showed that the effect of the mean stress could be toned down for small cement contents. This theoretical work
also predicts a constant value of the shear modulus in the
range of small stresses. The experimental results are also akin to the experimental work by Chang and Woods (1987) who concluded that the value of the power n (Eq. (5)) for a sand-cement mixture was probably between the value of n for the pure cement paste and the value of n for the granular skeleton. Isotropic compressive tests on pure
grout samples with a cement to water ratio equal to 0.172
were performed. The shear modulus Gvh,max in the small
strain domain is 0.55 GPa
(+I-
0.05 GPa). This valueremains constant over a large domain of mean effective stresses, between 0 and 450 kPa. It was thus verified that: n{grout) ""'0~ n(grouted sand)~ n(granular skeleton)"" 0.5. This finally means that the effect of the grout injection on
the stiffness of the granular material is less and Jess
sig-nificant as the mean effective stress increases.
CONCLUSIONS
From triaxial tests carried out on uncemented sands
and on sands injected in the laboratory with a microfine cement grout, the effect of the cementation on the strength and stiffness properties is shown. The use of bender elements enabled distinguishing different evolu-tions of the shear modulus in the small strain domain along isotropic and deviatoric stress paths. It should be noted that the values of the tangent modulus determined from the triaxial stress-strain curves underestimate the real values of the elastic properties. Improvement ratios defined as the ratio of the shear modulus after injection on its value before injection are greater than 10 whereas,
until now, only improvement ratios of about 2 have been considered in structural design. Finally, improvement ratios depend on the mean effective stress, on the soil characteristics and on the cement to water ratio of the grout.
REFERENCES
I) Acar, Y. B. and El Tahir, A. (1986}: Low strain dynamic properties
of artificially cemented sands, J. of Geotech. Engrg., 112(l J ),
1001-1015.
2) Baig, S., Picomell, M. and Nazarian, S. (1997): Low strain shear moduli of cemented sands, J. of Geotech. and Geoenvironmental Engrg., 123(6), 540-545.
3) Barbosa, Cruz E. R. and Tatsuoka, F. (1999): Effects of stress state during curing on stress·strain behavior of cement-mixed sand,
Proc. Pre-failure Deformation Characteristics of Geomaterials, IS Torino 99, Balkema, 509-516.
4) Benhamou, 0. (1994): Comportement rheologique des cou!is de liants hydrauliques ultra-fins destines
a
!'injection, Ph.D Thesis,Centre de Geologie de I'Ingenieur, Ecole Nationale Superieure des
Mines de Paris.
5) Bennabi, A. and Levacher, D. (1995): Application d'un produit polymere ala consolidation des sables carbonates, Revue Fran9aise de Geotechnique, (72), 55-66.
6) Brignoli, E. G. M., Gatti, M. and Stokoe, K. H. (1996): M easure-ment of shear waves in laboratory specimens by means of piezoelec-tric transducers, Geotech. Testing J., 19(4), 384-397.
7) Chang, T. S. and Woods, R. D. (1987): Effect of confining pressure
on shear modulus of cemented sand, Developments in Geotechn.
Engrg.: Soil-Structure Interaction, Elsevier, 43, 193-208. 8) Dano, C. (2001): Comportement mecanique des sols injectes, Ph.D
Thesis, Ecole Centrale et Universite de Nantes.
9) Dyvik, R. and Madhus, C. (1986): Lab measurements of Gmox using bender elements, Publication 161 of the Norwegian Geotech.
Institute, 1-7.
10) Fernandez., A. L. and Santamarina, J. C. (2001): Effect of cemen-tation on the small-strain parameters of sands, Can. Geotech. J.,
38, 191-199.
II) Hardin, B. 0. and Richart, F. E. (1963): Elastic wave velocities in
granular soils, J. of the Geotech. Engrg. Div., ASCE, 89(1 ), 33-65.
12) Hie her, P. Y. (1996): Elastic properties of soils, J. of Geotech.
Engrg., 122(8), 641-648.
13) Iwasaki, T. and Tatsuoka, F. (1977): Effects of grain size and grading on dynamic shear moduli of sands, Soils and Foundations,
17(3), 19-35.
14) Jovicic, V ., Coop, M. R. and Simic, M. (1996): Objective criteria for determining Gmax from bender element tests, Geotechnique,
46(2), 357-362.
15) Kuwano, R., Connolly, T. M. and Kuwano, J. (1999): Shear stiff-ness anisotropy measured by multi-directional bender element
Geomaterials, IS Torino 99, Balkema, 205~212.
16) Lade, P. V. and Overton, D. D. (1989): Cementation effects in fric-tional materials, J. ofGeotech. Engrg., 115(10), 1037~1053.
17) Luong, M.P. (1980): Phenomenes cycliques dans les sols
pulveru-lents, Revue Fran9aise de Geotechnique, (10), 39-53.
18) Roesler, S. K. (1979): Anisotropic shear modulus due to stress
anisotropy, J. of the Geotech. Engrg. Div., 105(7), 871-880. 19) Scholey, G. K., Frost, J.D., LoPresti, D. C. F. and Jamiolkowski,
M. (1995): A review of instrumentation for measuring small strains during triaxial testing of soil specimens, Geoteclt. Testing J., 18(2), 137-156.
20) Schwarz, L. G. and Krizek, R. J. (1994): Effect of preparation technique on permeability and strength of cement-grouted sand,
Geotech. Testing J., 17(4), 434-443.
21) Shibuya, S., Tatsuoka, F., Teachavorasinskun, S., Kong, X. J.,
Abe, F., Kim, Y.-S. and Park, C.-S. (1992): Elastic deformation properties of geomateria1s, Soils and Foundations, 32(3), 26-46. 22) Tailliez, S. (1998): Etude experimentale du comportement
meca-nique des sols granulaires injectes, Ph.D Thesis, Ecole Centrale de Paris.
23) Viggiani, G. and Atkinson, J. H. (1995): Interpretation of bender
element tests, Giotechnique, 45(1), 149-154.
24) Vucetic, M. and Dobry, R. (1991): Effect of soil plasticity on cyclic
response, J. of the Geotech. Engrg., 117( I), 89-107.
25) Zebovitz, S., Krizek, R. J. and Atmatzidis, D. K. (1989): Injection of fine sands with very fine cement grout, J. of Geotech. Engrg.,
115(12), 1717-1733.
26) French Standard NF P 94-059, Determination des masses
volu-miques minimale et maximale des sols non coherents (September 1992).