HAL Id: hal-01498220
https://hal-mines-paristech.archives-ouvertes.fr/hal-01498220
Submitted on 3 Apr 2020HAL is a multi-disciplinary open access archive for the deposit and dissemination of sci-entific research documents, whether they are pub-lished or not. The documents may come from teaching and research institutions in France or abroad, or from public or private research centers.
L’archive ouverte pluridisciplinaire HAL, est destinée au dépôt et à la diffusion de documents scientifiques de niveau recherche, publiés ou non, émanant des établissements d’enseignement et de recherche français ou étrangers, des laboratoires publics ou privés.
Role of dynamical heterogeneities on the mechanical
response of confined polymer
R.J. Masurel, P. Gelineau, Sabine Cantournet, A. Dequidt, D.R. Long, F.
Lequeux, H. Montes
To cite this version:
R.J. Masurel, P. Gelineau, Sabine Cantournet, A. Dequidt, D.R. Long, et al.. Role of dynamical heterogeneities on the mechanical response of confined polymer. Physical Review Letters, American Physical Society, 2017, 118 (4), pp.047801. �10.1103/PhysRevLett.118.047801�. �hal-01498220�
Role of dynamical heterogeneities on the mechanical response of
confined polymer
R.J. Masurel1,*, P. Gelineau1, S.Cantournet2, A. Dequidt3, D. R. Long4, F. Lequeux1, H. Montes1+
1CNRS UPMC ESPCI ParisTech PSL Res Univ, Lab. SIMM, UMR 7615, F-75231 Paris, France.
2 MINES ParisTech, PSL-Research University, MAT - Centre des Matériaux, CNRS UMR 7633, BP 87 91003 Evry, France
3Univ. Clermont Ferrand, Inst. Chim. Clermont Ferrand, UMR 6296, F-63171 Aubiere, France.
4Laboratoire Polymères et Matériaux Avancés, UMR 5268 CNRS/Solvay, 87, rue des frères Perret, F-69192 Saint Fons, France
*present address : Department of Physics, Institute for Soft Matter Synthesis and Metrology, Georgetown University,37th and O Streets N.W., Washington, D.C. 20057, USA
+Corresponding author : [email protected]
Published in PRL 118, 047801 (2017) DOI: 10.1103/PhysRevLett.118.047801
Abstract : Confinement induces various modifications in the dynamics of polymers as compared to bulk. We focus here on the role of dynamical heterogeneities on the mechanics of confined polymers. Using a simple model, that allows computation of the mechanical response over 10 decades in frequency, we show that the local mechanical coupling controlling the macroscopic response in the bulk, disappears in a confined geometry. The slowest domains significantly contribute to the mechanical response for increasing confinement. As a consequence, the apparent glass transition is broadened and shifted towards lower frequencies as confinement increases. We compare our numerical predictions with experiments performed on PEA chains in model filled elastomers. We suggest that the change of elastic coupling between domains induced by confinement should contribute significantly to the polymer mobility shift observed on filled systems.
More than 20 years ago it was established that the dynamics of confined polymers differs considerably from the bulk dynamics, as observed using various techniques [1-14]. Despite some discrepancies, a general result is that, if the polymer has a strong interaction with a solid surface, its dynamics is considerably slowed down near the surface [15-20]. Experimentally, the slowing down results in a shift of the dynamics in the vicinity of the alpha-relaxation characterizing the glass transition. An increase of the glass transition temperature with confinement is often reported for thin polymer films in strong interaction with a substrate or
confined between two surfaces [21-23]. The increase can be significant over a length up to a few tens of nanometer. This phenomenon is of crucial importance in filled polymers – such as car tires – since the confined polymeric zones between fillers have been shown to control most of the mechanical properties of the macroscopic samples [24]. In most filled polymers, a slight shift of the macroscopic glass transition temperature is observed, of the order of a few Kelvins. That shift is associated with a large broadening of the low frequency part of the alpha relaxation peak [25-28].
The change in polymer dynamics results from volume reduction and interfacial effects. According to molecular dynamics simulations [29-31], strong polymer-substrate interactions lead to structural modifications of polymer chains in the very vicinity of the surface (free volume fluctuations, changes in polymer conformation). However, recent works [32-33,60] have shown that dynamical heterogeneities may also be responsible for the impact of geometrical confinement on glass transition. In this work, we deduce the distribution of relaxation times from the bulk viscoelastic behavior. We then estimate the contribution of dynamical heterogeneities on the slowing down of confined polymer chains in strong interaction with a solid substrate.
Over the past twenty years, the strongly heterogeneous nature of glass dynamics close to Tg
has been demonstrated experimentally [35-36] using NMR [37-39], fluorescence recovery after photo-bleaching [40-45], dielectric hole-burning [46] or solvation dynamics [47]. At temperatures about 20K above Tg, the coexistence of domains with relaxation time
distributions spreading over more than 4 decades has been reported. However, the length scales of these domains are difficult to measure and would range from 3 to 5 nm and weakly increase – by less than a factor 2 – for decreasing temperature [38, 48-50] As a consequence, polymer films whose thickness is of the order of the length scale of the dynamical heterogeneities should exhibit properties different from bulk polymers [2-19].
On the theoretical side, mechanical properties of glasses have been also studied by molecular dynamics (MD) simulations [51-57] revealing that mechanical properties are heterogeneous. Papakonstantopoulos et al [56] have shown that the elastic modulus is heterogeneous at a scale of the order of 1 nm, some regions exhibiting negative moduli. However, considering the time and length scales of Molecular Dynamics simulations, heavy calculations would be required to predict the full relaxation of a system near its Tg that is composed of a significant
energy landscape paradigms [58-59] or the Non Linear Langevin Equation (NLE) [60] but they constitute mean field theories, and lack a spatial description. In order to reach relevant time and length scales, one needs to develop a coarse - grained model that accounts both for the bulk mechanical properties and for the dynamical heterogeneities. Successful demonstration that dynamical heterogeneities induce both a shift and a broadening of the glass transition in confined geometry has been obtained with such a model [34].
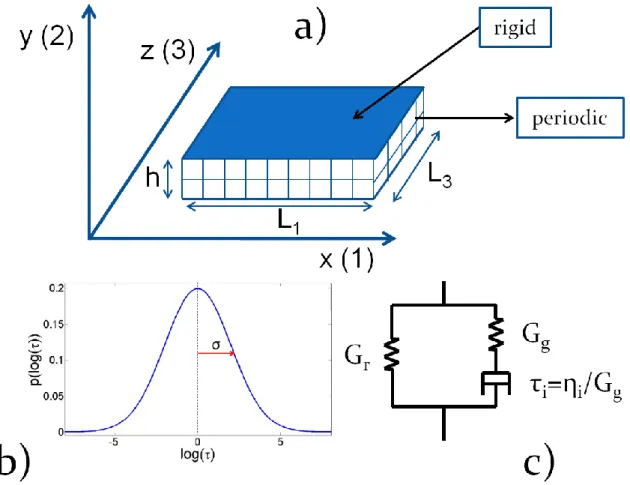
FIG. 1: (color online) Schematic representation of the model. A viscoelastic behavior is associated to each domain. A relaxation time i is randomly assigned to each domain, the
other parameters being kept constant. Each domain is constituted of 8 quadratic elements. In bulk simulations, all the boundary conditions are periodic on the three faces, whereas for confined geometry two boundaries are two parallel rigid plates with a homogeneous displacement. The mean strain tensor is imposed. The 4 other boundary conditions are periodic.
In the present work, we precisely describe how the dynamical and mechanical couplings between dynamical heterogeneities in the glass transition domain are modified by
confinement, and how they modify the macroscopic response of confined polymers as compared to bulk.
In order to analyze the effect of dynamical heterogeneities on the mechanical properties of confined glassy polymers, we have developed a simple mechanical model, in which the sample is divided into domains that represent the heterogeneities. We assume that each domain behaves as a Maxwell fluid, with a constant glassy modulus Gg and a relaxation time i distributed with a log-normal law (see figure 1). The latter assumption finds justification in
the fact that domain relaxation results from the fluctuations of a large number (a few tens) of monomers. According to the central limit theorem, the distribution of the energy barrier to be overcome should follow a Gaussian law. As a consequence, the distribution of times - which vary as the exponential of the energy barrier over thermal energy - should follow a log-normal law. In addition to the Maxwell behavior, and in order to describe the entropic stress that remains in the system after alpha- relaxation, we add simple rubber elasticity such that the viscoelastic modulus of a single domain Gi writes :
𝐺𝑖(𝜔) = 𝐺(𝜔𝜏𝑖) = 𝐺𝑔 𝑖𝜔𝜏𝑖
1+𝑖𝜔𝜏𝑖+ 𝐺𝑅 (1)
where i is the life-time of the domain i, the frequency of solicitation, Gg and GR
respectively the glassy modulus and the rubber plateau modulus. We impose continuous stress and strain between neighboring domains. Thus, our model predicts an Eshelby-like stress-strain field after the instantaneous relaxation of a single domain in a frozen matrix. These elastic couplings generate a correlation between the effective relaxation times of the domains even though their intrinsic times i are uncorrelated.
In that frame, the value of GR implicitly introduces a new length scale R, corresponding to
the distance associated with rubber elasticity: 𝜉𝑅 = 𝑏𝑁1/2 = √ 𝑘𝑇
𝑏𝐺𝑅 with b, the length and N
the number of Kuhn segments in one elastic strand. For most entangled polymers, GR values
are between 0.1 and 1 MPaleading toRof the order of 7 to 4 nm which is similar to the
range of values reported for dynamical heterogeneities in glassy polymers. This agreement confirms the relevancy of our simple model.
We have chosen to neglect the Rouse dynamics occurring at the end of the modulus relaxation towards its rubber value. In the range of the considered GR values, the number of Rouse
the polymer chains only weakly delays the relaxation of the macroscopic modulus occurring between NGR et GR. We have checked that the Rouse modes only hardly modify the modulus
by a factor NGR/Gg.
Using a 3D calculation, the viscoelastic response of the alpha-relaxation of polymers can be described in the frame of that model. A log-normal distribution of the intrinsic times i, was
chosen, characterized by its width :
𝑝(log(𝜏)) ∝ 𝑒−(log(𝜏)−log(𝜏𝑚))22𝜎2 (2)
We have checked that the width varies linearly with the inverse of the exponent of the KWW stretched exponential function. The fragility of the polymer glass thus increases with
.With the different pure polymers we have tested, we found that the value of ranges from 1.5 to 2.5.
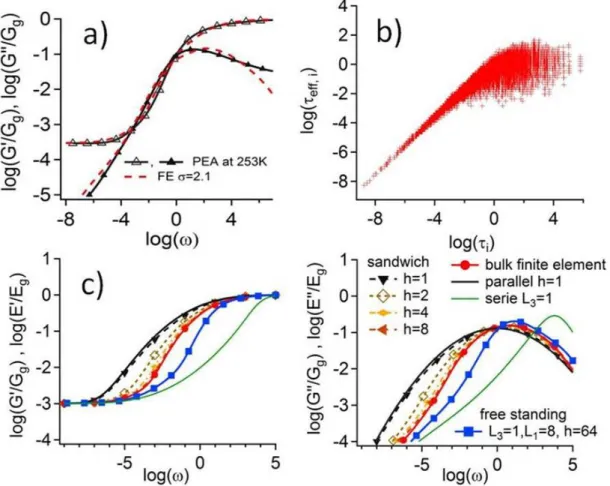
Figure 2(a) shows that the viscoelastic response measured for a cross-linked Poly(ethylacrylate) (PEA) is well described by our model over the whole 10 decades frequency range with ± GR and Gg are equal to 0.3 MPa and 0.95 GPa
respectively, and R= 5 nm. Therefore, domains which characteristic times differ of more
than 4 orders of magnitude coexist in the bulk glassy polymer. As explained in a previous work [62], the slowest domains only weakly influence the bulk viscoelasticity because they are surrounded by faster domains. After a step strain, the slow domains are quickly embedded in a low stress matrix and thus release their stress by elastic transfer to their neighbors. The relaxation of the local stress undergone by the slowest domains occurs faster than their intrinsic local time – say their relaxations if solicited alone. The effective times characterizing the relaxation of the slowest domains are thus shorter than their intrinsic times. For instance, figure 2(b) shows the correlation of i with the local effective relaxation times eff,i that is
defined by the first passage at one tenth of their initial stress. Simulations parameters are the ones that correspond to Poly(ethylacrylate) chains. Thus, the macroscopic time distribution for bulk systems is truncated at low frequency as compared to the time distribution of the domains.
We show later that confinement utterly modifies that picture. Since we aim at evidencing the role of mechanical heterogeneities on the confinement mechanics, independently of others surface induced phenomena, we choose not to take into account the dynamics modifications induced by the interactions with the substrate existing in real confined systems. Instead, we
assume that the intrinsic relaxation times of the domains are not modified by the vicinity of the substrate. We compute the simple shear apparent modulus, which corresponds to the one of a homogenous sample with the same mechanical response than the heterogeneous system we study.
FIG. 2: (color online) Viscoelastic shear modulus as a function of frequency in bulk (a) and in confined geometries (c). In (a), the value of parameter is chosen such that the numerical data describes the experimental data for Poly(ethylacrylate). In (b): is shown the correlation between the local effective relaxation times eff,i and the intrinsic times i of domains deduced
from simulations of the PEA viscoelastic modulus of fig 2a. eff,i corresponds to the time
such that the local stress of a domain is equal to Gg/10 for the first time. In (c) dashed lines
correspond to sandwich confined geometry for thicknesses of 1, 2, 4, and 8 domains. FE prediction for a 1 domain thick free standing film in tensile condition is in squares. The three asymptotic cases are purely parallel, serie and bulk calculation – similar to (a) case but for GR=10-3 GPa and Gg=1GPa.
More precisely, we have computed the viscoelastic response of a thin film between two rigid plates, moving one plate parallel to the other, as depicted in fig. 1. The upper and lower boundaries are infinitely rigid boundaries. The lateral boundary conditions are periodic in strain. We vary the film thickness from 1 to 8 domains, the total number of domains remaining equal to 512, i.e. above the minimum sample size (RVE) required to get results independent on the time spectrum drawing for all confined geometry with a precision of 5% on log(G′). The results are shown in fig. 2(c) that reports the apparent viscoelastic modulus as a function of the frequency. The calculation has been done forGg=1, GR= 10-3 and =2, that
are typical values for pure homopolymers.
We observe - for increasing confinement - both a shift of the modulus relaxation towards low frequency and a broadening of the modulus frequency dependence. For high confinement - one domain thickness -, the value of the apparent modulus can easily be estimated: each domain is submitted to a simple shear with the same deformation as the macroscopic one. As a result, the viscoelastic modulus is simply the parallel average of the domains visco-elastic modulus : 𝐺𝑒𝑓𝑓(𝜔, ℎ = 1) = ∫ 𝑃(𝜏)𝐺∗(𝜔𝜏)
+∞
0 𝑑𝜏 .
Since the width of the time distribution is huge, this one domain layer model differs by orders of magnitude from the bulk modulus.
Note that our model predicts for a free standing film of 1 domain thickness (L3=1, L1=8 and
h=64) in tensile condition a shift of the Young modulus relaxation towards high frequencies. Lastly, the mechanical response of a 1D structure (L1=L3=1 and h=) is given by the series
average of the domains viscoelastic modulus (∫ 𝑃(𝜏)𝐺∞ ∗−1(𝜔𝜏)𝑑𝜏
0 )
−1
. In t he following, we will focus on the sandwich confined geometry relevant for filled elastomers.
We analyze the local effective relaxation times eff,i- i.e. the equivalent relaxation time for
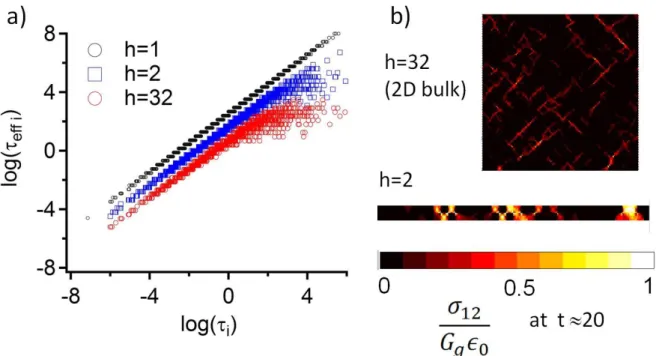
the first passage at a stress level of one tenth of its initial value. We plot, in fig. 3(a), the correlation map between the stress decay time eff,i and the intrinsic relaxation time i. As
already mentioned, in the bulk, the fast time part of the effective time spectrum is fully correlated to the intrinsic one. Nevertheless, the slowest domains relax faster than when isolated, as a result from their elastic interaction with the fast domains. Their effective relaxation times fluctuate around a limit value that increases in average with the confinement. As h decreases, the correlation between i and 𝜏𝑒𝑓𝑓,𝑖 extends towards the longest times of the
with i. Thus, the effect of confinement on the average relaxation modulus of a confined
system simply results from a loss of efficiency of the elastic interactions between domains. The couplings that induce a truncation of the time relaxation spectrum in bulk disappear for increasing confinement. As a consequence, the macroscopic time distribution tends towards the intrinsic time distribution.
FIG. 3 : (color online) (a) Correlation between the effective stress decay time – time of first passage at one tenth of the initial stress eff,i and the intrinsic time i for three confinement
values (h=1, h=2, bulk). Data for h=1 and h=2 have been respectively shifted by a factor 100 and 10. (b) Maps of shear stress at the same macroscopic relaxation time t=20 for confined (h=2) and unconfined (h=32) systems. The scale is the same in both maps.
Similar conclusions can be drawn from the stress maps during relaxation. Figure 3(b) compares the local shear stresses at the time t = 20m of the bulk (h=32) and confined (h=2)
cases for 2D calculations. At this stage of the macroscopic relaxation, the stress of the confined system is twice larger than the bulk one, and the stress is more localized. In fact the stress is transmitted for one plate to the other by paths of slow domains orientated at + and – 45°.
We now compare our model to experimental 𝑇𝑔 shifts due to confinement. NMR and
a mobility decrease of polymers chains between two fillers. Beyond a layer of thickness e0,
composed of frozen grafter molecules at the NMR time scale, the 𝑇𝑔shift in these systems can
be described by : ∆𝑇𝑔𝑁𝑀𝑅(𝑧) ≅ 𝑇𝑔 𝛿
𝑧 where z is the distance to the particle surface excluding
the grafter layer, and the length over which chains are slowed down beyond e0.
We first consider PEA/Silica systems in which interactions at the polymer/particle interface are small and the crosslink density of the polymer matrix is unchanged by addition of fillers, in particular in their vicinity [63]. NMR measurements provide a value of 0.1 nm in these samples. In what follows, we will estimate the contribution of dynamical heterogeneities to the corresponding slowing down of the dynamics.
∆𝑇𝑔𝑁𝑀𝑅 was estimated taking as reference temperature T=273K, i.e. within the glass transition
zone at the NMR frequency [63]. At that temperature, the average reorientation time 𝜏𝑐 measured by NMR roughly corresponds to a loss of 90% of the macroscopic stress. We find that the frequency at which the macroscopic modulus G’ is equal to 𝐺𝑔
10 is shifted by about 1
decade between the bulk PEA sample and the h=1 confined geometry. Consequently, we compare the 𝑇𝑔 shifts measured by NMR to the ones obtained by converting the frequency corresponding to 𝐺𝑔
10 in the simulations into a temperature. For that conversion, we use the bulk
WLF coefficients inferred from rheological curves (C1 = 18 and C2 = 77K at Tref = Tg = 253K).
Figure 4 shows the variations of Tgth(h)=(Tg(h)-Tg(h)) predicted by our simulations
for PEA chains, where h is the thickness expressed in numbers of domains, and the size of one domain equal to 5 nm in this case. Our model predicts that Tgth varies as the inverse of
the film thickness, which roughly corresponds to the long range effect observed by NMR. Note that the 1/h scaling of Tg is observed whatever the value of G’ chosen as reference to
characterize the frequency shift of the dynamics in the glass transition of the confined system. For such weak interactions with the particles, comparison of numerical and experimental data shows that the dynamical heterogeneities contribute up to 80% to the slowing down of the PEA chains close to the particle surfaces. Note that assuming =2nm the contribution of dynamical heterogeneities decreases to 40%.
FIG. 4 : (color online) logarithm of the normalized shift in Tg as a function of the logarithm of
𝑧 = 𝜉ℎ as deduced from our model, and experimental law deduced from NMR. The parameter was taken equal to 5 nm.
We now consider systems in which PEA chains are covalently bonded to particles and the crosslink density is larger at the particle/polymer interface. Assuming that the Tg value does
not increase with the crosslink density, NMR measurements give a value of 0.15 nm. In this case, assuming =5nm, heterogeneities contribute up to 50% to the slowing down observed beyond the grafter layer thickness e0 equal to 2 nm.
Consequently, the slowing down of polymer chains confined between two solid surfaces may result from other effects than heterogeneities. In the filled elastomers we consider here, the dynamics is totally frozen within a layer of thickness e0 as observed by NMR. The slowing
down induced by polymer structural modifications in the vicinity of the substrate and other short range effects like the change of the intrinsic dynamics by the vicinity of the surface [64] are included in this frozen layer of thickness e0. However, we show that dynamical
heterogeneities mainly contribute to the slowing down of the polymer chain dynamics observed beyond e0. We demonstrate that this physical effect cannot be neglected. Its
contribution can be deduced from the viscoelastic response of the bulk polymer in order to fully determine the weight of the other mechanisms at stake.
We show that the effect of dynamical heterogeneities accounts for the long range modification of the dynamics in confined systems. Our model underlines that the mechanical response of a confined system reveals the long times part of the relaxation times distribution, which cannot be revealed using bulk measurements. As a consequence, the low frequency part of the relaxation modulus is significantly broadened by confinement, over several decades whereas the maximum dissipation is shifted by only one decade. Our model predicts that Tgth(h)
increases linearly with and log(Gg/) where is the modulus level chosen to estimate the
frequency shift between bulk and confined systems. For >1 and <Gg/2, a good
approximation is given by : Δ𝑇𝑔𝑡ℎ[𝜉ℎ, 𝜎, 𝜃] ≃ 𝐶2 𝐶1 0.5𝜎 ℎ 𝑙𝑜𝑔 ( 𝐺𝑔
𝜃). That feature is consistent with
most reports on filled elastomers [65], for which the position of the relaxation peak is observed to be only slightly modified by confinement whereas its low frequency wing is always broader than the bulk one. Understanding the effects determining the mechanical behavior of confined polymers is thus of great importance for filled elastomers in which the zones confined between fillers have a major contribution to their complex mechanical response.
REFERENCES :
[1] M. D. Ediger and J. A. Forrest, Macromolecules 47, 471 (2014).
[2] J.L. Keddie, R.A.L. Jones and R.A. Cory, Europhys. Lett. 27, 59 (1994). [3] D. B. Hall, A. Dhinojwala and J. M. Torkelson, Phys. Rev. Lett. 79, 103 (1997). [4] J. Mattsson, J. A. Forrest, J. Borjesson, Phys;. Rev. E. 62, 5187 (2000).
[5] S. Kawana and R. A. L. Jones, Phys. Rev. E 63, 021501 (2001). [6] J. Q. Pham and P. F. Green, J. Chem. Phys. 116, 5801 (2002).
[7] L. Hartmann, W. Gorbatschow, J. Hauwede and F. Kremer, Eur.Phys. J. E. 8,145 (2002).
[8] C.J. Ellison and J. M. Torkelson, J.Polym. Sci. Part B : Polym. Phys. 40, 2745, (2002). [9] C. J. Ellison and J. M. Torkelson, Nat. Mater. 2, 695, (2003).
[11] J.Q. Pham and P.F. Green, Macromolecules 36,1665 (2003)
[12] J.A Forrest, K. Dalnoki-Veress, Advances in Colloid and Interface Science 94, 167 (2001).
[13] L. Zhu, X. Wang, Q. Gu, W. Chen, P. Sun and G. Xue, Macromolecules 46, 2292 (2013).
[14] F. D. Blum and P. Krisanangkura, Thermochimica Acta 492 , 55 (2009).
[15] W. E. Wallace, J. H. van Zanten and W. L. Wu , Phys. Rev. E 52, R3329 (1995). [16] J. H. van Zanten, W. E. Wallace and W. L. Wu, Phys. Rev. E 53, R2053 (1996). [17] Y. Grohens, M. Brogly, C. Labbe , M. O. David and J. Schultz, Langmuir 14, 2929 (1998).
[18] P. Carriere, Y. Grohens, J. Spevacek and J. Schultz, Langmuir 16, 5051 (2000). [19] Y. Grohens, L. Hamon, G. Reiter, A. Soldera and Y. Holl, Eur Phys. J. E 8,217 (2002).
[20] R. Ruggerone, V. Geiser, S. Dalle Vacche, Y. Leterrier and J.A.E. Manson, Macromolecules 43, 10490 (2010).
[21] A. Papon, H. Montes, M. Hanafi, F. Lequeux, L. Guy and K. Saalwachter, Phys. Rev. Lett. 108, 065702 (2012).
[22] D. S. Fryer, R. D. Peters, E.J. Kim, J. E. Tomaszewski, J. J. De Pablo, P. F. Nealey, C. C. White and W. Wu, Macromolecules, 34 5627 (2001).
[23] H. Yin, S. Napolitano and A. Schönhals, Macromolecules, 45 1652 (2012).
[24] M. Solar, L. Yelash, P. Virnau, K. Binder and W. Paul, Soft Materials 12, 580 (2014). [25] A. Papon, H. Montes, F. Lequeux, J. Oberdisse, K. Saalwaechter and L.Guy, Soft Matter 8, 4090 (2012).
[26] A. P. Holt, P. J. Griffin, V. Bocharova, A. L. Agapov, A.E. Imel, M. D. Dadmun, J. R. Sangoro and A. Sokolov, Macromolecules 47,1837 (2014).
[27] A. Mujtaba, M. Keller, S. Illich, H. J. Radusch, M. Beiner, T. Thurn-Albrecht and K. Saalwaechter, ACS Macro letters 3, 481 (2014).
[28] L. Tadiello, M. D’arienzo, B. Di Credico, T. Hanel, L. Matejka, M. Mauri, F. Morazzoni, R. Simonutti, M. Spirkova and R. Scotti, Soft Matter, 11, 4022 (2015).
[29] J. L. Barrat, J. Baschnagel and A. Lyulin, Soft Matter 6, 3430 (2010).
[30] D. V. Guseva, P. V. Komarov and A. Lyulin, J. Chem Phys. 140, 114903 (2014). [31] F. S. Starr, T. B. Schroeder and S. C. Glotzer, Macromolecules 35, 4481 (2002).
[32] D. Long and F. Lequeux, Eur. Phys. J. E. 4, 371 (2001).
[33] J. E. G. Lipson and S. T. Milner, Eur. Phys. J. B 72, 133 (2009).
[34] A. Dequidt, D. R. Long, P. Sotta and O. Sanseau, Eur. Phys. J. E. 35, 61 (2012).
[35] R. Richert, J. Phys. : Condens. Matter 14, R703, (2002). [36] M. D. Ediger, Annu. Rev. Phys. Chem. 51, 99 (2000).
[37] K. Schmidt-Rohr and H. W. Spiess, Physical Review Letters 66, 3020 (1991). [38] U. Tracht, M. Wilhelm, A. Heuer, H. Feng, K. Schmidt-Rohr and H. W. Spiess, Physical Review Letters 81, 2727 (1998).
[39] S. A. Reinsberg, X. H. Qiu, M. Wilhelm, H. W. Spiess and M. D. Ediger, J. Chem. Phys. 114, 7299 (2001).
[40] M. T. Cicerone and M. D. Ediger, J. Chem Phys. 104, 7210 (1996).
[41] M. T. Cicerone, F. R. Blackburn and M. D. Ediger, Macromolecules 28, 8224 (1995). [42] C. Y. Wang and M. D. Ediger, Macromolecules 30, 4770, (1997).
[43] Y. Hwang, T. Inoue, P. A. Wagner and M. D. Ediger, J. Polym. Sci. Part B-Polymer Physics 38, 68 (2000).
[44] M. T. Cicerone, P. A. Wagner and M. D. Ediger, J. Phys. Chem. B 101, 8727 (1997). [45] F. Fujara, B. Geil, H. Sillescu and G. Fleischer, Z. Phys. B 88, 195-204 (1992). [46] B. Schiener, R. Böhmer, A. Loidl and R. V. Chamberlin, SCIENCE 274, 752 (1996). [47] R. Richert, J. Chem. Phys. 113, 8404 (2000).
[48] D. Wang, Y. Liu, T. Nishi and K. Nakajima, Applied. Phys. Lett. 100, 251905 (2012). [49] H. K. Nguyen, D. Wang, T. P. Russell and K. Nakajima, Soft Matter 11, 1425 (2015).
[50] L. Berthier and G. Biroli, Rev. Mod. Phys. 83, 587 (2011).
[51] R. A. Riggleman, H. N. Lee, M. D. Ediger and J. J. de Pablo, Soft Matter 6,287 (2010).
[52] K. Yoshimoto, T. S. Jain, K. Van Workum, P. F. Nealey and J. J. de Pablo, Phys. Rev. Lett. 93, 175501 (2004).
[53] F. Leonforte, R. Boissiere, A. Tanguy, J. P. Wittmer and J. L. Barrat, Phys. Rev. B 72, 224206 (2005).
[54] R. A. Riggleman, H. N. Lee, M. D. Ediger and J. J. de Pablo, Phys. Rev. Lett. 99, 215501 (2007).
[55] M. Tsamados, A. Tanguy, C. Goldenberg and J. L. Barrat, Phys. Rev. E 80, 026112 (2009)
[56] G. J. Papakonstantopoulos, R. A. Riggleman, J. L. Barrat and J. J. de Pablo, Phys. Rev. E 77, 041502 (2008).
[57] R. A. Riggleman, K. S. Schweitzer and J. J. de Pablo, Macromolecules 41, 4969 (2008).
[58] P.G. Debenetti and F. H. Stillinger, Nature 410, 259 (2001). [59] A. Heuer, J. Phys. : Condens. Matter 20, 373101 (2008).
[60] K. S. Schweizer and E. J. Salztzman, J. Chem. Phys. 55, 241 (2004).
[61] R. Böhmer, K. L. Ngai, C. A. Angell and D. J. Plazek, J. Chem. Phys. 99,4201 (1993)
[62] R. Masurel, S. Cantournet, D. Long, A. Dequidt, H. Montes and F. Lequeux, Macromolecules 48, 6690 (2015).
[63] A. Papon, K. Saalwaechter, K. Schaeler, L. Guy, F. Lequeux and H. Montes, Macromolecules 44, 913 (2011).
[64] T. Salez, J. Salez, K. Dalnoki-Veress, E. Raphael and J. A. Forrest, PNAS 112, 8227 (2015).