HAL Id: hal-02492042
https://hal-mines-albi.archives-ouvertes.fr/hal-02492042
Submitted on 9 Mar 2020
HAL is a multi-disciplinary open access
archive for the deposit and dissemination of
sci-entific research documents, whether they are
pub-lished or not. The documents may come from
teaching and research institutions in France or
abroad, or from public or private research centers.
L’archive ouverte pluridisciplinaire HAL, est
destinée au dépôt et à la diffusion de documents
scientifiques de niveau recherche, publiés ou non,
émanant des établissements d’enseignement et de
recherche français ou étrangers, des laboratoires
publics ou privés.
Valorization of calcium carbonate-based solid wastes for
the treatment of hydrogen sulfide in a semi-continuous
reactor: Part II - slurry bubble column pilot
Marta Galera Martinez, Doan Pham Minh, Ange Nzihou, Patrick Sharrock
To cite this version:
Marta Galera Martinez, Doan Pham Minh, Ange Nzihou, Patrick Sharrock. Valorization of calcium
carbonate-based solid wastes for the treatment of hydrogen sulfide in a semi-continuous reactor: Part
II - slurry bubble column pilot. Chemical Engineering Journal, Elsevier, 2020, 390, pp.1-11/124576.
�10.1016/j.cej.2020.124576�. �hal-02492042�
Valorization of calcium carbonate-based solid wastes for the treatment of
hydrogen sul
fide in a semi-continuous reactor: Part II – Slurry bubble
column pilot
Marta Galera Martínez
b, Doan Pham Minh
a,b,⁎, Ange Nzihou
b, Patrick Sharrock
baInstitute of Research and Development, Duy Tan University, Da Nang 550000, Viet Nam
bUniversité de Toulouse, IMT Mines Albi, CNRS UMR 5302, Centre RAPSODEE, Campus Jarlard, Albi F-81013 cedex 09, France
•
H2S removal from the gas phase usingcalcium carbonate based solid wastes.
•
Validation of a triphasic gas/liquid/ solid process at the pilot scale.•
Validation of the process with a real gaseous effluent. Keywords: H2S removal Calcium carbonate Solid waste Triphasic process Slurry bubble column pilotThis work is devoted to the removal of H2S from the gas phase using a suspension of calcium carbonate-based
residues, recovered from the production of sodium bicarbonate. A 145 L (1.6 m height and 0.34 m internal diameter) slurry bubble column (SBC) reactor was used. The gaseous effluent was bed from the bottom and get out from the top of the column. The suspension (2–20 wt%) was recirculated from the bottom to the top by a pump. This created a counter-current regime between the gas phase (from the bottom to the top) and the liquid phase (from the top to the bottom) which favor the gas/liquid exchange inside the reactor. The influence of different parameters including solid concentration in the suspension (ws), recirculating rate of the suspension
(QR), inlet gasflow rate (QG), and volume of the suspension, was investigated. The results obtained with this
confirmed those at the lab scale, for both synthetic gaseous effluent (H2S diluted in compressed air) and real
gaseous effluent emitted by the buffer tank of a wastewater treatment plant. This allows validating the tech-nology before its deployment at the large industrial scale for H2S removal from the gas phase.
1. Introduction
Hydrogen sulfide (H2S) is an acid gas and can be found in different environments: air, surface water, underground water, soil, sediments and fossil reserves (e.g. charcoal, natural gas, petrol) [1–3]. H2S
emission is mostly due to natural processes but also to anthropogenic sources such as wastewater treatment plants (WWTP), food industry, paper mills, tanneries, petroleum refineries, wastes’ incinerators, power plants, landfill sites etc.[4–8]. At low emission concentration (0.2 ppbv to 0.2 ppmv), H2S starts to cause an odor[9]. At higher concentration
⁎Corresponding author at: Université de Toulouse, IMT Mines Albi, CNRS UMR 5302, Centre RAPSODEE, Campus Jarlard, Albi F-81013 cedex 09, France.
E-mail address:doan.phamminh@mines-albi.fr(D. Pham Minh).
(up to around 5 ppmv), this odor becomes stronger, likely the odor of rotten eggs[9]. On the other hand, the odor perception progressively decreases when H2S concentration raises to dozens of ppmv, while the effect on the human health increases (e.g. loss of smell, eye irritation, serious respiratory irritation, loss of consciousness)[9].
Methods for H2S removal from the gas phase have been developed for years and can be classified into three main categories: adsorption
[10–16], absorption[17–22]and biological treatment[23–28]. These methods have been deployed at large industrial scale[29,30], but they still need improvement to reduce cost and to increase performance. For example, adsorption using activated carbon modified with iron oxide is efficient but the cost of this adsorbent is high (around 4000 € per ton). Biological treatment has low cost compared to adsorption and absorp-tion, but it is sensible to the environment (temperature, humidity, gas matrix)[31]. The valorization of selected industrial byproducts of low
cost, which could match the criteria of a good sorbent, appears as pertinent route. From this point of view, our research team has studied the reactivity of calcium carbonate-based wastes rejected by the in-dustry of sodium bicarbonate production. This later is an important chemical for the gas emission control of wastes’ incinerators and its annual production reached around 53 million tons in the world in 2015
[32]. Most of them are produced by the Solvay process[33], which is accompanied by large amounts of brines containing calcium-rich mi-nerals. Before discharging in the environment (river, sea and ocean), these brines must be neutralized by a natural carbonation process (CO2 from the atmosphere) or an accelerated carbonation process (injection of CO2 into brines), resulting respectively to NPC (naturally-pre-cipitated carbonate) and APC (artificially-precipitated carbonate) – two kinds of calcium carbonate-based wastes.
Our previous work showed that both NPC and APC had very good Abbreviation
a gas–liquid interfacial area (m2/m3) APC artificially-precipitated carbonate
CI inlet H2S concentration (ppmv)
CV volume solid concentration (%) DA gas diffusion coefficient in the liquid db bubble diameter (m)
DC column diameter (m)
dS Sauter mean bubble diameter (m)
kL coefficient of gas/liquid mass transfer from the liquid-side
(m/s)
Eff efficiency of H2S removal (%)
m slope of the curves
NPC naturally-precipitated carbonate
PS water vapor pressure (MPa)
PT total pressure (MPa)
QG inlet gasflow rate (m3/h)
QR liquid recirculating rate (L/h)
SBC slurry bubble column
T temperature (K)
Ug superficial gas velocity (m/s) ws solid content
WWTP wastewater treatment plant
εG gas retention yield
ρG gas density (kg/m3)
ρL liquid density (kg/m3)
ρS solid density (kg/m3)
σL surface tension of the liquid (N/m)
μL dynamic viscosity of the liquid (Pa s) Γ gas sparger type
performance in the removal of H2S from the gas phase at the lab scale
[34]. Calcium carbonate solid particles and soluble mineral species, which are initially present in NPC and APC, favored the H2S removal from the gas phase according to the following steps[34]:
- Dissolution of calcium carbonate and other impurities (MxAy) leading to the release of cations and anions in solution:
→ + + − CaCO3( )s Ca(2aq.) CO3(2aq.) (1) + → + − − − CO3(2aq.) H O2 HCO3(aq.) OH (2) ⇄ + + − M Ax y s xMnaq yAaq m ( ) ( .) ( .) (3)
- Dissolution of O2and dissolution and dissociation of H2S: → O2( )g O2(aq.) (4) → H S2 ( )g H S2 (aq.) (5) + ⇄ − + + H S2 (aq.) H O2 HS(aq.) H O3 (aq.) (6) + ⇄ + − − + HS(aq.) H O2 S2 H O3 (aq.) (7)
- Neutralization of soluble sulfide species: + − ⇄ − + − H S2 (aq.) CO3(2aq.) HS(aq.) HCO3(aq.) (8) + ⇄ + − − − − HS(aq.) CO3(2aq.) S(2aq.) HCO3(aq.) (9) + −⇄ − + H S2 (aq.) OH HS(aq.) H O2 (10) + ⇄ + − − − HS(aq.) OH S(2aq.) H O2 (11)
- Oxidation of sulfide species (S − aq n
( ), equivalent to the sum of
− −
H S2 (aq.),HS(aq.)andS(2aq.)):
+ ⇄ + + +
− − − −
S(naq.) O2(aq.) S( .)s SO3(2aq.) SO4(2aq.) S O2 3(2aq.) (12)
- Possible precipitation of soluble S-containing compounds with me-tallic cations:
+ + + + ⇄
+ + − − −
Ca(2aq.) M(naq.) SO3(2aq.) SO4(2aq.) S O2 3(2aq.) solid precipitates
(13) For a possible technology transfer to a large industrial scale, pilot test must be performed to validate the concept. This is the main ob-jective of the present work. H2S removal from the gas phase was studied at the pilot scale using both synthetic gas emission and real gas emis-sion from the buffer tank of a WWTP.
2. Materials and methods
Both calcium carbonate-based wastes, NPC and APC, were provided by our industrial partner (the world leader in sodium bicarbonate production). Both NPC and APC are underfine power form and could be directly used after a simple pretreatment by drying. Details on the chemical composition and physico-chemical properties of these mate-rials are available in[34].
The reactor used in this work is a slurry bubble column (SBC). The scheme of this reactor is presented inFig. 1. The choice of this reactor is
based on the“know-how” of our industrial partner, the world leader in sodium bicarbonate production. The reactor is composed of a column of 1.60 m height (four removable sub-columns of 0.4 m height each) and 0.34 m diameter made by PVC (nominal volume of 145 L). The column is divided into three zones. Zone 1, called bubble zone, is found at the bottom of the column where the aqueous suspension of NPC or APC particles is accumulated by gravity and where the gaseous effluent is fed to the reactor. At the bottom of the reactor, the suspension which get out the column is pumped to the head of the column with controlled liquid circulatingflow rate (QR, m3/h). Zone 2 is composed of 6 trays which allow increasing gas/liquid exchange surface. Zone 3 is found at the top of the column where the suspension is injected to the column by pumping. With this reactor, the suspension is circulated from the bottom to the top of the reactor by a pump, and from the top to the bottom by gravity. The gaseous stream is injected at the bottom of the reactor and goes up to the top before leaving the reactor. The counter-current regime of gaseous and liquid fluids enhances the gas/liquid contact.Table 1shows the operational limits of the column.
H2S removal experiments were carried out with both synthetic and real gaseous effluents. Synthetic gaseous effluent was obtained by mixing compressed air with pure H2S from a gas bottle. The con-centration of H2S was set at 150–200 ppmv, which is typical con-centration of H2S emitted from buffer tanks of WWTP. Real gaseous effluent was recovered from the buffer tank of the WWTP (capacity of wastewater treatment: 7500 m3/day) in Graulhet city (France). In fact, the buffer tank of this WWTP is covered to send emitted gases to a biological gas treatment system. This latter had usually technical pro-blems related to weather conditions, which requires new technical so-lutions. In this work, a part of the gas emitted by the buffer tank has been extracted and injected to the SBC, installed on-site, for the eva-luation of the performance of this pilot. The concentration of H2S in the real gaseous effluent was found in the range of 5–200 ppmv, depending on the day and the weather conditions.
In order to start an experiment, an aqueous suspension of NPC and APC wasfirstly prepared using demineralized water. The solid content varied from 2 to 20 wt%. This suspension was kept homogeneous under stirring and pomped to the column. At the same time, compressed air was fed to the reactor from the bottom to keep particles under sus-pension. The total volume of the suspension fed to the reactor was between 40 and 70 L. Then, the experiment of H2S removal started by switching compressed air to gaseous effluent containing H2S. For the blank test, only demineralized water was pumped to the column instead of a suspension. During the experiment, both the inlet and outlet con-centrations of H2S as well as the pH of the suspension was continuously monitored. Details on these analyses could be found in[34]. Liquid samples were periodically withdrawn andfiltered with a 0.45 µm fil-tration-paper to separate sorbent particles, and thefiltrate was analyzed by ICP-OES (for the determination of soluble metals) and ionic chro-matography (for the determination of S2−, SO3−, SO4−, S2O32−)[34]. Experiments were repeated at least twice and in all cases, the ratio of standard deviation to mean value of the H2S removal efficiency was smaller than 3%. This confirmed the good repeatability of the tests.
The efficiency of H2S removal is defined by Eq.(14):
= − × Eff H S H S H S . (%) [ ] [ ] [ ] 100 G I G O G I 2 , 2 , 2 , (14)
where H S[ 2 ]G I, and H S[ 2 ]G O, were respectively the inlet and outlet
concentration of gaseous H2S measured during the experiments.
3. Results
3.1. Blank test
Blank test was carried out with demineralized water and synthetic gaseous effluent in order to determinate the effect of water on the
Table 1
Operational limits of the triphasic bubble column reactor.
Parameter Minimum Maximum
Suspension volume (L) 40 70
Solid content ws(wt.%) 0 20
removal of H2S. The results is presented in Fig. 2. Inlet H2S con-centration varied in the range of 150–170 ppmv. At the beginning of the test, the H2S removal efficiency reached around 50% due to the dis-solution of H2S in water. Then, it progressively decreased to around 2–10% within 60 first min of time-on-stream. After 60 min, the H2S removal efficiency seemed to be stabilized around 2–10%. It should be reminded that with this reactor, gaseous effluent was continuously fed to the reactor while the volume of water wasfixed at 40 L and was not renewed. The stabilization of the H2S removal efficiency above 60 min could be explained by the oxidation of dissolved sulfide species (H2S (aq.), HS−(aq.), S2−(aq)) into elemental sulfur and other products of higher oxidation degrees, e.g. SO3−, SO4−, and S2O32−[34]. During the re-action, the pH of the solution slightly decreased, due to the dissolution of H2S as acid gas as well as the formation of soluble sulfide species. 3.2. Comparison of NPC and APC
Previous study with a reactor at lab scale[34]showed that APC was systematically more reactive than NPC explained by the composition and structure of each material. In fact, as mentioned in our previous work[34], APC generally contains more impurities (Na, Mg, S) than NPC. In particular, aqueous suspension of APC (10 wt%) contains much more soluble species (Na, Mg, Ca, Cl, S) than that prepared from NPC. About the physical aspect, APC and NPC have comparable particle size distribution, varying from ca. 0.4 up to 300–400 µm. About the struc-tural aspect, NPC principally contains calcite while APC contains both calcite and vaterite as highlighted by XRD and FTIR analysis[34]. In order to confirm the result obtained at the lab scale, APC and NPC suspensions were tested under the same conditions at large pilot scale.
Fig. 3shows the H2S removal efficiency obtained with these two ma-terials when the removal of H2S stabilized. Once again, APC was found to be more reactive than NPC, which confirms the results obtained at lab scale. In fact, APC was formed by an artificial carbonation and was more soluble in water than NPC which was obtained by a long natural carbonation. Thus, the suspension of APC contains more soluble anions of CO32−and OH−than those in the suspension of NPC. These anions could neutralize soluble species of H2S(aq.)and HS−(aq.)(Eqs.(8) to (11)). Also, the suspension of APC contains more species such as Ca2+and Mg2+than that of NPC; these species being able to catalyze the oxi-dation of sulfide species (Eq.(12))[34].
3.3. Influence of the solid content
The higher reactivity of APC compared to NPC has been confirmed at the pilot scale. Thus, this solid waste was selected for the next steps.
Fig. 4 shows the impact of APC concentration on the H2S removal
Fig. 2. Blank test: H2S removal with demineralized water (VL= 40 L, QR= 350 L/h, QG= 3 m3/h).
Fig. 3. Comparison of the reactivity of NPC and APC. Conditions: 40 L of sus-pension containing 10 wt% of NPC or APC; QG= 3 m3/h; QR= 350 L/h;
CI= 150–200 ppmv of H2S.
Fig. 4. Influence of the solid concentration (APC) on the efficiency of H2S
re-moval. Conditions: 40 L de suspension; QG = 3 m3/h; QR = 350 L/h;
efficiency. As expected, increasing the APC concentration led to an increase of the H2S removal efficiency. Adding only 2 wt% of APC al-lowed increasing the H2S removal efficiency from around 8% (blank test,Fig. 2) to around 61%. At 5 wt% of APC, the H2S removal effi-ciency reached around 72%. Above 5 wt% of APC, the H2S removal efficiency only slightly increased to 74 and 78% at 10 and 20 wt% of APC, respectively. This behavior was already observed at the lab scale
[34]. Taking into account the fact that energy consumed for the re-circulation of the suspension by pumping increases with the solid content, a compromise needs to be established between the solid con-tent, the gain in the H2S removal efficiency and the energy consumed by the pump.
3.4. Influence of the contact time
The contact time could be controlled by changing the volume of the suspension, the recirculation rate of the suspension, and the inlet gas flow rate.Fig. 5shows the influence of the recirculating rate of the
suspension on the H2S removal efficiency. Compared to a stirring re-actor, the recirculating rate of the suspension plays a similar role as the stirring rotation to keep solid particles in suspension and guarantee the gas-to-liquid transfer. The impact of the recirculating rate of the sus-pension was investigated at different suspension volumes (40 or 60 L) and different solid contents (2 and 20 wt% of APC). In all cases, the H2S removal efficiency was practically unchanged with the recirculating rate. So the process was not limited by gas-to-liquid transfer under the conditions used.
Fig. 6shows the impact of the suspension volume on the H2S re-moval efficiency for two values of the solid content of 2 and 20 wt%. Increasing the suspension volume allowed increasing the contact time
of H2S with the suspension, which improve the H2S removal efficiency. For the suspension containing 2 wt% of APC, a linear increase of the H2S removal efficiency as a function of the increase of the suspension volume was observed. For the suspension containing 20 wt% of APC, even with only two experiments at 40 and 60 L of suspension, the evolution of H2S removal efficiency seemed to linearly increase with the suspension volume. Once again, these results confirmed those ob-tained at lab scale[34].
64 61 0 20 40 60 80 100 200 350 E ff (% ) QR(L/h) (a) 69 67 0 20 40 60 80 100 200 350 E ff (% ) QR(L/h) (b) 82 78 0 20 40 60 80 100 200 350 E ff (% ) QR(L/h) (c) 89 88 0 20 40 60 80 100 200 350 E ff (% ) QR(L/h) (d)
Fig. 5. Influence of the liquid recirculation rate (QR) on the efficiency of H2S removal. Conditions: QG= 3 m3/h; CI= 150–200 ppmv of H2S. (a): 40 L of 2 wt%; (b)
60 L of 2 wt%; (c) 40 L of 20 wt%; (d) 60 L of 20 wt%.
Fig. 6. Influence of suspension volume on the efficiency of H2S removal.
Conditions: Suspension of APC; QG= 3 m3/h; QR= 350 L/h; CI= 150–200
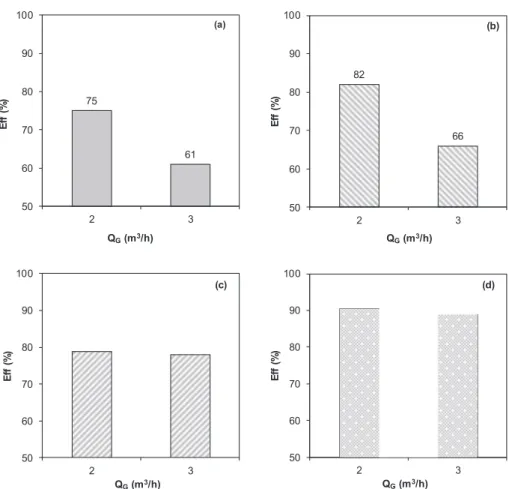
The impact of the inlet gasflow rate (QG) on the H2S removal ef-ficiency was performed at different suspension volumes (40 and 60 L) and different solid contents (2 and 20 wt% of APC). The result is pre-sented inFig. 7. At low solid content of 2 wt% (Fig. 7a and b), the H2S removal efficiency strongly decreased when QG increased from 2 to 3 m3/h. As shown in Eqs.(1) to (13), the H
2S removal starts by the dissolution of H2S into the liquid phase. Thus, increasing QGreduces gas-liquid contact time and limits the dissolution of H2S to the liquid phase.
At high solid content of 20 wt% (Fig. 7c and d), the H2S removal efficiency also decreased when QGincreased from 2 to 3 m3/h, but with a smaller extend. High solid content led to high availability of metallic cations, e.g. Ca2+, Mg2+, and high pH of suspension, which favor the dissolution of H2S and the oxidation of sulfide species[34]. So, the H2S removal efficiency was less impacted by QG.
3.5. Evolution of the suspension: pH
The pH of the suspension was periodically monitored and similar behavior was observed for all the tests performed with APC and NPC at the pilot scale. As example,Fig. 8shows the pH evolution obtained with 40 L of suspension containing 2 wt% of APC. The pH seemed to follow the evolution of H2S removal efficiency. The initial pH of the suspen-sion reached around 8.8 as a result of the dissolution of calcium car-bonate (Eqs.(1) and (2)). When the gaseous effluent passed through the
suspension, H2S from the gas phase was dissolved in the liquid phase to form soluble H2S(aq.)which neutralized the basicity of the suspension (Eq.(8)–(11)). This neutralization decreased the initial pH within the zone 1 inFig. 8. Then, the pH became stable around 8 within the zone 2 inFig. 8. In fact, the consumption of calcium carbonate by H2S was very small compared to the initial quantity of calcium carbonate introduced
into the reactor. Thus, the pH was stable and conditioned by the equilibrium of calcium carbonate dissolution in water.
3.6. Evolution of the suspension: soluble species
Fig. 9shows the concentration evolution of the main species in the liquid phase during the reaction. The term“S” means the sum of all S-containing species in the liquid phase.Fig. 9(a) and (b) report the re-sults obtained with a suspension of APC containing 10 and 2 wt% of solid particles, respectively. Generally, the evolution of Na, Mg, Ca and S in the liquid phase was similar to each other. But their concentration changed with the solid content of the suspensions.
It is reminded that the initial APC already contained sulfur
75 61 50 60 70 80 90 100 2 3 E ff (% ) QG(m3/h) (a) 82 66 50 60 70 80 90 100 2 3 E ff (% ) QG(m3/h) (b) 50 60 70 80 90 100 2 3 E ff (% ) QG(m3/h) (c) 50 60 70 80 90 100 2 3 E ff (% ) QG(m3/h) (d)
Fig. 7. Influence of the inlet gaz flow rate on the efficiency of H2S removal using APC. Conditions: QR= 350 m3/h; CI= 150–200 ppmv of H2S. (a): 40 L of 2 wt%;
(b): 60 L of 2 wt%; (c): 40 L of 20 wt%; (d) 60 L of 20 wt%.
Fig. 8. Evolution of the pH of the suspension. Conditions: 40 L of suspension containing 2 wt% of APC; QG= 3 m3/h; QR= 350 L/h; CI= 150–200 ppmv of
compounds [34]. When APC was dispersed in water to prepared the suspension, these sulfur compounds were dissolved in water which explains the initial concentration of S-containing compounds at the zero time in Fig. 9. Also, the partial dissolution of calcium carbonate, magnesium carbonate and sodium carbonate in water explains the
initial concentration of calcium, magnesium and sodium of the sus-pensions. For both suspensions, the concentration of soluble sodium and magnesium only slightly increased. On the other hand, the con-centration of soluble calcium and S-containing compounds remarkably increased with the reaction time, according to the dissolution of cal-cium carbonate (Eqs.(1) and (2)) and hydrogen sulfide (Eqs.(4)–(12)). 3.7. Evolution of total concentration of sulfur in the solid phase
During the reaction, the total concentration of sulfur in the solid phase was also analyzed. As an example,Fig. 10shows the results ob-tained with a suspension of 10 wt% APC. The total S concentration increased with the reaction time, which could be explained by the formation of elemental sulfur (Eq.(12)) and of the insoluble S-con-taining compounds (Eq.(13)). This again confirmed the observations at the lab scale[34]. H2S from the gas phase was accumulated in both soluble and solid forms.
3.8. Hydrodynamic of the column
In order to explain the effect of operational parameters on the ef-ficiency of the column, the algorithm developed by Lemoine et al.[35]
has been used. This algorithm was built from more than 3000 experi-mental works, and consider the following factors: i) the geometry of the reactor; ii) the properties of the environment (gas, liquid, solid); and iii) the operational conditions. For the column used in this work, the fol-lowing equations could be established[35,36]:
⎜ ⎟ ⎜ ⎟ ⎜ ⎟ = ∙ ⎛ ⎝ ⎞ ⎠ ⎛ ⎝ − ⎞ ⎠ ⎛ ⎝ + ⎞ ⎠ − − − − − ε ρ ρ μ σ U P P P D D C ρ d 4.94 10 1 Γ exp ( 2.23 0.16 ) G L G L L G T T S C C V S S 3 0.42 0.18 0.17 0.27 0.55 0.20 0.12 0.05 0.24 (15) = − a ε ε d 6 (1 ) G G b (16) ⎜ ⎟ ⎜ ⎟⎜ ⎟ = ∙ ⎛ ⎝ ⎞ ⎠ ⎛ ⎝ ⎜ ⎞ ⎠ ⎟⎛ ⎝ ⎞ ⎠ ⎛ ⎝ + ⎞ ⎠ k a ρ μ ρ σ ε U d D T D D 6.14 10 1 Γ L L L G L G g b A C C 4 0.26 0.12 0.06 0.52 1.21 0.12 0.05 0.50 0.68 0.04 0.11 (17) where:εGgas retention yield;ρLliquid density (kg/m3); ρ
Ggas density
(kg/m3); μ
Ldynamic viscosity of the liquid (Pa s); σLsurface tension of
the liquid (N/m); Ug superficial gas velocity (m/s); PT total pressure
(MPa);PSwater vapor pressure (MPa); DCcolumn diameter (m);Γ gas
sparger type;CV volume solid concentration (%);ρSsolid density (kg/
m3); dSSauter mean bubble diameter (m);agas–liquid interfacial area
(m2/m3);db bubble diameter (m); kL coefficient of gas/liquid mass transfer from the liquid-side (m/s);DAgas diffusion coefficient in the
liquid;T temperature (K);
Fig. 9. Evolution of the concentration of Ca, Mg, Na and S in the liquid phase. Conditions: a) 40 L of suspension containing 10 wt% of APC, QR= 350 L/h,
QG= 3 m3/h; b) 60 L of suspension containing 2 wt% of APC, QR= 350 L/h, QG= 3 m3/h.
Fig. 10. Evolution of the total S concentration in the solid phase. Conditions: 40 L of suspension containing 10 wt% of APC, QR= 150 L/h, QG= 3 m3/h.
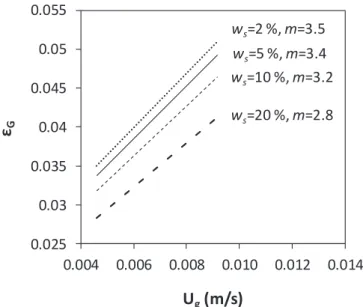
Fig. 11. Influence of the solid content and the superficial gas velocity on the gas retention yield; ws: solid content, m: slope of the curves.
3.8.1. Gas retention yield (εG)
The Eq.(15)allows estimating the value of the gas retention yield (εG) as function of the operational conditions.Fig. 11shows that at a given superficial gas velocity (Ug), the gas retention yield (εG) decreases
with the increase of the solid content of the suspensions. In fact,fine solid particles could increase of the dynamic viscosity and the density of the suspension, and so cause the coalescence of gas bubbles. At a given solid content, the gas retention yield increases with the superficial gas velocity because the latter favors the formation of turbulences which enhance the accumulation of gas bubbles in the suspension[37].
From the values estimated for the slope (m) of the gas retention yield inFig. 11, theflow regime of the gas phase could be predicted. In fact, in the literature, it has been reported that the flow regime is homogeneous when m ≥ 1, and is heterogeneous when m < 1
[38,39]. Thus, for the suspension studied in this work, the homo-geneous regime is predominant.
3.8.2. Mass transfer
The value ofkLwas estimated at around 5∙10−4m/s. This value is close to the values reported in the literature for bubble column reactors
[37,40,41]. As shown inFig. 12, the gas–liquid interfacial area (a) is highly reduced by increasing the solid content at a given superficial gas velocity. This is the direct consequence of the decrease of the gas re-tention yield when the solid content increases. On the other hand, at a given solid content, the gas–liquid interfacial area increases with the superficial gas velocity. As explained before, the increase of the su-perficial gas velocity favors the formation of turbulences which allows increasing the accumulation of gas bubbles in the suspension. Similar impact of the solid content and the superficial gas velocity on the evolution of k aL is observed.
The increase of the superficial gas velocity (Ug) allows increasing the
gas–liquid interfacial area (a), but this decreases the H2S removal ef-ficiency. In fact, H2S has low solubility in water and the suspension could be quickly saturated with soluble H2S(aq.). By definition in Eq.
(14), the H2S removal efficiency depends on inlet and outlet H2S con-centration; this latter is limited by H2S elimination rate (Eqs.(4)–(13)). Increasing more inlet H2S than H2S elimination rate leads to the de-crease of H2S removal yield, despite the increase of the gas–liquid in-terfacial area (a).
3.9. Removal of H2S from the gas phase emitted by a wastewater treatment plant
Before deploying the technology of H2S removal from the gas phase using NPC or APC suspension, experiments with gases emitted by the buffer tank of a WWTP were performed. It is reminded that the initial concentration of H2S emitted by a WWTP’s buffer tank strongly depends in the weather conditions. Particularly, when it rains, H2S concentra-tion is practically zero.
Thefirst experiment was done with water without sorbent. The gaseous effluent continuously passed through the column for 51 h. However, the inlet and outlet H2S concentration could only be mea-sured during the day (mostly between 8 a.m. and 5p.m.), and no data was obtained during the night and the week-end because of the re-striction to the access to the site.Fig. 13shows the results obtained with this blank test. At the beginning of each day where H2S concentration was monitored, thefirst points of H2S inlet concentration was zero due to the response delay. For these points, the H2S removal efficiency is automatically set at 0%. As expected, the inlet H2S concentration varied as a function of the weather conditions and was found in the range of around 20–200 ppmv. The outlet H2S concentration seemed to follow the inlet H2S concentration. In the absence of solid particles of NPC or
Fig. 12. Influence of the solid content and the superficial gas velocity on the surface of G/L transfer (a) and on the volume coefficient of mass transfer (k aL ).
Inlet H2S Outlet H2S
Eff
APC, the H2S removal efficiency was smaller than 20%. These results again confirms those obtained with a synthetic gaseous effluent pre-sented inFig. 2. Without APC or NPC, water was not efficient for H2S removal.
Fig. 14 shows the results obtained with 70 L of the suspension
containing 5 wt% of APC at the recirculation rate of 250 L/h and the inlet gasflow rate of 2 m3/h. This experiment was continuously kept for 17 days. Once again, the inlet H2S concentration strongly varied as a function of the weather conditions. It generally increased from the morning to the afternoon because of the higher humidity and lower
Fig. 14. H2S removal from gas emission by a WWTP’s buffer tank using APC suspension. Conditions: 70 L of water containing 5 wt% of APC, QR= 250 L/h,
temperature in the morning compared to the afternoon. In some cases, when it rained (days 11 and 15), the inlet H2S concentration fell to zero. In all cases and regardless the inlet H2S concentration, the H2S removal efficiency was always higher than 60%, mostly close to 100%. For ex-ample, during the 17th day, the H2S removal efficiency was always above 95%.
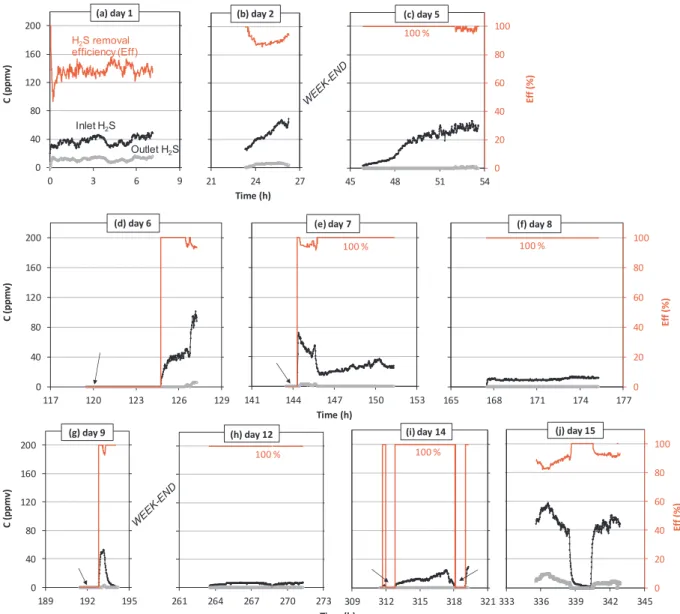
Fig. 15 shows the results obtained under the same conditions compared to those inFig. 14, except for the inlet gasflow rate of 3 m3/h instead of 2 m3/h. This experiment was continuously kept for 15 days. During this experiment, it rained more frequently (days 6, 9, 14 and 15) where the inlet H2S concentration fell to zero several times. The results obtained were similar to those inFig. 14. The H2S removal efficiency was mostly found within 80–100%.
These results demonstrated the potential application of APC as a low cost and efficient sorbent for H2S removal from the gas phase, using the concept of the triphasic gas/liquid/solid reactor.
4. Conclusions
The reactivity of calcium carbonate-based sorbents (APC: arti fi-cially-precipitated calcium carbonate, and NPC: naturally-precipitated calcium carbonate), by-products recovered from the production of
sodium bicarbonate, was investigated in the removal of H2S from the gas phase, using a 145 L slurry bubble column (SBC). This reactor al-lows performing a semi-continuous process: the gaseous effluent con-taining H2S is continuously fed to the reactor while the volume of the suspension containing APC or NPC was unchanged. The experiments carried out with a synthetic gaseous effluent (H2S diluted in compressed air) at this pilot scale confirmed the results obtained at the lab scale in our previous work[34]. The experiments performed with the gaseous effluent emitted from the buffer tank of a WWTP were also conclusive. This constitute the basis for the future deployment of this technology at large industrial scale for the treatment of H2S from the gas phase.
Declaration of Competing Interest
The authors declare that they have no known competingfinancial interests or personal relationships that could have appeared to influ-ence the work reported in this paper.
Acknowledgment
The authors gratefully thank Solvay forfinancial support and our colleagues at RASPODEE center for technical help.
Inlet H2S
Outlet H2S H2S removal efficiency (Eff)
Fig. 15. H2S removal from gas emission by a WWTP’s buffer tank using APC suspension. Conditions: 70 L of water containing 5 wt% of APC, QR= 250 L/h,
References
[1] K. Adam, M. Bisson, L. Duchêne, F. Ghillebaert, D. Guillard, K. Tack, I. Zdanévitch, Sulfure d’hydrogène, DRC-07-83451-15432B, INERIS, 2011.
[2] T. Raabe, M. Mehne, H. Rasser, H. Krause, S. Kureti, Study on iron-based adsorbents for alternating removal of H2S and O2 from natural gas and biogas, Chem. Eng. J. 371 (2019) 738–749.
[3] V. Asili, A. De Visscher, Mechanistic model for ultraviolet degradation of H2S and NOx in waste gas, Chem. Eng. J. 244 (2014) 597–603.
[4] O.A. Habeed, R. Kanthasamy, G.A.M. Ali, S. Sethupathi, R.B.M. Yunus, Hydrogen sulfide emission sources, regulations, and removal techniques: a review, Rev. Chem. Eng. 34 (6) (2018) 837–854.
[5] Y. Long, Y. Fang, D. Shen, H. Feng, T. Chen, Hydrogen sulfide (H2S) emission control by aerobic sulfate reduction in landfill, Sci. Rep. 6 (2016) 38103. [6] B. Predicala, M. Nemati, S. Stade, C. Laguë, Control of H2S emission from swine
manure using Na-nitrite and Na-molybdate, J. Hazard. Mat. 154 (1–3) (2008) 300–309.
[7] R. Lebrero, L. Bouchy, R. Stuetz, R. Muñoz, Odor assessment and management in wastewater treatment plants: a review, Crit. Rev. Env. Sci. Technol. 41 (2011) 915–950.
[8] Q. Mahmood, P. Zheng, J. Cai, Y. Hayat, M.J. Hassan, D. Wu, B. Hu, Sources of sulfide in waste streams and current biotechnologies for its removal, J. Zhejiang Univ. Sci. A 8 (7) (2007) 1126–1140.
[9] F.R.P. Ouliquen, E. Aquitaine, T. Elf, P. La Defense, Hydrogen sulfide, Ullmann’s Encyclopedia of Industrial Chemistry. (2012) pp. 429–446.
[10] D. Montes, E. Tocuyo, E. González, D. Rodríguez, R. Solano, R. Atencio, M.A. Ramos, A. Moronta, Reactive H2S chemisorption on mesoporous silica mo-lecular sieve-supported CuO or ZnO, Microporous Mesoporous Mater. 168 (2013) 111–120.
[11] A. Davydov, K.T. Chuang, A.R. Sanger, Mechanism of H2S oxidation by ferric oxide and hydroxide surfaces, J. Phys. Chem. B 5647 (98) (1998) 4745–4752. [12] K. Stepova, D. Maquarrie, I. Krip, Modified bentonites as adsorbents of hydrogen
sulfide gases, Appl. Clay Sci. 42 (3–4) (2009) 625–628.
[13] K. Jung, O. Joo, C. Kim, Study on the structure of Fe/MgO catalysts for H2S wet oxidation, Catal. Let. 84 (2002) 53–57.
[14] A. Bagreev, S. Bashkova, D.C. Locke, T.J. Bandosz, Sewage sludge-derived materials as efficient adsorbents for removal of hydrogen sulfide, Environ. Sci. Technol. 35 (7) (2001) 1537–1543.
[15] T.J. Bandosz, K.A. Block, Removal of hydrogen sulfide on composite sewage sludge-industrial sludge-based adsorbents, Ind. Eng. Chem. Res. 45 (10) (2006) 3666–3672.
[16] A. Ros, M.A. Montes-Moran, E. Fuente, D.M. Nevskaia, M.J. Martin, Dried sludges and sludge-based chars for H2S removal at low temperature: influence of sewage sludge characteristics, Environ. Sci. Technol. 40 (1) (2006) 302–309.
[17] L. Dubois, D. Thomas, Comparison of various alkaline solutions for H2S/CO2-se-lective absorption applied to biogas purification, Chem. Eng. Technol. 33 (10) (2010) 1601–1609.
[18] J. Zhang, Z. Tong, Study on catalytic wet oxidation of H2S into sulfur on Fe/Cu catalyst, J. Nat. Gas Chem. 15 (1) (2006) 63–69.
[19] J. Zhang, Z. Tong, H2S removal with cupric chloride for producing sulfur, Chinese J. Chem. Eng. 14 (6) (2006) 810–813.
[20] A. Couvert, C. Sanchez, A. Laplanche, C. Renner, Scrubbing intensification for sulphur and ammonia compounds removal, Chemosphere 70 (8) (2008) 1510–1517.
[21] H. ter Maat, J.A. Hogendoorn, G.F. Versteeg, The removal of hydrogen sulfide from gas streams using an aqueous metal sulfate absorbent. Part II. The regeneration of
copper sulfide to copper oxide – an experimental study, Separ. Purif. Technol. 43 (2005) 199–213.
[22] O. Yildirim, A.A. Kiss, N. Hüser, K. Leßmann, E.Y. Kenig, Reactive absorption in chemical process industry: a review on current activities, Chem. Eng. J. 213 (2012) 371–391.
[23] M. Ramirez, J.M. Gómez, D. Cantero, J. Páca, M. Halecký, E.I. Kozliak, M. Sobotka, Hydrogen sulfide removal from air by Acidithiobacillus thiooxidans in a trickle bed reactor, Folia Microbiol. 54 (5) (2009) 409–414.
[24] E.Y. Lee, K.-S. Cho, H.W. Ryu, Simultaneous removal of H2S and NH3 in biofilter inoculated with Acidithiobacillus thiooxidans TAS, J. Biosci. Bioeng. 99 (6) (2005) 611–615.
[25] M. Ramírez, J.M. Gómez, G. Aroca, D. Cantero, Removal of hydrogen sulfide by immobilized Thiobacillus thioparus in a biotricklingfilter packed with poly-urethane foam, Bioresour Technol. 100 (21) (2009) 4989–4995.
[26] Y.L. Ma, B.L. Yang, J.L. Zhao, Removal of H2S by Thiobacillus denitrificans im-mobilized on different matrices, Bioresour. Technol. 97 (16) (2006) 2041–2046. [27] S. Potivichayanon, P. Pokethitiyook, M. Kruatrachue, Hydrogen sulfide removal by
a novelfixed-film bioscrubber system, Process Biochem. 41 (3) (2006) 708–715. [28] A.M. Montebello, M. Fernández, F. Almenglo, M. Ramírez, D. Cantero, M. Baeza, D. Gabriel, Simultaneous methylmercaptan and hydrogen sulfide removal in the desulfurization of biogas in aerobic and anoxic biotricklingfilters, Chem. Eng. J. 200–202 (2012) 237–246.
[29] A. Couvert, I. Charron, A. Laplanche, C. Renner, L. Patria, B. Requieme, Treatment of odorous sulphur compounds by chemical scrubbing with hydrogen peroxide-Application to a laboratory plant, Chem. Eng. Sci. 61 (22) (2006) 7240–7248. [30] J. Krischan, A. Makaruk, M. Harasek, Design and scale-up of an oxidative scrubbing
process for the selective removal of hydrogen sulfide from biogas, J. Hazard. Mater. 215–216 (2012) 49–56.
[31] E. Dumont, H2S removal from biogas using bioreactors: a review, Int. J. Ener. Env. 6 (5) (2015) 479–498.
[32] http://www.societechimiquedefrance.fr/extras/Donnees/mine/naco/texnaco. htm#Productions. Accessed on December 31, 2019.
[33] E. Solvay. Ammoniacal process for the manufacture of carbonates of soda. CA7019 (A), January 24, 1877.
[34] M. Galera Martínez, D. Pham Minh, A. Nzihou, P. Sharrock, Valorization of calcium carbonate-based solid wastes for the treatment of hydrogen sulfide in a semi-con-tinuous reactor, Chem. Eng. J. 360 (2019) 1167–1176.
[35] R. Lemoine, A. Behkish, L. Sehabiague, Y.J. Heintz, R. Oukaci, B.I. Morsi, An al-gorithm for predicting the hydrodynamic and mass transfer parameters in bubble column and slurry bubble column reactors, Fuel Process. Technol. 89 (4) (2008) 322–343.
[36] M. Galera Martinez, Valorisation des Residus Carbonates Industriels pour le Traitement de Sulfure D'hydrogene Dans les Effluents Gazeux, PhD thesis University Toulouse III, 2015.
[37] P. Trambouze, J.-P. Euzen, Les réacteurs chimiques. Editions TECHNIP, Publications de l’institut français du pétrole, 2002.
[38] K.C. Ruthiya, V.P. Chilekar, M.J.F. Wariner, J. Van Der Schaaf, B.F.M. Kuster, J.C. Schouten, J.R. Van Ommen, Detecting regime transitions in slurry bubble columns using pressure time series, AIChE J. 51 (7) (2005) 1951–1965. [39] B.N. Thorat, J.B. Joshi, Regime transition in bubble columns: experimental and
predictions, Exp. Therm. Fluid Sci. 28 (5) (2004) 423–430.
[40] C. Roizard, G. Wild, J.-C. Charpentier, Absorption avec réaction chimique, Tech. l’ingénieur (1997) J1079.
[41] J.-L. Houzelot, Réacteurs chimiques polyphasés Couplage réaction/diffusion, Techn. l’ingénieur (2000) J4012.