Publisher’s version / Version de l'éditeur:
Vous avez des questions? Nous pouvons vous aider. Pour communiquer directement avec un auteur, consultez la première page de la revue dans laquelle son article a été publié afin de trouver ses coordonnées. Si vous n’arrivez pas à les repérer, communiquez avec nous à PublicationsArchive-ArchivesPublications@nrc-cnrc.gc.ca.
Questions? Contact the NRC Publications Archive team at
PublicationsArchive-ArchivesPublications@nrc-cnrc.gc.ca. If you wish to email the authors directly, please see the first page of the publication for their contact information.
https://publications-cnrc.canada.ca/fra/droits
L’accès à ce site Web et l’utilisation de son contenu sont assujettis aux conditions présentées dans le site LISEZ CES CONDITIONS ATTENTIVEMENT AVANT D’UTILISER CE SITE WEB.
Building Research Note, 1983-03
READ THESE TERMS AND CONDITIONS CAREFULLY BEFORE USING THIS WEBSITE.
https://nrc-publications.canada.ca/eng/copyright
NRC Publications Archive Record / Notice des Archives des publications du CNRC : https://nrc-publications.canada.ca/eng/view/object/?id=0c3de97b-4a6c-437b-a48b-cb6b711f9f40 https://publications-cnrc.canada.ca/fra/voir/objet/?id=0c3de97b-4a6c-437b-a48b-cb6b711f9f40
NRC Publications Archive
Archives des publications du CNRC
This publication could be one of several versions: author’s original, accepted manuscript or the publisher’s version. / La version de cette publication peut être l’une des suivantes : la version prépublication de l’auteur, la version acceptée du manuscrit ou la version de l’éditeur.
For the publisher’s version, please access the DOI link below./ Pour consulter la version de l’éditeur, utilisez le lien DOI ci-dessous.
https://doi.org/10.4224/40000515
Access and use of this website and the material on it are subject to the Terms and Conditions set forth at
An inventory of canadian building stock, 1980
Amt
IHVEUTORY OF WHADIAN BUILDING STOCK, 1980by F. S t e e l
Division of Building Research, Nat%onal Research Council Canada
Ottawa, War& 1983
M
IWEHTORY OF CMDIM BUIWIW STOCK, 1980by
F. Steel
T h i s note presents a s i m p l e method o f calculating an inventory of buildings in Canada f r o m readily available data about construction
a c t i v i t i e s . It indicates the calcnlated age, location, s i z e and number of
major building types and suggests that existing data from tax assessment records k used to produce more accurate inventortes on a routine b a s i s -
The 8 million residential d w e l l i n g units in Canada (at the end of
1980) are estimated to have a f l o o r area of 7 4 0 m i l l i o n m2 and to be contained within 4.7 million buildings. Assuming an average 1980
construction cost of $430 p e r square metre, these units have a replacement
value df $320 b i l l i o n (in 1980 dollars).
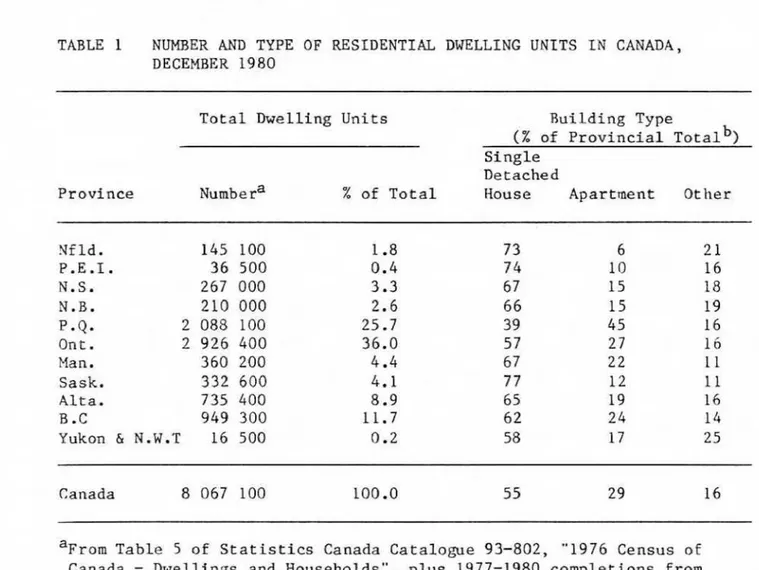
The number of dwelling u n i t s in each province and the percentage that
are s i n g l e detached houses or apartments are s h m in Table 1. ?This table is based on information obtained from t h e 1976 Census of Canada and from
recorded b u i l d i n g completions in subsequent years.
TABLE 1 NUMBER AND TYPE OF RESIDENTIAL DWELLING W I T S IN CANADA, DECEMBER 1980
Province
Total Dwelling Units Building Type
(g of Provincial ~ o t a l ~ )
Single
Detached
House Apartment: Other
% of Total Nf l d . 145
LOO
P . E . 1 . 36 500 M.S. 267 000 N . B . 210 000 P.Q. 2 088 10Q O n t . 2 926 406 Man. 360 200 Sask. 332 600 A l t a . 735 400 I3 .C 949 300 Yukon & N.W.T 16 500 . - . . Canada 8 067 100 100.0 5 5 2 9 16a ~ r o m Table 5 of S t a t i s t i c s Canada Catalogue 93-802, "1976 Census of Canada - Dwellings and Households", plus 1977-1980 completions from T a b l e 4 of WCts "Canadian Housing S t a t i s t i c s 1980".
b ~ a l c u l a t e d from 1976 values from T a b l e 5 of Statistics Canada
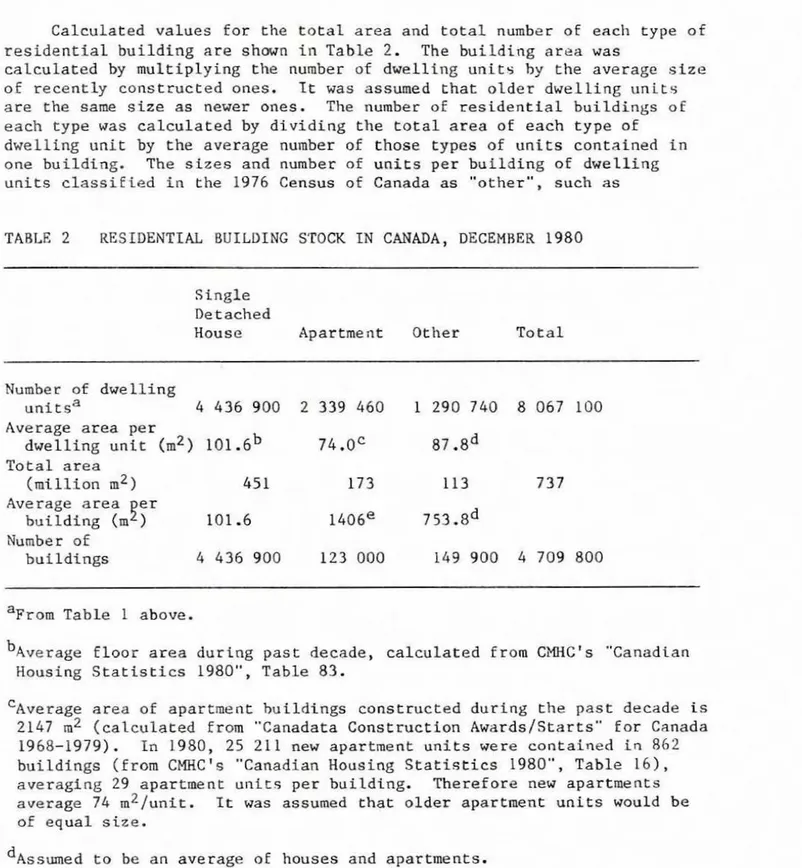
Calculated values for the t o t a l area and total number a€ each type of
r e s i d e n t i a l b u i l d i n g are shwn in Table 2 - The b u i l d i n g area was
calculated by multiplying the number of dwelling units by t h e average size of recently constructed ones. Xt was assumed that older dwelling units
are the same: size as newer ones. The number of residentfal buildings of each t y p e was calculated by d i v i d i n g the t o t a l area of each type of
dwelling unit by the average number of those types of units contained in one building. The sizes and number o f units p e r building of d w e l l i n g
units classified i n the 1976 Census of Canada as "other", such as
TABLE 2 RESIDENTIAL BUILDING STOGK IN CAPIAUA, DECEMBER 1980
S i ngle Detached
House Apartment Other Total
Number of dwelling
unit sa 4 434 900 2 339 460 1 290 740 8 047 100
Average area per
dwelling unit
(m2)
101,6 b74
.OC 87 .8dTotal area ( m i l l i o n m2) 451 113 Average area er building (m ) 101.6 7 53 ,8d Number of buildings 4 436 900 149 900 4 709 800
=prom Table 1 above.
b ~ v e r a g e f l w r area during p a s t decade, calculated from CMHCts "Canadian
Housing S t a t i s t i c s 1980", T a b l e 83.
'~venra~e area of apartment b u i l d i n g s constructed during the p a s t decade is
2147 rn2 (calculared from "Canadata Construction Awards/Startsm' for Canada
1968-1979). In 1980, 25 211 new apartment units w e r e contained in 862
buildings (from CHRC's "Canadian Housing S t a t i s t i c s 1980m, Table 1 6 1 , averaging 29 apartment un-its per building. Therefore new apartments
average 74 m2/unit. It w a s assumed that older apartment u n i t s would be
of equal size.
d~ssllmad ta be an average of h w s e a and apartments.
%xisting apartment b u i l d i n g s contain an average oE 19 dwelling units
(calculated from CMHC's "Canadian Housing S t a r t s t i c s 1980", T a b l e 1 7 3 .
A t
74
m2/unit, an average existtng a p a r m n t building has an area ofd u p l e x e s , raw houses and mobile horns, were assumed f o r stmplicity t o be midway between those of s i n g l e dctacl~ed huuses and apartiwnts. A mrr3
d e t a i l e d but time-consuming investigation of the average s i z e of " o t l ~ e r " dwelling u n i t s may have l e d t o more accurate results. Furtl~ermore, i €
more accurate information could have been obtained about t y p i c a l sizes of alder duelling units, a more accurate calculation could be made of t h e
total area of residential buildings. The magnitude of error i n the
results of these calculations that may be caused by using t h e s e
s i m p l i f y i n g assumprions f s not known.
Lacat i o n
The Iocatian of residential building stock by provfnce is shown i n
Table 1. S t a t i s tics Canada Catalogue 93-802, "1976 Census of Canada", shows the number of each type of dwelling unit by c i t y or town and by size
of p o p u l a t i o n centre, Dn a Canada-wtde basis in 1976, 78% of residential dwelling u n i t s were located in centres of more than 5 000 population and
542 were i n centres of more than 100 000.
The percentage a f existing residential building stock of any given age is s h m in F i g u r e 1. Values are based an annual completions g i v e n in
YEAR
OF
CONSTRUCT l ON40 30 20 70
AGE
CMHC1s "Canadian Housing Sratistics 1980" for the years 1931 through 1980.
There were 8 067 100 dwelling u n i t s in Canada in 1980, of which 5 940 OUO were completed after 1930. Therefore the difference, ar 26 per cent of
t h e existing stock of r e s i d e n t i a l dwelling units, m s r have been more than 50 years o l d in 1980.
Figure 1 was derived from data expressed i n term of dwelling units but it m y be considered t o represent building area or the number of residential buildings if it is assumed that older d w e l l i n g units are similar 5n floor area to newer units or that the average number of units
per buildlng has remained r e l a t i v e l y constant w i t h time,
Some adjustment should be made to Figure 1 t o allow for building losses through demolition, fire or other causes. CMKC has estimated t h a t annual l o s s e s of residential buildings amount to about 0.6% of the rota1
stock, but s i n c e losses by building age are unknmm, no useful correction
by age can be made t o Figure I .
The mid-1981 value of the n o n r e s i d e a t i a l building s t o c k is estimated
t a have been $380 b i l l i o n (in 1981 d o l l a r s ) - T h i s is based on t h e 1901 value of $286 billion for the 50-year inventory of stock reported in S t a t i s t i c s Canada Catalogue 13-21 1, "Fixed C a p i t a l P l o w s and Stocks", but
adjusted t o represent the value of a l l existing aon-residential buildfng
s t o c k . It has been assmed t h a t t h e value of the 50-year inventory
provided by Statistics Canada would represent only about throe quarters of the value of existing stock, so the value of that S o y e a r inventory has been multiplied by 1,33* to estimate the total value of all existing Ron-
r e s i d e n t i a l building stock.
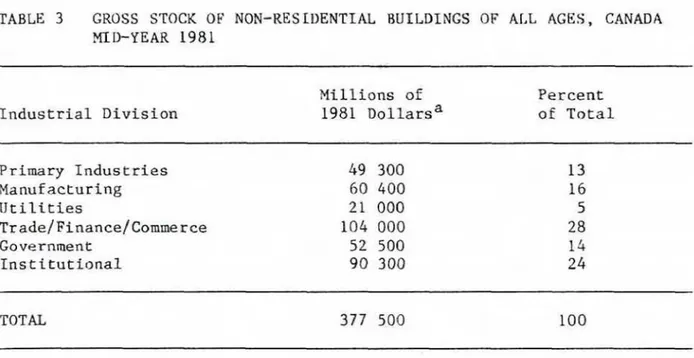
From the above catalogue, the holdings of non-residential buildings
w i t h i n each i n d u s t r i a l d i v i s i o n (as defined by the Canadian Standard Industrial Classification) have been calculated and are sham in Table 3.
The expenditure by each industry for the constkuction of new
b u i l d i n g s is provided in S t a t i s t i c s Canada Catalogue 64-201, "Construction in Canada"- The average share of the t o t a l expenditure for a number of recent years by each i n d u s t r i a l division was calculated and is shawn in Table 4 . A mmparison of Tables 3 and 4 shows that the share of
expenditure on new building construction by each f n d u s t r i a l division is
*
As shown abuve, about 26X of existing residential buildings in Canadawere constructed prior to 1930, Also, in the United S t a t e s , about 25% of existing noa-residential buildings were estimated to have been constructed before 1930 (~eating/Yi pinglAir Conditioning, S e p t . 1981, "The He trof i~
Market: What's Out There?"). Therefore an adjustment factor of 1 . 3 3
TABLE 3 GROSS STOCK OF NON-RESTUENTIAL BUILDINGS OF ALL AGES, CANADA MIIFYEAR 1981 Xndustrial Division Millions of 1981 IIollarsa Percent of Total Primary Industries Hanuf a c t u r i n g U t i l i t i e s Trade/Finance/Commerce Government Institutional TOTAL
'sum of current (1981) gross stock values shown in S t a t i s t i c s Canada
Catalogue 13-211, "Fixed C a p i t a l Flows and Stocks, - 1981" for the 50-year
inventory of b u i l d i n g s held by t h e industries within each industrial d i v i s i o n , multiplied by 1 . 3 3 to include older s t o c k .
approximately the same as the share of the value of existing building s t o c k that it h o l d s .
Assuming t h a t t h i s correlation between expenditure and value of stock a p p l i e s not only to the industrial divisions but a l s o t o the major types of buildings constructed by i n d u s t r y , the $380 billion value of non-
residential buildings could be d i v i d e d among b u i l d i n g types and i n d u s t r i a l divisions according K O t h e percentages given in T a b l e 4 . On this b a s i s ,
the total estimated value in 1981 d o l l a r s f o r each major building type has been calculated and is shown in Table 5. From additional information about construction c o s t s per u n i t area f o r each t y p e of building, the total area of each building type can be calculated. From information about the average size of each type of recently constructed b u i l d i n g , and
assuming that previously constructed buildings of similar t y p e were of
similar s i z e , the number of each major t y p e of building can be c a l c u l a t e d . These results are shown in T a b l e 5. Recause the validity of assumptions
is unknown, no estimate can be gfven of the accuracy of these results.
Location
Assuming agatn that there is a correlation between the value of the
e x i s t i n g stock of non-residential buildings and current e x p e n d i t u r e f o r
their construction, the value of s t o c k that is l o c a t e d I n each p r o v i n c e
w i l l be proportional t o the r e l a t i v e annual expenditure f o r building construction within each province. From 3 t a t t s t l c s Canada Catalogue 6 4 -
201, "Construction in Canada" (Tables 18-27), t h e annual expenditure by
BLE 5 DATA ON NON-RESIDENTIAL BUILDINGS I N CANADA, 1981
Estimated
1981 Average Average sizee
~ r o s s
Value New Construction Grass Araa of Recent New Estimated(millions of 1981$) costa ( $ / & ) ( m i l l i o n m2) Buildings (m2)
No,
of Buildingsc t o r i e e & Other Industrial Building? rehouees tels f i c e s ores creation her Commercial hools s p i r a l s her Inetitutional
ther" Non-residential ButLdings
t a l
rom 1979 prices (Canadata) factored up by 1.193, the ratio of t h e estimated mid-1981 implicit p r i c e i n d e x t o the 1979 m p l i c i t price fndex, from Table 16 of S t a t i s t i c s Canada Catalogue 62-007, "Construction Price S t a t i s t i c s " .
verage value f o r a l l cammrcial b u i l d i n g s , verage value for a l l institutional b u i l d i n g s , verege value for a l l non-residential buildings.
and the relative annual activity in each province can be determined. The
annual e x p e n d i t u r e s were factored by t h e implicit price index for non-
residential building construction as given tn S t a t i s t i c s Canada Catalogue
62-007, "Constructton P r i c e S t a t i s t i c s " (Table 16), t o obtain the annual expenditure tn constant 1971 d o l l a r s .
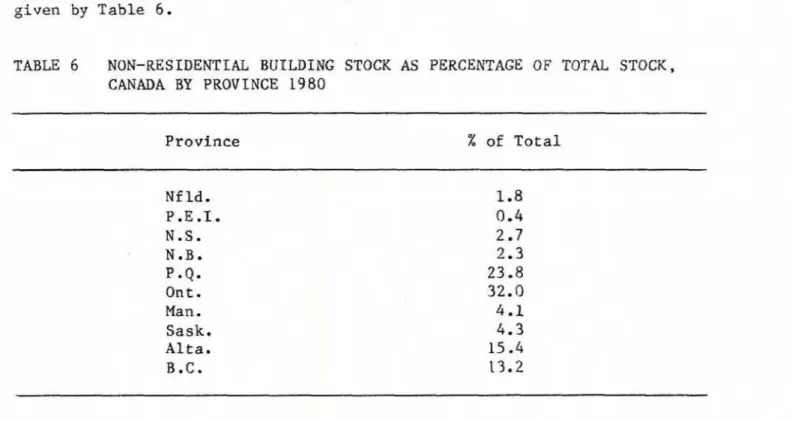
The
total expenditure in constant1971 d o l l a r s in each province during the 1972-81 period as a percentage n€
total expenditure durLng that ti- for new non-residential building
construction in Canada is s h m in Table 6 and is assumed t o represent the r e l a t i v e amount of b u i l d i n g stock in existence in each province. If the distribution of major buildtng types is assumed to be f a i r l y uniform among
a l l provinces, the total area or t h e t o t a l number of buildings of each
type in any province, as a percentage of the Canadian total, will also be
given by T a b l e 6 .
TABLE 6 NOH-rn-SIDEKCIAL BUIWIING STOCK AS PERCENTAGE -OF TOTAL STOCK,
CANADA BY PROVINCE 1980 Province % of Total Nf ld. P.E .I. N.S. H . 3 . P o Q , Ont. Han
.
Sask, Alta.B.C.
It is expected that far the primary industries, the majority of the
"industrial" buildings (factories, mine buildings and mine m i 11 b u i l d i n g s )
and the najority of "othern butldlngs (mainly farm h l l d t n g s ) are located in rural or thinly populated regions. In the u t i l i r y sector, it is
assumed that many buildings within the "other" classification (buildings
of the commnications, transportation or energy distribution industcics) are also located i n rural areas. Such b u i l d i n g s in rural areas account
for about 13% of the gross value of existing non-residential b u t l d i n g s t o c k . Therefore it is expected rhat: about 85X of non-residential building stack is located in urbanareas. Given that 542 of the
residential b u i l d i n g s t o c k is located in centres of more Chan 100 000
population and assuming that people live near their workplace, it i s
expected that about 50-55% of non-residential buildings w i l l a l s o be
located in or near urban centres of more than 100 000 populatioa, w i t h t h e ather 30-35% located in urban centres of less than 100 000 population.
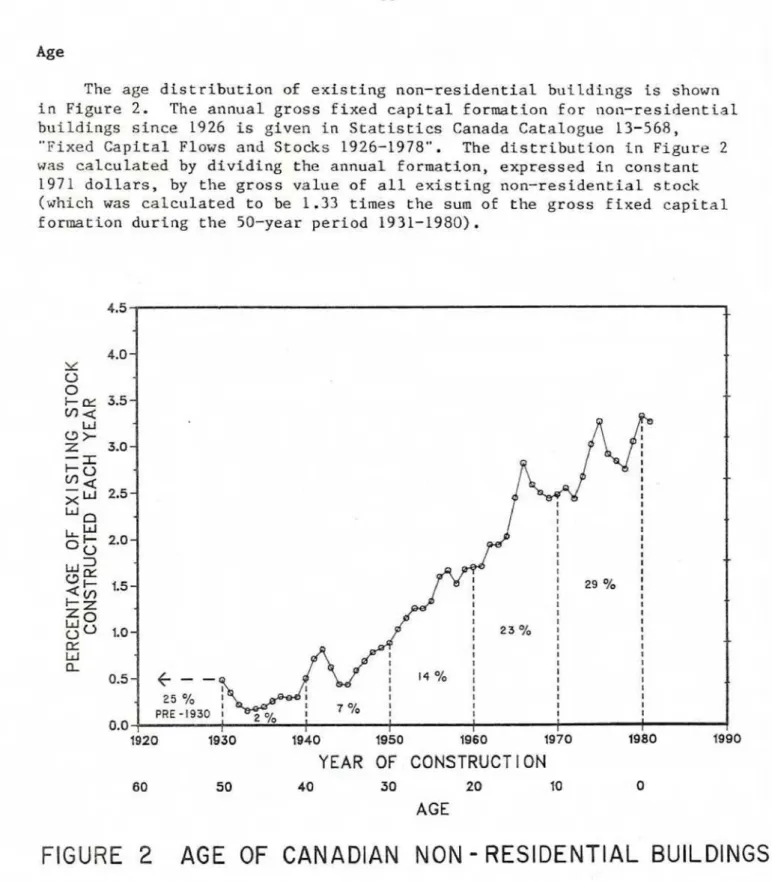
The age distributian of existing non-residential buildings i s shown
in Figure 2. The annual gross f i x e d capital formation for nan-residential buildings since 1926 is given in Statistics Canada Catalogue 13-568,
"Fixed C a p i t a l F l o w s and Stocks 1926-1978". The distribution In Figure 2
w a s calculated by d i v i d i n g the annual formatLon, expressed in constant
1971 d o l l a r s , by the gross value of a l l existing non-residential stock
(which w a s calculated t o be 1,33 times the sum of the gross f-Lxed capital
formaLion during the 5Oyear period 1931-1980).
YEAR
OF CONSTRUCT l ON40 30 20 10
AGE
FIGURE
2
AGE
OF CANADIAN
N O N
-
RESIDENTIAL BUILDINGS
Some adjustment should be made t o account for annual building losses
through demolition, fire or other causes, but unfortunately no estimate
can be made of the s i z e of such losses or of the ages of b u i l d h g s
Accuracy
The magnitude oE error in the calculated inventory of nsn-residential b u i l d i n g s cannot be estimated.
Gross stock values are based on a 50-year perpetual inventory of
b u i l d i n g s that has been e s t a b l i s h e d f o r s t a t i s t i c a l purposes. That
statistical inventory may not bear any resemblance t o t h e actual tnventory of exi s t i n g bu i1,dings.
For this estimate, it has been assumed that a correlation between t h e
value of e x i s t i n g stock and recent expenditures is v a l i d for a11 i n d u s t r i e s . H m v e r , in Tables 3 and 4, relarive expenditures do not match relative values of gross s t o c k for the trade/finance/commerce sector or for the Znstitutional sector. Therefore t h i s report probably
overestimates the number of buildings h e l d by tradeif inancejcomme rce and underestimates the number of i n s t i t u t i o n a l b u i l d i n g s .
The distribution of the building stock by building t y p e and by region
was based on expenditures within the past decade. Factors such as
population growth, population relocation and business cycles may be of
varying cycle l e n g t h and m y not a£ f e c t each industry and each region
simultaneously or in a uniform at consistent way. T h e action of those and other factors during o t h e r decades may have had a very d i f f e r e n t effect on the capital formarion for building construction, No comparison of recent
and past expenditure by region or by i n d u s t r i a l division was made to
cdnfirm the validity of applyrng canclusions based on expenditure for
b u i l d i n g cmstwction during the p a s t decade to the rota1 inventory of buildings.
Explanations of the limitations and accuracy of Statis tics Canada d a t a are contained in the agency's referenced catalogues and in Catalogue 13-522, "Fixed Capital Flows and Stocks, Manufacturing, Canada, 1926- 1960: & thodolagy
."
This note shows one simple way to estimate the inventory of e x i s t i n g
Canadian b u i l d i n g s t o c k . Although based on numerous assumptions, t h e results permit some general observations t o be made.
Apartment buildings represent only 2.6% of r h e estimated number of
residential b u i l d i n g s , y e t they contain 29% of the total number of
d w e l l i n g units and presumably house 20-30% of the population. The
concentration of n o n - r e s i d e n t i a l b u i l d i n g s is in factories, o f f i c e
b u i l d i n g s , stores and schools which together account for nearly 50Z of
recent expenditures on non-residential building construction. Research devoted to apartment buildf ngs
,
f actorf es, s t o r e s , off ices and s c h o o l s would be fomssing on the major segrnenrs of Canadian building stock.The 1980 replacensent cost of e x i s t i n g buildings in Canada is $700
bi ll t o n . Any analysis of the l o n r t e m performnce of existing buildtngs
that could l e a d t o even small improvements i n design, materials,
construct i o n techniques or maintenance would produce long-las t ing berlef i t s
to the owners of these a s s e t s .
This calculated inventory cannot provide the type of information needed for research purposes t o assess the loncterm durabiltty and
performance of bulldings because building age cannot be calculated with
accuracy and because the loss rates and the ages a£ lost buildings are not
known. Neither does t h i s inventory provide the type af d e t a i l e d
in£ armation desirable for anany commercial purposes. A p e r i o d i c census of
all existing buildings or use of information already contained in t a x assessment records would permit an accurate inventory of existing buildings to be made.