arXiv:1506.00938v1 [astro-ph.HE] 2 Jun 2015
Time series of high resolution spectra of SN 2014J
observed with the TIGRE telescope
D. Jack,
1⋆M. Mittag,
2K.-P. Schr¨
oder,
1,2J. H. M. M. Schmitt,
2A. Hempelmann,
2J. N. Gonz´
alez-P´erez,
2M. A. Trinidad,
1G. Rauw
3and J. M. Cabrera Sixto
41Departamento de Astronom´ıa, Universidad de Guanajuato, A.P. 144, 36000 Guanajuato, GTO, Mexico 2Hamburger Sternwarte, University of Hamburg, Gojenbergsweg 112, 21029 Hamburg, Germany
3Groupe d’Astrophysique des Hautes Energies, Institut d’Astrophysique et de G´eophysique, Universit´e de Li`ege, All´ee du 6 Aoˆut,
Bˆat B5c, 4000 Li`ege, Belgium
4Universidad de Guanajuato, Lascur´ain de Retana No 5, C.P. 36000 Guanajuato, GTO, Mexico
Accepted xxx Received xx; in original form xxx
ABSTRACT
We present a time series of high resolution spectra of the Type Ia supernova 2014J, which exploded in the nearby galaxy M82. The spectra were obtained with the HEROS ´echelle spectrograph installed at the 1.2 m TIGRE telescope. We present a series of 33 spectra with a resolution of R ≈ 20, 000, which covers the important bright phases in the evolution of SN 2014J during the period from January 24 to April 1 of 2014. The spectral evolution of SN 2014J is derived empirically. The expansion velocities of the Si II P-Cygni features were measured and show the expected decreasing behaviour, beginning with a high velocity of 14,000 km/s on January 24. The Ca II infrared triplet feature shows a high velocity component with expansion velocities of > 20, 000 km/s during the early evolution apart from the normal component showing similar velocities as Si II. Further broad P-Cygni profiles are exhibited by the principal lines of Ca II, Mg II and Fe II. The TIGRE SN 2014J spectra also resolve several very sharp Na I D doublet absorption components. Our analysis suggests interesting substructures in the interstellar medium of the host galaxy M82, as well as in our Milky Way, confirming other work on this SN. We were able to identify the interstellar absorption of M82 in the lines of Ca II H & K at 3933 and 3968 ˚A as well as K I at 7664 and 7698 ˚A. Furthermore, we confirm several Diffuse Interstellar Bands, at wavelengths of 6196, 6283, 6376, 6379 and 6613 ˚A and give their measured equivalent widths.
Key words: supernovae: individual: SN 2014J – galaxies: individual: M82 – galaxies: ISM – ISM: lines and bands.
1 INTRODUCTION
Supernovae of Type Ia (SN Ia) are of special inter-est for cosmology since the discovery that the expansion of the universe is actually accelerated (Riess et al. 1998; Perlmutter et al. 1999). But despite being widely used as a calibratable “standard candle” (Phillips 1993; Riess et al. 1996; Phillips et al. 1999; Goldhaber et al. 2001) this type of supernovae remains poorly understood. See Parrent et al. (2014) for a recent review on SNe Ia and their properties. The physical nature of a Type Ia supernova progenitor is still under discussion (Levanon et al. 2015) as well as the ex-plosion mechanism. Several different exex-plosion models have been suggested and calculated (Nomoto 1984; Khokhlov 1991; Plewa et al. 2004; Jordan et al. 2008; Pakmor et al.
⋆ E-mail: [email protected]
2012, 2013; Rosswog et al. 2009; Kushnir et al. 2013). A well-resolved time series of spectra of SNe Ia may shed some light on the physical properties of the expanding envelope and, therefore, might reveal some vital clues about the na-ture of SN Ia explosions.
So far, however, no such detailed time series of SNe Ia spectra exist. The most detailed time series obtained of SN 2011fe has only a relatively low spectral resolution and some gaps in the coverage (Pereira, R. et al., 2013). The nearby and, therefore, quite bright supernova 2014J provided an excellent opportunity for observing a SN Ia very closely and obtaining quite high resolution spectra.
SN 2014J was discovered in the starburst galaxy M82 (Fossey et al. 2014) during the night of January 21, in an early stage of its outbrake. Only two weeks later, around February 4, the maximum V -magnitude was reached with V = 10.5. By mid-march, SN 2014J had faded below 12.0
mag, but it was still well placed in the sky for good-quality observations. It has been observed by many telescopes and in different wavelength regions (Telesco, C. M. et al., 2015; Foley, R. J. et al., 2014; Ashall et al. 2014; Margutti et al. 2014; P´erez-Torres, M. A. et al., 2014), however, none of them have obtained observations with a very detailed time series of optical spectra with higher resolution.
As an additional bonus of this bright supernova, we can use it simply as a point light source to probe the interstellar and perhaps intergalactic medium in the line of sight, mostly belonging to the supernova host galaxy and the Milky Way. Therefore, high resolution spectra of supernova explosions in other galaxies reveal also information about substructures in the interstellar medium (ISM) in our galaxy and in the respective host galaxy. The lines of interest are those of suit-able ion species of metals showing resonance lines (e.g. Na I, Ca II, Mg II), which represent transitions from the ground level, e.g. with a lower level of zero excitation energy. In the optical, the sodium D line is most suitable to probe inter-stellar matter and its dynamics. First high-resolution spec-tra of this kind were obtained and interpreted on the ex-traordinary opportunity presented by the bright SN 1987A (de Boer et al. 1987). Nearly 30 years of advances in de-tector technology allow such studies to be undertaken with much less bright supernovae and more modest equipment.
Other still unidentified features of interstellar ab-sorption, which can be observed in SN spectra, are the Diffuse Interstellar Bands (DIB). In our Galaxy, such DIBs are quite commonly observed in high-resolution spectra of massive stars (Herbig 1995). There exist also measurements for the Small and Large Magellanic Clouds (Vladilo et al. 1987; Ehrenfreund, P. et al., 2002; Cox et al. 2006; Cox, N. L. J. et al., 2007; Welty et al. 2006). Some spectral observations of extragalactic SNe have already succeeded in detecting DIBs (D’Odorico et al. 1989; Sollerman et al. 2005; Cox & Patat 2008, 2014). For a fur-ther recent study of DIBs a galactic nucleus has been used as the background light source (Ritchey & Wallerstein 2015). Hence, the nearby SN 2014J presents a further opportunity to study DIBs in high spectral resolution and to expand on the work by Welty et al. (2014).
There already exist some work on ISM observations in SN 2014J spectra. A detailed analysis of the interstellar medium of M82 is presented in Ritchey et al. (2015). They use six spectra and determine some abundances. Welty et al. (2014) did a thorough analysis of DIBs using the same set of spectra. Graham, M. L. et al., (2015) present a series of very high resolution spectra (R ≈ 110, 000) of SN 2014J. They reveal many substructures in the Na I D line. Further-more, they identify other interstellar absorption lines and DIBs.
In the following section 2, we first introduce the instru-mentation used, the 1.2 m TIGRE telescope and its HEROS spectrograph, then present our observations: a detailed time series of 33 high resolution spectra of the Type Ia supernova 2014J in M82, covering the period from January 24 to April 1. We continue with an empirical study of the evolution of the prominent Si II line and other spectral features. In a further section 3, we take advantage of the high resolu-tion of the TIGRE/HEROS spectra and study the multi-component interstellar absorption in the Na I D absorption lines and elsewhere in the SN 2014J spectra.
2 SPECTROSCOPIC MONITORING OF
SN 2014J
2.1 Instrumentation: el TIGRE
The TIGRE telescope is a fully automated telescope with an aperture of 1.2 m, situated near the city of Guanajuato in Central Mexico. It is equipped with the HEROS ´echelle spectrograph, which has a resolution of R ≈ 20, 000. Spectra are recorded simultaneously in two channels, blue and red, covering the large wavelength range from 3800 to 8800 ˚A with just a small gap of 130 ˚A around 5800 ˚A. Like opera-tions, the data reduction pipeline is also fully automatic.
Originally designed to monitor point-like objects down to about 10th magnitude with high-quality spectra, SN 2014J presented a challenge as much as an opportunity for this relatively small telescope. For a more detailed technical description of the TIGRE instrumentation and its capabili-ties, see Schmitt, J. H. M. M. et al., (2014).
2.2 Time series of SN 2014J spectra
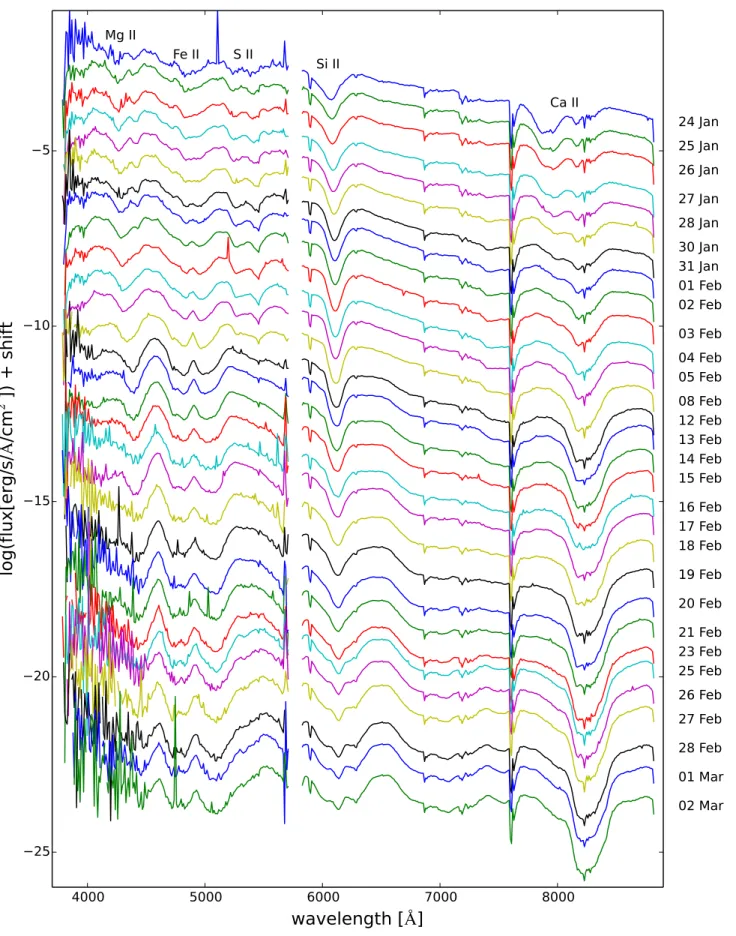
Our monitoring of the supernova 2014J started very shortly after its discovery on January 21. We obtained high-resolution spectra with a good signal to noise (S/N) of around 60 in the red channel in almost every night un-til March 2. Due to some tecnical problems with the tele-scope we were only able to take two late time spectra on March 31 and April 1. In the blue channel the S/N has lower values of around 20, because SN 2014J suffered from a significant interstellar absorption and reddening. There-fore, all spectra presented in Fig. 1 have been dereddened with the values E(B − V ) = 1.33 and RV = 1.3 found by
Amanullah R. et al., (2014) in their study of the extinction law of SN 2014J. Furthermore, since the full resolution is not necessary for a study of the broad spectral features of supernova ejecta, we binned our spectra to a resolution of ∆λ = 10 ˚A for this purpose. Hence, the S/N was further im-proved and the spectra smoothed, also reducing the visibility of some telluric lines inherent to ground based observations. Figure 1 shows the complete set of SN 2014J spectra observed with the TIGRE telescope. We combined the ob-servations of the blue and the red channel to present the full spectra in the whole wavelength range from 3800 to 8800 ˚A except for the small gap of the spectrograph around 5800 ˚A. The dates at the right hand side mark the observation date in 2014 in Universal Time (UT). Because of the strong inter-stellar reddening of SN 2014J, the later spectra in the blue channel have a poor S/N and one cannot clearly distinguish features any more.
The very first spectrum was observed on January 24 UT and, therefore, still about 10 days before maximum light. This spectrum already shows the prominent P-Cygni profile of the Si II feature at around 6300 ˚A, which usually identifies a SN as a Type Ia. A high expansion velocity feature of the Ca II triplet is also present in the early spectra of SN 2014J at a wavelength of around 8000 ˚A. We were able to observe a spectrum almost every night until March 2 UT. In this time, 31 spectra were obtained. Then, due to a simple technical problem with the telescope mount, which caused some out-time for repair work, we could only obtain two more late-time spectra of SN 2014J, on March 31 and April 1 UT.
4000
5000
6000
7000
8000
wavelength [
Å
]
−25
−20
−15
−10
−5
log
(flu
x[e
rg/
s/
Å
/cm
2])
+
sh
ift
24 Jan
25 Jan
26 Jan
27 Jan
28 Jan
30 Jan
31 Jan
01 Feb
02 Feb
03 Feb
04 Feb
05 Feb
08 Feb
12 Feb
13 Feb
14 Feb
15 Feb
16 Feb
17 Feb
18 Feb
19 Feb
20 Feb
21 Feb
23 Feb
25 Feb
26 Feb
27 Feb
28 Feb
01 Mar
02 Mar
Si II
Ca II
S II
Fe II
Mg II
Figure 1.Spectral time series of SN 2014J observations obtained with the TIGRE telescope in both the red and blue channel of the HEROS spectrograph. The dates are given for the observations in early 2014.
3500 4000 4500 5000 5500 6000 wavelength [Å] 0.000 0.001 0.002 0.003 0.004 0.005 (sh ift ed ) re la ti ve fl ux 25/01 04/02 18/02 01/03 S II Fe II Mg II Ca II
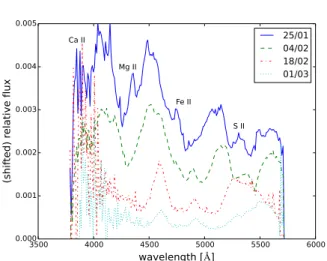
Figure 2.Evolution of selected SN 2014J spectra obtained in the blue channel of the HEROS spectrograph.
A SN Ia spectrum at early times is supposed to be quite flat and should not show many clear features. This is clearly consistent with the appearance of our early-time spectra of SN 2014J. For clarity, the latest spectrum shown in Fig. 1 is the one observed on March 2, which corresponds to about 1 month after maximum light. The small ”lines” in some parts of the spectra stem from a few, more noticeable telluric lines. The here presented time series reveals the changing shape, on an almost daily schedule with some features. The general trend, the P-Cygni extrema moving towards the red-der part of the spectrum, is consistently observed in the Si II line and some other features. This means that the observed expansion velocities change during the evolution. The reason for that is the expansion of the envelope, which decreases the mass densities and, therefore, decreases all opacities. Hence, with ongoing expansion, ever deeper and slower layers of the expanding envelope become visible in the spectra. In other words, the quasi-photosphere moves inwards into less fast expanding shell material.
Another strong feature in SN Ia spectra is caused by the Ca II IR triplet at around 8500 ˚A which already appears during the early phases at around maximum light. It can be observed throughout the whole evolution until the latest spectrum shown in Fig. 1. At early times it shows a high velocity component.
At later phases an Fe II emission feature appears about where the prominent Si II line was observed earlier. Another Fe II feature then appears at around 5000 ˚A. Indeed, it is true of evolved type Ia SNe to show more spectral features in general. Eventually, these go into emission, as the late, opti-cally thin phase of the expanding envelope has been reached. At the same time, one sees the inner layers, which are rich of iron peak elements, causing the above-mentioned rise of Fe II features. In the following section, we present a more detailed picture of the evolution of selected spectral features. 2.3 Detailed spectral evolution of important
features
In Fig. 2, we compare a selection of only four spectra from the blue channel of the HEROS spectrograph, representative
of four different epochs in the evolution of SN 2014J. Due to the strong interstellar reddening of the light of SN 2014J, the later spectra have only poor S/N.
The first spectrum from above in Fig. 2 was obtained on January 25. It shows the typical features of a SN Ia spec-trum during maximum light. We can see the typical S II line profile in form of a W between wavelengths of, roughly, 5000 and 5500 ˚A. At shorter wavelengths a clear Fe II fea-ture can be seen at around 4500 to 5000 ˚A. Furthermore, around wavelengths of about 4000 to 4500 ˚A a clear fea-ture of Mg II is present in the spectrum of SN 2014J. Below 4000 ˚A one can see the drop in flux towards the Ca II H & K feature, although it is not fully covered in the shown spectrum and the S/N is already quite low in that part of the spectrum. We should stress that spectra of SNe Ia are a blend of millions of lines, so that one cannot always assign one specific element to each observed feature.
The spectrum of February 4, which corresponds to max-imum light, shows similar spectral features, when compared to the spectrum of January 25. However, the line profiles have already changed a bit. Additionally, this spectrum shows consistently lower expansion velocities, in all of its features. The further two spectra shown in Fig. 2, of Febru-ary 18 and the one of March 1, suffer already from poorer S/N. Nevertheless, these spectra show the expected emission features of Fe II.
2.3.1 Evolution of the Si II line profile
The broad Si II P-Cygni line profile is shaped by the ejecta of the supernova, its dynamics and its opacity evolution, in a most representative way, since this is the strongest feature observed in the SN Ia spectra at 6355 ˚A during maximum light.
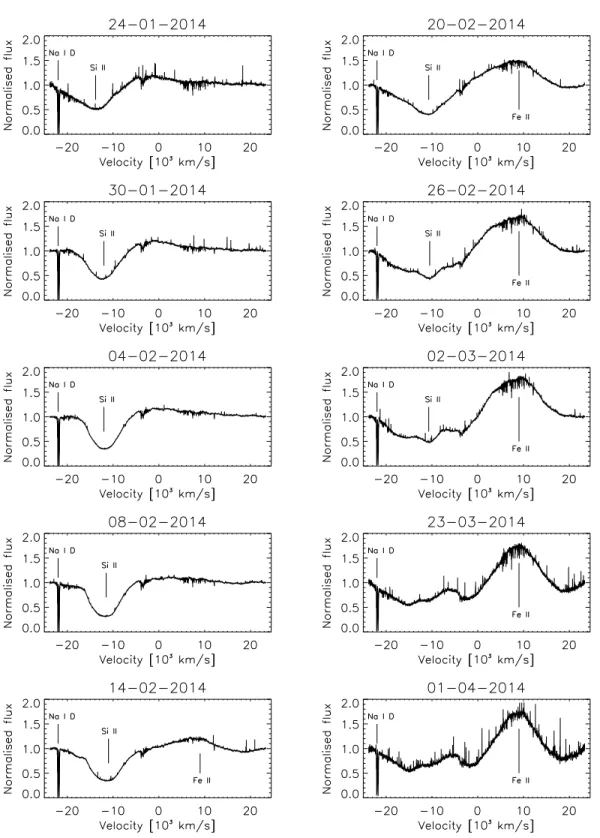
A time series of the wavelength range of this Si II fea-ture is shown in Fig. 3. A set of 10 spectra was selected, which best represent the evolution and its chronology here. All these spectra are shown in their full spectral resolution. They are normalized in flux, and their wavelength scales were transformed onto a barycentric velocity scale (with re-spect to 6355 ˚A).
In the first spectra, the Si II feature exhibits a typical P-Cygni profile, which is expected for a rapidly expanding, op-tically still thick envelope. Hence, the emission is still much less prominent than the absorption part of the profile. Fur-thermore, it is clearly seen from the individual line profiles, how fundamentally the absorption part changes. At the be-ginning, this is just one consistent broad absorption, as of a typical P Cygni profile. Its minimum is located at an expan-sion velocity of around ≈ −14, 000 km/s. This characteristic expansion velocity then shifts slightly to ≈ −11, 000 km/s until the day of February 20. By February 26, however, the Si II absorption has changed its nature significantly, because a small emission feature appears inside of the Si II P-Cygni absorption feature. By April 1, the Si II feature has come close to disappearance.
During the later phase an Fe II emission feature arises in the wavelength range of the Si II feature. During the on-going expansion the envelope becomes thinner and allows that deeper parts of it shape the spectra. In this way, the iron peak elements from the inner envelope of the expand-ing SN Ia envelope become visible. By the day of February
Figure 3.The Si II line of 10 observations are shown. These 10 spectra are shown the chronology evolution of the time series Si II line at 6355 ˚A.
26 a small emission feature at around ≈ −7000 km/s has appeared in the absorption trough of the P-Cygni profile of the Si II feature. The emission feature to the right at ≈+9000 km/s is an Fe II feature, which becomes stronger until April 1. By that time the envelope has become optically thin.
2.4 Expansion velocities of Si II and Ca II
Since we obtained a well resolved time series of SN 2014J spectra, we were able to study the expanding envelope in some detail. For that, we measured the evolution of the ex-pansion velocities of the Si II feature at around 6300 ˚A and the Ca II IR triplet feature at around 8500 ˚A.
Figure 4.Measured expansion velocities of the Si II feature at 6000 ˚A.
Figure 5.Measured expansion velocities of the Ca II feature at 8500 ˚A. During the early phase it shows a high velocity compo-nent.
Figure 4 shows the change in the expansion velocity of the prominent Si II feature. Starting from a high expansion velocity of 14,000 km/s on January 24, the expansion ve-locites decrease while the envelope is expanding. Hence, the deeper parts are revealed in the spectra, which have slower expansion velocities. When the Si II is about to disappear, the expansion velocity is about 12,000 km/s. The photo-sphere has then passed the layers with abundant silicon.
In Fig. 5, we show the measured expansion veloci-ties of the Ca II feature at around 8500 ˚A. Thanks to our early observations, we could study the evolution of a high velocity component of the Ca II feature. Its ex-pansion velocity decreases from 24,000 km/s in our first spectrum down to about 20,000 km/s in the spectrum 6 days later. In their study of near infrared spectra of SN 2014J, Marion, G. H. et al., (2015) found a similar be-haviour for the Ca II IR triplet expansion velocities. They measured values for the high expansion velocity feature be-tween 26,000 km/s and 20,000 km/s. Like in our study, they did not detect a clear high velocity component of the Si II feature. All these observations are consistent with the study
Figure 6.Full resolution capture of the complex IS absorption in the sodium D-line doublet, from the superposition of the 32 best spectra.
of high velocity components in other type Ia supernova per-formed by Silverman et al. (2015). Observing a high velocity component of Ca II is much more common than one of Si II. The main component of the Ca II feature starts with an expansion velocity of roughly 14,500 km/s and decreases to a value of 12,000 km. As expected in SNe Ia, the observed expansion velocities of the Ca II feature are similar to those measured for the Si II feature.
3 THE INTERSTELLAR ABSORPTION
COMPONENTS OF THE SODIUM D-LINES As can be seen in Fig. 6, the D-line doublet of Na I at 5889.95 ˚A and 5895.92 ˚A shows a complex, multi-component absorption line structure due to distinctly different contri-butions. The telluric absorption lines were not removed in the presented spectra. We here study and discuss this very valuable information and offer an interpretation in terms of different origins. Within the noise of individual spectra, the D-line absorption features appeared invariable over the two months or so we succeeded with the spectroscopic monitor-ing. To minimize noise, we superimposed the 32 best SN spectra in the vicinity of the Na D doublet (see Fig. 6), af-ter a barycentric correction was applied to the laboratory wavelength scale of each spectrum.
There are essentially four absorption components or groups of even narrower absorption features, as have also been seen by other groups in even higher spectral resolu-tion (see Graham, M. L. et al., (2015); Welty et al. (2014); Ritchey et al. (2015)): (a) is a small absorption (the right-most feature in Fig. 6) at a radial velocity shift of +245 km/s (barycentric), which is clearly seen in the longer-wavelength Na I D-line but is blended (see below) in the left one. (b) is a very broad and saturated absorption trough, promi-nent in both D-lines. Its distinct, asymmetric profile in both D-lines suggests an interesting velocity and density struc-ture, which reaches from a sharp edge at +50 km/s to be-yond +200 km/s, close to component (a). Component (c) is a sharp, medium-strong component well visible in both
D-lines at −5 km/s, while (d) is a 4 times weaker (by equivalent width) component, equally sharp and distinct, at −60 km/s. It is well visible only for the shorter-wavelength D-line, while its longer-wavelength counterpart (d’) falls into component (a) of the shorter-wavelength D-line.
The uncertainties of the equivalent widths, as measured in the integrated spectrum are about 0.015 ˚A for the weak lines (components a, c and d, see below) and 0.05 to 0.1 ˚
A for the broad component b. Individual spectra yielded uncertainties about 6 times as large. Consequently, the weak components were well resolved but much affected by noise. Any hidden temporal changes, if any, would have had to be smaller than about 25% of the absorption of the weak components.
3.1 Components (c) and (d): distinct ISM clouds For component (c) the obvious absorber candidate is galactic ISM. The line of sight to SN 2014J probes high galactic lat-itudes away from the galactic centre, in galactic coordinates towards l = 141.4◦and b = 40.6◦. Around this galactic
lon-gitude, Mohan et al. (2004) observed radial velocities of cold ISM clouds between −12 and +10 km/s (see their Fig. 2), with respect to the local standard of rest (LSR). A small correction of +6 km/s applies to translate these veliocities into the heliocentric system quoted above. Still, component (c) fits well in here.
Despite its modest appearance, component (c) suffers from some degree of saturation, because the two versions of it do not show equivalent widths in a ratio of 1:2 (as of the respective f-values) but differ by only a factor of 1.25 (0.20 and 0.16 ˚A, ±0.01 ˚A, approximately). Furthermore, their line widths are very close to the instrumental profile, which suggests a very small broadening velocity much under 10 km/s. Therefore, saturation can set in already with small equivalent widths.
The analysis of pure absorption lines was formerly ap-plied by us to special problems in the field of stellar at-mospheres. See Schroeder et al. (1994) and references given there for a brief summary of the simple theory. Given well-known transition probabilities (for the Na I D-line doublet we use the f and g values given by Wiese et al. (1969)), the equivalent width of a weak, unsaturated line is a linear function of only the column number density N of the ab-sorber. However, once saturation sets in, at least two lines of the same multiplet and with much different transition probability f are required to solve for both, N and the line-broadening velocity. We here use the same simple computer code as Schroeder et al. (1994), to calculate the profiles of pure absorption lines and their equivalent widths for any such parameter pair.
In the case of the two Na I D (c) components, we find a best-matching solution for NNa= 3.3(±0.7) × 1012cm−2
and vdisp = 3.5(±0.2) km/s. This small velocity dispersion
matches the lower end of what Wilson, C. D. et al., (2011) (see their Table 1) find for whole galaxy disks, and presum-ably we indeed see just a single cloud in our own Milky Way. We should note, however, that a possibly smaller ve-locity dispersion naturally allows for a larger column density due to saturation effects. In fact, Ritchey et al. (2015) find 9.5×1012cm−2at 2.0 km/s for this component. The sodium
column density only gives us a lower limit for neutral
hydro-gen of NHI= 2.1(±0.5) × 1018cm−2, when using a relative
sodium abundance of 10−5.8, since IS sodium is much more
prone to ionization (much lower ionization potential) than hydrogen. The true value may be almost two orders of mag-nitude higher (see Ritchey et al. (2015)).
Apparently, the distinct, small and sharp component (d) is of a similar nature (single cloud) as component (c). Even with the same small broadening velocity, it would not suffer much from saturation, as the equivalent width is only 0.05 ˚A. Accordingly, for its column density we obtain NNa≈
3 × 1011cm−2. At −60 km/s barycentric radial velocity, it
may appear not very likely to be of a galactic origin, but the Leiden/Argentine/Bonn (LAB) H 21cm Survey does show galactic IS hydrogen here (see Ritchey et al. (2015)).
3.2 The signatures of cool ISM in the M82 disk Now, can the remaining D-line absorption components (a) and (b) be attributed to the M82-internal ISM? And is the observed D-line absorption consistent with the IS extinc-tion in the line of sight towards SN 2014J, which mainly arises in the disk of M82 (as the line of sight stays clear of most of the galactic IS absorption)? The maximum mag-nitude of SN 2014J of V = 10.5 mag suggests AV ≈ 1.9
mag (with M − m = 27.8 mag at 3.6 Mpc distance and MV,max = −19.2 mag for a typical SN type Ia). The large
reddening (see above) seems to suggest even a larger IS ab-sorption.
Using the relation given by G¨uver & ¨Ozel (2009), i.e. NH/(cm−2) = 2.2 × 10²¹AV/(mag), a neutral hydrogen
col-umn density of NH of about 4 × 1021 cm−2 should be
ex-pected. The respective sodium column density would be lim-ited to NNa < 6 × 1015 cm−2. Due to ionization, the true
value could be nearly two orders of magnitude lower. The (here clearly not given) case of an optically thin absorption translates the equivalent width of all D-line ab-sorption, nearly 4 ˚A, into a lower limit for NNa of only
≈2 × 1013cm−2. Hence, this is indeed fully consistent with
an IS absorption of about 2 mag (or more). Nevertheless, from a profile analysis of a much better spectral resolution, Ritchey et al. (2015) find only 1.8 × 1014cm−2.
M82 as a whole has a radial velocity of +203 km/s (Chynoweth et al. 2008). With respect to any Na D absorp-tion components, however, only ISM, which lies in front of SN 2014J, becomes visible. SN 2014J is located in the western disk-half, 58” away from the galaxy nucleus. Here, the ISM rotates towards us with (in the rest-frame of M82) vrad≈ −100 to −150 km/s (see Mayya & Carrasco (2009)).
For this reason, the D-line absorption should appear between (barycentric) radial velocities of +50 km/s to +100 km/s. Remarkably, the broad component (b) features a sharp blue edge at +50 km/s, but then reaches out with a red wing to component (a) at +245 km/s (barycentric). That material is clearly not participating in the general disk rotation but (in the rest-frame of M82) moves backwards, towards the SN 2014J.
An answer to such diverse dynamics may be given by the hot superbubble discovered by Nielsen et al. (2014). Its X-ray emission appears to coincide with the site of SN 2014J. The bubble has been inflated to about 200 pc in diameter by the action (hot winds and SNe) of some very massive stars formed there perhaps 50 Myrs ago. We suggest that
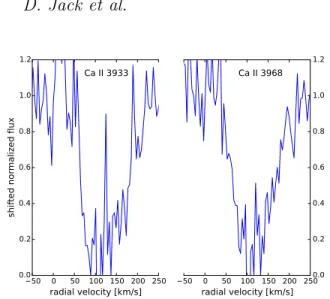
−50 0 50 100 150 200 250 radial velocity [km/s] 0.0 0.2 0.4 0.6 0.8 1.0 1.2 sh ifte d n orm ali ze d fl ux −50 0 50 100 150 200 250 radial velocity [km/s] 0.0 0.2 0.4 0.6 0.8 1.0 1.2 Ca II 3933 Ca II 3968
Figure 7.Detection of absorption by ISM for the Ca II 3933 and Ca II 3968 lines in the high resolution spectra of SN 2014J.
the fully saturated part of component (b) between +50 and about +140 km/s (barycentric) traces the swept-up, cold IS gas in front of that superbubble. In the rest-frame of M82, it moves with about −150 km/s to −60 km/s. Part of this gas is pushed towards us by the still expanding superbub-ble, in addition to be rotating towards us with the disk of M82. In particular, this would explain the sharp blue edge of component (b): this is the cool material closest to the bubble-shockfront approaching us.
The backward moving ISM found in the red wing of component (b) and in component (a) could be explained, if SN 2014J was not located inside the superbubble, but in-stead a bit behind it, placing the superbubble at +150 km/s (barycentric), that is, in co-ration with the disk, and have its shockfront still expanding at about 100 km/s. In this scenario, SN 2014J would also probe some ISM pushed out away from us, towards it and so moving against disk rotation. The small but distinct component (a) at about +40 km/s in the rest-frame of M82 would mark this cold ISM closest to the far-side bubble-shockfront. However, the highly complex substructure of the IS absorption resolved by Graham, M. L. et al., (2015) leaves, as intriguing as our proposal is, alternative explanations, e.g. by a number of individual structures in the long line of sight. And compo-nent (a) may also match the western H I streamer found by Yun et al. (1993), see Ritchey et al. (2015).
3.2.1 Other IS absorption signatures: K I, Ca II and DIBs
Interstellar absorption, mostly of component (b) belonging to the galaxy M82, is visible in several other lines as well, foremost in the Ca II doublet. Figure 7 shows two absorp-tion features corresponding to Ca II H and K at wavelengths of 3933.66 ˚A and 3968.5 ˚A. Since these lines are at the lower end of the blue channel, the spectra at that wavelength range have low S/N. Obviously, one cannot do a very de-tailed study. However, both absorption features are broad, ranging between +50 and +200 km/s, much like component (b) of the D-lines of the Na I doublet. We were also able to detected two ISM absorption feature of K I at 7698.96 ˚A and
−50 0 50 100 150 200 250 radial velocity [km/s] 0.4 0.5 0.6 0.7 0.8 0.9 1.0 1.1 sh ifte d n orm ali ze d fl ux −50 0 50 100 150 200 250 radial velocity [km/s] 0.4 0.5 0.6 0.7 0.8 0.9 1.0 1.1 K I 7664 K I 7698
Figure 8.Detection of absorption by ISM for the K I and K I 7698 lines in the high resolution spectra of SN 2014J. The three narrow lines at the left hand side are telluric lines.
0 50 100 150 200 250 radial velocity [km/s] 0.96 0.98 1.00 1.02 1.04 sh ifte d n orm ali ze d fl ux 0 50 100 150 200 250 radial velocity [km/s] 0.90 0.92 0.94 0.96 0.98 1.00 1.02 1.04 DIB 6196 DIB 6613
Figure 9.Two features of DIBs observed in the high resolution spectra of SN 2014J. The left hand side shows the feature at 6196 ˚A, and on the right hand side the DIB 6613 ˚A.
at 7664.9 ˚A as shown in Fig. 8. Note that telluric absorp-tion lines have not been removed from the observed spec-tra. These feature also show the broad absorption at around +100 km/s corresponding to the broad IS absorption fea-ture of the sodium D-line doublet. This broad feafea-ture is due to absorption of ISM in M82. We were also able to detected CH+ at a wavelength of 4232 ˚A.
The high resolution of our spectra allows us to check even for unidentified interstellar absorption features, the so-called Diffuse Interstellar Bands (DIB). So far, the responsi-ble elements or molecules have not been identified, which is a motivation for further high-quality observations of DIBs. We were able to detect a few of them in our best high reso-lution spectra of the supernova SN 2014J.
Since the DIB features are present in all our spectra, we again added them up to obtain just one final spectrum with further improved S/N, As shown in Fig. 9, we find two DIBs at wavelengths of 6196 ˚A and 6613 ˚A. The DIB wavelengths
−100−50 0 50 100150200250300 radial velocity [km/s] 0.85 0.90 0.95 1.00 1.05 sh ifte d n orm ali ze d fl ux −100 −50 0 50 100 150 200 radial velocity [km/s] 0.94 0.96 0.98 1.00 1.02 1.04 DIB 6283 DIB 6376 DIB 6379
Figure 10.Three more features of DIBs observed in the high resolution spectra of SN 2014J. We found DIB features at 6283 ˚A, as shown on the left hand side, and on the right hand side two features at 6376 and 6379 ˚A.
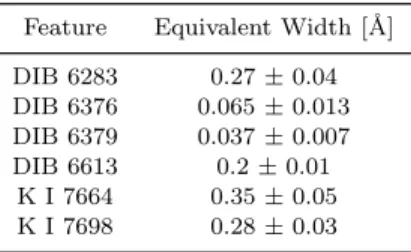
Table 1.Measured equivalent widths of the ISM and DIB fea-tures observed in the spectra of SN 2014J.
Feature Equivalent Width [˚A] DIB 6283 0.27 ± 0.04 DIB 6376 0.065 ± 0.013 DIB 6379 0.037 ± 0.007 DIB 6613 0.2 ± 0.01 K I 7664 0.35 ± 0.05 K I 7698 0.28 ± 0.03
have been taken from the study of Hobbs, L. M. et al., (2009). Again, the plot indicates velocities in the range of roughly +50 km/s to +200 km/s, as found in the broad (b) absorption feature of the Na D doublet.
In this combined spectrum of SN 2014J, we also found several other DIBs. Figure 10 shows the DIB of 6283 ˚A and the double feature of DIBs at 6376 ˚A and 6379 ˚A, in the same range of +50 km/s to +200 km/s. All these feature were also observed by Welty et al. (2014) and several other authors from high resolution spectra of SN 2014J. We were unable to detect the 5780 and 5797 ˚A DIBs since these fea-tures unfortunately lie exactly in the wavelength gap of the HEROS spectrograph.
In Table 1, we present the measured equivalent widths of the ISM and DIB features observed in our spectra of SN 2014J. The spectra in the wavelength range of the Ca II H & K absorption lines are too noisy to able to obtain reasonable equivalent widths. Our measured values for the equivalent widths of the DIBs are in the same range as found by Welty et al. (2014) and Graham, M. L. et al., (2015). However, for the DIB 6283 ˚A, the strongest of the observed DIBs in our spectra, Welty et al. (2014) found a much higher value for its equivalent width, while Graham, M. L. et al., (2015) found a value comparable to our. The reason might be the broad wings of this line as seen in the spectra of Welty et al. (2014). In our spectra, the telluric lines make it difficult to measure equivalent widths including the broad
wings (see Fig. 10). The IS absorption in both lines of K I are stronger than the DIBs.
4 CONCLUSIONS AND DISCUSSION
We presented a time series of 33 high resolution spectra of the Type Ia supernova 2014J in M82 observed with the TI-GRE telescope. We obtained these spectra with the HEROS ´echelle spectrograph, which covers the wavelength range from 3800 ˚A to 8800 ˚A, with only a small gap at around 5800 ˚A. The long monitoring period of about two months, well including maximum light of SN 2014J, in combination with the high quality of the spectra, enables us to empiri-cally describe the spectral evolution of this supernova Ia in detail. By its spectral features and their behaviour SN 2014J is very typical for a Type Ia SN.
During maximum light, red-channel SN 2014J spectra show broad P-Cygni profiles caused by the strongest lines of Si II and Ca II. In the blue channel we observed the typ-ical features of S II, Mg II, Fe II and Ca II. We studied the evolution of the prominent P-Cygni profile features of Si II at around 6300 ˚A in some detail. It shows a decrease in the expansion velocity in time as it is expected from rapidly expanding SN envelopes. The first spectrum from January 24 shows a minimum in the absorption trough at an expan-sion velocity of ≈ −14, 000 km/s. The expanexpan-sion velocity decreases, and on February 20 it has dropped to a value of ≈ −12, 000 km/s.
The Ca II infrared triplet feature at about 8500 ˚A shows a high expansion velocity component during the first days of observation with expansion velocities of 24,000 km/s mea-sured on January 24 decreasing to 20,000 km/s right be-fore this component disappears. The main expansion veloc-ity component shows a similar behaviour as the Si II feature. The expansion velocities decreases from an inicial value of 14,500 km/s down to 11,0000 km/s during the later phases of the expansion of the envelope.
Due to the significant amount of interstellar absorption and reddening of SN 2014J, the later blue-channel spectra suffer from a quite low S/N. In the well-exposed red channel, however, those later spectra document the transition from the optically thick to the thin phase of the expanding en-velope very well. Now, emission features are dominated by Fe II lines from deeper layers. At the same time, in the red channel, the Si II feature disappears, while a Fe II feature arises in the respective wavelength region.
The reason for the rise of these Fe II lines lies in the lay-ered structure of the SN debris, combined with a decreasing opacity: the quasi-photosphere moves inwards and passes from the outer layers of intermediate mass elements like sil-icon and sulfur to deeper layers with iron peak elements, stemming from the inner envelope of the exploded progen-itor White Dwarf. In this way our dense time series allows us to basically scan the abundance properties of the entire SN envelope, especially its abundances structure. Achieving this requires, of course, a huge amount of modeling work. Every spectrum of the series needs to be analyzed and/or modeled with a suitable (1D or even 3D, non-LTE, dynamic) atmosphere code. In a future work, using the PHOENIX code (Hauschildt 1992; Hauschildt & Baron 1999), we will do this work for the whole time-series of spectra, in oder to obtain
a detailed and quantitative abundance structure of the en-velope of SN 2014J as a case study for a SN of Type Ia. Since the different explosion models predict slightly different abundances and also a differently layered abundance struc-ture, this detailed abundance determination might exclude or favor one or some of the suggested explosion mechanism for a supernova of Type Ia. Some of the here presented spec-tra have already been used to identify the feature, which causes the secondary maximum in the I-band light curve of Type Ia supernovae (Jack et al. 2015).
Furthermore, the high resolution of R ≈ 20, 000 of the obtained spectra allows for a study of the sharp ISM ab-sorption features in the SN 2014J spectra. The Na I D dou-blet shows different substructures in the ISM of our galaxy, as well as of the host galaxy M82. There is a small fea-ture of ISM of M82 at a high velocity of about +245 km/s (barycentric). A very broad absorption feature at velocities of +50 km/s to +200 km/s is apparently caused by ISM in M82, perhaps even related to the expanding environment around a superbubble just in front of the SN. We also found two sharp absorption features at velocities of about −5 km/s and −60 km/s, both are of a galactic origin. We are also able to identify the same broad ISM absorption of M82 between +50 km/s and +200 km/s in the principal lines of Ca II H & K at 3934 and 3968 ˚A and K I at 7664 and 7699 ˚A.
Thanks to the high quality of the spectra, we also iden-tified a few DIBs in the spectra of SN 2014J, confirming other groups results. We found signatures of these features at wavelengths of 6196, 6283, 6376, 6379 and 6613 ˚A and measured the equivalent widths of these features. Hence, we can fully confirm the observations made by Welty et al. (2014) in their analysis of high resolution SN 2014J spectra. The radial velocities of the observed DIBs again are fully consistent with the broad Na D absorption feature of M82 in the range of velocities of +50 km/s to +200 km/s.
ACKNOWLEDGMENTS
Our collaboration and work was much helped by travel money from bilateral (Conacyt-DFG) project grant No. 192334, as well as by Conacyt mobility grant No. 207662. Furthermore, we are very grateful for the technical support of TIGRE (infrastructure, Internet connection, maintenance of hardware and software) by, namely, the DA-UG engineers Filiberto Gonz´alez and Ir´an Montes, as well as by UG’s gen-eral technical support (namely by colleagues at DSTI and Infraestructura). We would also like to thank the anonymous referee for many very helpful comments and suggestions.
REFERENCES
Amanullah R. et al., 2014, ApJ, 788, L21
Ashall C., Mazzali P., Bersier D., Hachinger S., Phillips M., Percival S., James P., Maguire K., 2014, MNRAS, 445, 4424
Chynoweth K. M., Langston G. I., Yun M. S., Lockman F. J., Rubin K. H. R., Scoles S. A., 2008, AJ, 135, 1983 Cox N. L. J., Cordiner M. A., Cami J., Foing B. H., Sarre
P. J., Kaper L., Ehrenfreund P., 2006, A&A, 447, 991 Cox N. L. J., Patat F., 2008, A&A, 485, L9
Cox N. L. J., Patat F., 2014, A&A, 565, A61 Cox, N. L. J. et al., 2007, A&A, 470, 941
de Boer K. S., Richtler T., Savage B. D., 1987, in Danziger I. J., ed., European Southern Observatory Conference and Workshop Proceedings Vol. 26 of European Southern Ob-servatory Conference and Workshop Proceedings, On the interstellar medium in the LMC near SN1987A. pp 549– 554
D’Odorico S., di Serego Alighieri S., Pettini M., Magain P., Nissen P. E., Panagia N., 1989, A&A, 215, 21
Ehrenfreund, P. et al., 2002, ApJ, 576, L117 Foley, R. J. et al., 2014, MNRAS, 443, 2887
Fossey J., Cooke B., Pollack G., Wilde M., Wright T., 2014, Central Bureau Electronic Telegrams, 3792, 1
Goldhaber G., et al., 2001, ApJ, 558, 359 Graham, M. L. et al., 2015, ApJ, 801, 136 G¨uver T., ¨Ozel F., 2009, MNRAS, 400, 2050
Hauschildt P. H., 1992, J. of Quant. Spectrosc. and Radia-tive Transfer, 47, 433
Hauschildt P. H., Baron E., 1999, J. Comp. Applied Math., 109, 41
Herbig G. H., 1995, ARA&A, 33, 19 Hobbs, L. M. et al., 2009, ApJ, 705, 32
Jack D., Baron E., Hauschildt P. H., 2015, MNRAS, 449, 3581
Jordan G. C., Fisher R., Townsley D., Calder A., Graziani C., Asida S., Lamb D., Truran J., 2008, ApJ, 681, 1448 Khokhlov A., 1991, A&A, 245, 114
Kushnir D., Katz B., Dong S., Livne E., Fern´andez R., 2013, ApJ, 778, L37
Levanon N., Soker N., Garc´ıa-Berro E., 2015, MNRAS, 447, 2803
Margutti R., Parrent J., Kamble A., Soderberg A. M., Fo-ley R. J., Milisavljevic D., Drout M. R., Kirshner R., 2014, ApJ, 790, 52
Marion, G. H. et al., 2015, ApJ, 798, 39
Mayya Y. D., Carrasco L., 2009, in Revista Mexicana de Astronomia y Astrofisica Conference Series Vol. 37 of Re-vista Mexicana de Astronomia y Astrofisica Conference Series, M82 as a Galaxy: Morphology and Stellar Content of the Disk and Halo. pp 44–55
Mohan R., Dwarakanath K. S., Srinivasan G., 2004, Jour-nal of Astrophysics and Astronomy, 25, 185
Nielsen M. T. B., Gilfanov M., Bogd´an ´A., Woods T. E., Nelemans G., 2014, MNRAS, 442, 3400
Nomoto K., 1984, ApJ, 277, 791
Pakmor R., Kromer M., Taubenberger S., Sim S. A., R¨opke F. K., Hillebrandt W., 2012, ApJ, 747, L10
Pakmor R., Kromer M., Taubenberger S., Springel V., 2013, ApJL, 770, L8
Parrent J., Friesen B., Parthasarathy M., 2014, Ap&SS, 351, 1
Pereira, R. et al., 2013, A&A, 554, A27 P´erez-Torres, M. A. et al., 2014, ApJ, 792, 38 Perlmutter S., et al., 1999, ApJ, 517, 565 Phillips M. M., 1993, ApJ, 413, L105
Phillips M. M., Lira P., Suntzeff N. B., Schommer R. A., Hamuy M., Maza J., 1999, AJ, 118, 1766
Plewa T., Calder A. C., Lamb D. Q., 2004, ApJ, 612, L37 Riess A., et al., 1998, AJ, 116, 1009
Riess A. G., Press W. H., Kirshner R. P., 1996, ApJ, 473, 88
Ritchey A. M., Wallerstein G., 2015, PASP, 127, 223 Ritchey A. M., Welty D. E., Dahlstrom J. A., York D. G.,
2015, ApJ, 799, 197
Rosswog S., Kasen D., Guillochon J., Ramirez-Ruiz E., 2009, ApJ, 705, L128
Schmitt, J. H. M. M. et al., 2014, Astronomische Nachrichten, 335, 787
Schroeder K.-P., Griffin R. E. M., Hunsch M., 1994, A&A, 288, 273
Silverman J. M., Vinko J., Marion G. H., Wheeler J. C., Barna B., Szalai T., Mulligan B., Filippenko A. V., 2015, arxiv:1502.07278
Sollerman J., Cox N., Mattila S., Ehrenfreund P., Kaper L., Leibundgut B., Lundqvist P., 2005, A&A, 429, 559 Telesco, C. M. et al., 2015, ApJ, 798, 93
Vladilo G., Crivellari L., Molaro P., Beckman J. E., 1987, A&A, 182, L59
Welty D. E., Federman S. R., Gredel R., Thorburn J. A., Lambert D. L., 2006, ApJS, 165, 138
Welty D. E., Ritchey A. M., Dahlstrom J. A., York D. G., 2014, ApJ, 792, 106
Wiese W. L., Smith M. W., Miles B. M., 1969, National Standard Reference Data Series - National Bureau of Standards, 22, 268
Wilson, C. D. et al., 2011, MNRAS, 410, 1409

![[PDF] Cours langage de programmation Lua | Cours informatique](data:image/gif;base64,R0lGODlhAQABAIAAAP///wAAACH5BAEAAAAALAAAAAABAAEAAAICRAEAOw==)