Relationships Between Physical Activity Across Lifetime and Health Outcomes in Older 1
Adults: Results from the NuAge Study. 2
Katherine Boisvert-Vigneault, MSc1,2, Hélène Payette, PhD2,3, Mélisa Audet, MSc1,2, Mathieu
3
Bélanger, PhD4,5,6, Isabelle J. Dionne, PhD1,2.
4
1Faculty of Physical Activity Sciences, University of Sherbrooke, Sherbrooke, Quebec, Canada.
5
2Research Centre on Aging, CIUSS de l’Estrie-CHUS, Sherbrooke, Quebec, Canada.
6
3 Faculty of Medicine & Health Sciences, University of Sherbrooke, Sherbrooke, Quebec,
7
Canada 8
4 Department of Family Medicine, Université de Sherbrooke, Sherbrooke, Quebec, Canada.
9
5 Centre de formation médicale du Nouveau-Brunswick, Moncton, New Brunswick, Canada.
10
6 Office of research services, Vitalité Health Network, Moncton, New Brunswick, Canada.
11
Corresponding Author: 12
Isabelle J. Dionne, Centre de recherche sur le vieillissement CIUSS de l’Estrie-CHUS, 1036 13
Belvédère sud Sherbrooke QC. CAN. J1H 4C4, Phone: (819)780-2220*45671, Fax: (819)829-14
7141, [email protected] 15
Alternate Corresponding Author: 16
Katherine Boisvert-Vigneault, Centre de recherche sur le vieillissement CIUSS de l’Estrie-17
CHUS, 1036 Belvédère sud Sherbrooke QC. CAN. J1H 4C4, Phone: (819)780-2220*45370, 18
Fax: (819)829-7141, [email protected] 19
Funding Sources: 20
This work was supported by the Canadian Institutes of Health Research (MOP-62842); and the 21
Quebec Network for Research on Aging. 22
Running Head: 23
Lifetime PA and health at older age. 24
ABSTRACT 25
OBJECTIVES: This study aims to (1) describe participation in four physical activity (PA) 26
domains across life and (2) examine the influence of PA during adolescence, early, mid-life, and 27
later adulthood on health variables at older age. 28
DESIGN: Retrospective, observational, population-based cohort. 29
SETTING: Longitudinal study Nutrition as a Determinant of Successful Aging study 30
PARTICIPANTS: 1 378 healthy older adults (667 men; 711 women; aged 67-84 yrs at 31
baseline) 32
MEASUREMENTS: Using a modified version of the interviewer-administered Lifetime Total 33
Physical Activity Questionnaire (LTPAQ) and life events calendar to facilitate the recall, 34
participants reported the frequency, duration, and intensity of occupational (OPA), commuting 35
(CPA), household (HPA), and leisure time (LTPA) they participated in at the ages of 15, 25, 45, 36
and 65 years and at the first follow-up (aged 68-85 yrs at follow-up). Fat mass, lean body mass, 37
body mass index, waist to hip ratio, fasting glucose, systolic and diastolic blood pressures, self-38
reported chronic diseases, and socio-demographic were assessed at baseline. 39
RESULTS: Changes in PA differed across sex and PA domain. However, there was a general 40
decline in all PA domains among both sexes after the age of 65. In multiple regression analyses, 41
current LTPA was systematically associated with more favorable waist to hip ratio and fat mass 42
in both sexes, whereas CPA, OPA, and HPA across life were not consistently associated with 43
health variables. 44
CONCLUSION: PA domains during adolescence, early adulthood, and mid-life were not 45
directly related to health variables at older age, while current LTPA was, suggesting it is never 46
too late to start. 47
Key words: Leisure-time, Physical activity history, Body composition, Aging. 48
INTRODUCTION 50
Reducing the burden of cardiometabolic risk factors is a major public health challenge. Regular 51
physical activity (PA) has been shown highly effective to treat and prevent cardiometabolic 52
disease (1). Despite public health efforts to promote PA, only 15% of Canadian adults (2) reach 53
the weekly recommended minimum of 150 minutes of moderate-to-vigorous PA (3). 54
Although signs of cardiometabolic diseases generally manifest later in life, it is now understood 55
they can start developing during childhood (4), strengthening the importance of early adoption 56
and maintenance of physically active lifestyle. Nevertheless, PA declines throughout 57
adolescence, into adulthood, and during the transition toward older age (2,5). While leisure time 58
physical activity (LTPA) patterns over time have been well described (6–8), a very limited 59
number of studies has examined variations in other PA domains, such as commuting (CPA), 60
occupational (OPA), and household (HPA) (9) and this after the age of retirement (10). Given 61
determinants of PA are domain-specific (11) and susceptible to change over the life course (12), 62
decline in PA could take place at different critical periods for each domains. A more 63
comprehensive understanding of age- and domain-related changes in PA may help identify 64
strategies to tailor interventions to promote the maintenance of PA throughout life. 65
To our knowledge, there are no studies examining associations between domain-specific PA at 66
various ages and health outcomes in older adults. Since little is known about the long-term 67
effects of earlier PA on later health status, more studies are needed to improve primary 68
prevention strategies. Finally, the importance of addressing all domains, and not only LTPA, has 69
been highlighted, as each domain may have different effects on health (13). 70
This study aims to (1) describe participation in four PA domains (LTPA, HPA, OPA, CPA) 71
across life and (2) examine the influence of PA during adolescence, early, mid-life, and later 72
adulthood on health status at older age. 73
METHODS 74
Participants 75
Nutrition as a Determinant of Successful Aging (NuAge) is a 5-year observational study of 1 793 76
community-dwelling men and women recruited in three age groups (70y; 75y; 80y) from a 77
random sample of the Quebec Health Insurance database (RAMQ). Participants were in 78
apparently good health and were functionally independent at recruitment in 2003, as previously 79
published (14). 80
Participants were annually tested for biopsychosocial measurements by trained staff using 81
computer-assisted personal interview methodology (WilliamMD, ©Multispectra, 1997-2004)
82
following standardized procedures. All participants signed an informed consent form approved 83
by the Institutional Review Boards at the Institut universitaire de gériatrie de Sherbrooke and 84
Montréal. 85
For the purpose of this secondary study, data from 711 women and 667 men who completed the 86
Lifetime Total physical Activity Questionnaire (LTPAQ) were used. 87
Assessment of Physical Activity 88
Daily PA levels at the ages of 15, 25, 45, and 65 years and at the first follow-up of the NuAge 89
study (75.2 ± 4.2 years; range from 68-85 yrs) was obtained through a modified version of the 90
LTPAQ, administered once during the regular clinical examination of the first follow-up. The 8-91
week test-retest correlations have been reported for lifetime PA (0.74), OPA (0.87), HPA (0.77), 92
and LTPA-CPA (0.72) (15). A recall lifetime calendar focusing on major life events was used as 93
a memory aid. 94
For each domains (LTPA, HPA, OPA, CPA) and targeted ages, the LTPAQ assessed nature, 95
average time/week, duration, and frequency (52, 26, or 0 weeks) of the reported activity. 96
Examples for each domain were provided to participants. As regards OPA, the three main jobs 97
were taken into account, and for each job, a maximum of two activities could be reported at each 98
age. When two activities were reported for one job, the main activity was estimated to account 99
for 75% of PA level related to this job, and the second, for 25%. As regards LTPA, six activities 100
most frequently performed at each age were taken into account. Intensities of LTPA and OPA, 101
expressed in MET, were obtained from the Compendium of Physical Activities (16). HPA were 102
fixed at 5 METs and CPA (walking, running, biking) were respectively fixed at 4, 15, and 9 103
METs (16). 104
Average number of hours/week spent in each activity domain at each age (i) was calculated as 105
follows: [ ∑ 𝐹𝐹𝐹𝐹𝐹𝐹𝐹𝐹𝐹𝐹𝐹𝐹𝐹𝐹𝐹𝐹𝐹𝐹𝑖𝑖 × 𝐷𝐷𝐹𝐹𝐹𝐹𝐷𝐷𝐷𝐷𝐷𝐷𝐷𝐷𝐹𝐹𝑖𝑖 ] /52, where frequency is the yearly average number of
106
weeks for this activity and duration its weekly average duration in hours. We then estimated the 107
average domain-specific PA volume in MET-hours/week, by multiplying the average number of 108
hours/week by the relevant MET value. PA volumes were standardized to a 16-hour waking day 109
to account for differences in reported active time. As such, participants reporting less than 16 110
hours of total PA per day were assigned a non-active behaviour score that is for every hours with 111
no information, we added 1.5 METs, corresponding to sedentary behaviours (17). All domain-112
specific volumes were summed into a 16-hour standardized score for each age period 113
representing a whole year. 114
Sociodemographic and Clinical Variables 115
Sociodemographic information, household income, and lifestyle habits were evaluated at 116
baseline using a validated questionnaire developed from previously published questionnaires 117
(18). 118
Blood pressure and blood sample were obtained in the morning after a 12-hour fasting period. 119
Systolic and diastolic blood pressures were measured using an automatic Dinamap monitor 120
(Critikon, Johnson & Johnson, Tampa, FL). Participants had to be at rest for the previous five 121
minutes and not talking during the two measurements. Plasma glucose was analysed by the 122
clinical laboratory of the Sherbrooke University Hospital Center (Quebec, Canada). 123
Body weight and standing height were measured with participant wearing only light clothes (19). 124
Body mass index (BMI) was calculated [body weight (kg) / height2 (m)]. Waist and hip
125
circumferences were measured at the narrowest circumference of the trunk and the greater 126
trochanter, respectively. 127
Total fat mass (FM) and lean body mass were measured using DXA (Lunar Prodigy; GE 128
Medicals, Madison, WI) in a subset of participants living in Sherbrooke (367 men, 362 women). 129
Coefficients of variation for repeated measures (1 week apart) of FM and lean body mass in 10 130
adults are 5.7% and 1.1%, respectively. 131
Burden of disease was measured by assessing reported chronic conditions, using the OARS 132
Multidimensional Functional Assessment Questionnaire (20). Level of burden of seven self-133
reported chronic conditions (polyarthritis, arthritis, emphysema, hypertension, cardiac problem, 134
circulation problem, diabetes) was summarized from a 3-point rating scale of each conditions; 135
higher score indicating greater burden of disease. 136
Participants’ risk of cardiometabolic disease was represented by summing the presence (1) or 137
absence (0) of each of the following risk factors: BMI ≥25.0 kg/m2 (21); waist circumference
138
≥102.0 cm in men or ≥88.0 cm in women (21); WHR ≥90.0 in men or ≥85.0 in women (21); 139
fasting glucose ≥6.1 mmol/L (22); systolic and diastolic blood pressures ≥140/90 mmHg (23). 140
Higher score indicates greater number of risk factors. 141
Statistical Analysis 142
Assumption of normality of variables was statistically verified with the Kolmogorov–Smirnov 143
test. Variables not normally distributed were transformed in R using the Box-Cox power 144
transformation. Since neither systolic nor diastolic blood pressures met the assumption of 145
normality after transformations, their product “systolic X diastolic” was used in analyses. Mann-146
Whitney U tests (continuous variable) and chi-square tests (categorical variable) were performed 147
to compare baseline characteristics. Two-way ANOVA with factors defined as “sex” and 148
“periods of life” were used to compare PA volumes and intensities between sexes and across life 149
periods, using Bonferroni post hoc test when significant. 150
Further analysis examining PA in relation to health variables were sex-specific because of 151
significant interactions (p<0.05) between PA and sex. A two-block multiple linear regression 152
analysis was performed to identify domain and life period that were best associated with health 153
variables at older age. Age was forced into the first block because current PA was measured over 154
a wide range of ages (68-85 years). In the second block, domain- and time-specific measures of 155
PA were entered in a stepwise procedure given the large number of potential correlates 156
considered. A thorough residual analysis was carried out and multi-collinearity issues were 157
addressed in the final model. Adjusting for marital status, household income, education, cigarette 158
smoking, and alcohol consumption did not change associations and thus, these results are not 159
shown. 160
Analyses were conducted using the SPSS statistical software package version 17.0 (Chicago, IL) 161
and p-values < 0.05 were considered statistically significant. 162
RESULTS 163
Participant Characteristics 164
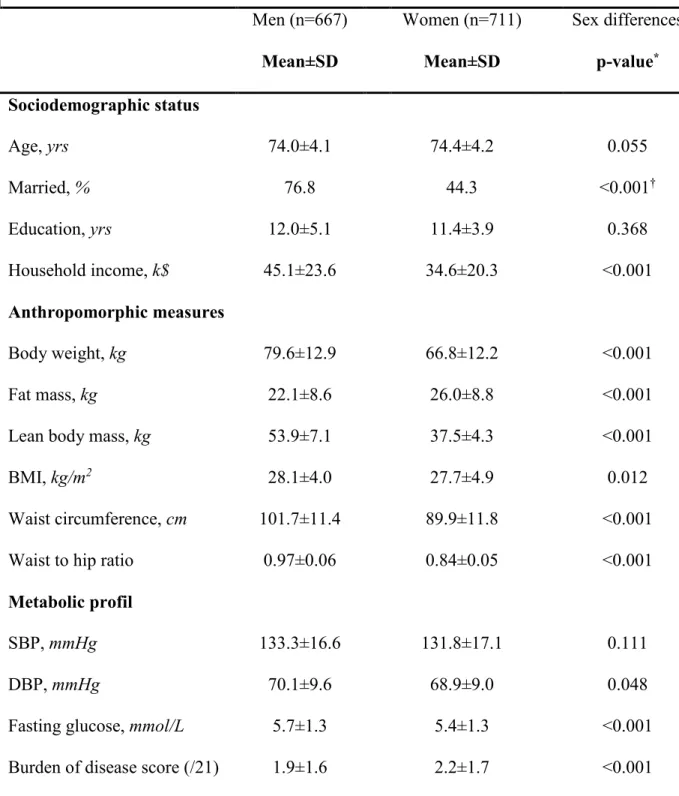
Mean age of participants at baseline was 74.2±4.2 years with 51.6% as women. Men were 165
generally at higher risk with respect to cardiometabolic profile as compared to women (Table 166
1).Women reported a higher number of chronic diseases and more favorable health habits 167
regarding alcohol and tobacco consumption. 168
Domains of Physical Activity Across Life 169
Participation in all domains declined between 65 years and “present” for both sexes (Figures 1A 170
and 1B). OPA was the highest contributor to overall PA at all-time points, except at “present” 171
where LTPA was (Supplementary Material). Women had lower levels of LTPA, HPA, and OPA 172
across all-time points, but similar CPA compared with men. 173
Mean LTPA and OPA intensities were higher in men than women. Intensity of LTPA decreased 174
with advancing age in both sexes. Intensity of OPA peaked at 25 years, and decreased after the 175
age of 65 in women and after 45 years in men. The lack of variability in intensities of CPA, HPA 176
and non-active-behaviours within participants did not allow the two-way ANOVA. 177
Physical Activity in Relation to Health Variables 178
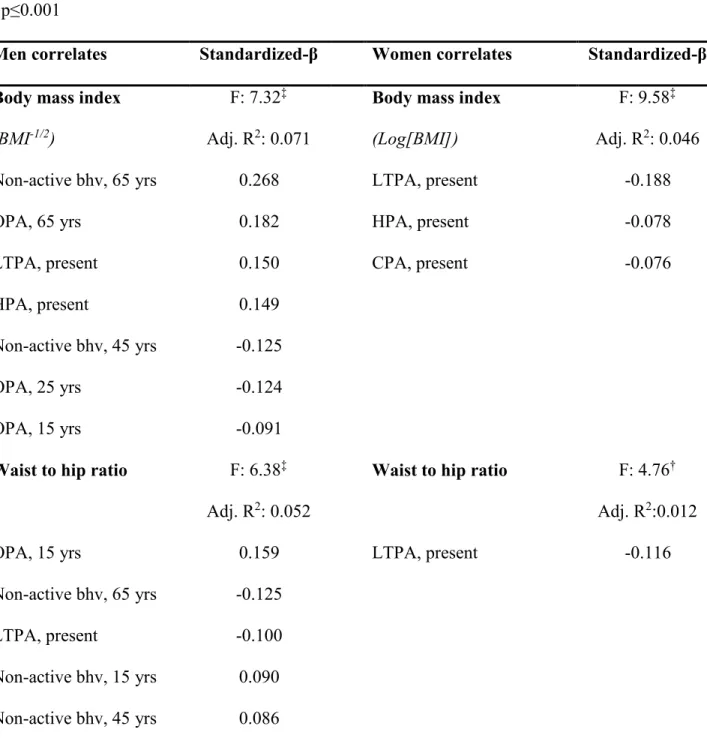
In linear multiple regression models, OPA and non-active behaviours were generally positively 179
associated with health variables, whereas LTPA, HPA, and CPA tended to be negatively related 180
to these variables (Table 2). 181
Although many PA domains at various ages were statistically significant correlates, the 182
magnitude of these relationships was small. Final age-adjusted models explained less than 10% 183
of the variability of health variables, except for LBM in men, and metabolic health variables had 184
the smallest explained variance. Models also explained more variance among men than women 185
for anthropomorphic variables. 186
LTPA at “present” was retained as a significant correlate of most health variables in both sexes. 187
In general, standardized regression coefficients of PA at “present” were among the highest of all 188
significant correlates. More specifically, higher LTPA was associated with higher BMI and 189
glucose and lower WHR and FM in men while in women higher LTPA was associated with 190
lower BMI, WHR, and FM. Linear multiple regression between PA at younger age and fasting 191
glucose or blood pressure at older age showed no consistent pattern. 192
DISCUSSION 193
This study provides the longest longitudinal description of domain-specific PA trajectories 194
documented to date. Results showed that PA declined after 65 years in all four domains, 195
although variations within periods of life are domain-specific. 196
Our study is also the first to investigate associations between all four domains at multiple periods 197
of life and health at older age. We found the strongest evidence for beneficial effects of PA on 198
health in the relationship between LTPA at “present” and WHR and FM in both sexes. A recent 199
meta-analysis investigating associations between various domains and all-cause mortality 200
reported that, compared to CPA and OPA, LTPA showed the strongest associations with 201
mortality (24), suggesting dissimilar impact on health. There is evidence that higher PA intensity 202
is more effective in enhancing cardioprotection, and its association to health is stronger than PA 203
volume (25,26). In our study, despite lower PA volume, we generally found LTPA to be of 204
higher intensity than other domains, except HPA intensity because assigned MET values may 205
have been too high (27). PA recommendations should thus focus more on LTPA than any other 206
domains in order to achieve sufficient intensity to impact health status. 207
To our knowledge, there is a very limited number of studies assessing past PA in relation to 208
current health status. However, a 27-y follow-up study showed no relationship between past or 209
current LTPA and health in adults aged 40, but found the latter moderately associated with 210
cardiorespiratory fitness at age 13 (28). Since PA appears to be one of the most important 211
contributor to cardiorespiratory fitness (29), physical fitness may mediate the relationship 212
between PA and health (25). Whilst fitness is measured objectively, PA is often self-reported and 213
thus, inevitably leads to misclassification and attenuated associations with health (30). Further 214
prospective studies using objective measures of PA and cardiorespiratory fitness through life 215
course will produce more accurate estimates of PA potential benefits in older adults. 216
The lack of strong associations within past PA mainly suggests an absence of direct relationship 217
with current health. For instance, PA at younger ages is related to health status during young age 218
(31) which is an important predictor for health status in adulthood (4). Moreover, being 219
physically active during adulthood helps maintaining high PA levels at older age (32), which 220
appears to be strongly associated with better health at older age. Therefore, PA levels across the 221
life course seem all important because of substantial benefits through indirect pathways. Future 222
studies should investigate repeated assessments of domains and health outcomes across life in 223
order to determine direct relationships and relative contributions of PA across life on later health. 224
Noteworthy, our results suggest OPA might be unfavorable for long-term health. Since 225
physically demanding jobs are often associated with health problems (33), we examined if higher 226
OPA at age 25 was related to lower “current” PA levels and found no association. Thus, work-227
related environmental factors such as unhealthy lifestyle (34) and underprivileged life 228
circumstances (12) could potentially explain disadvantageous health outcomes and should be 229
further investigated. 230
The lack of association between PA and blood pressure in our study is in agreement with 231
previous observational studies (28,35), but contradicts randomized controlled trials (36). 232
Differences in methods of PA assessment and confounding factors such as nutrition (37) or stress 233
(38) could partially explain these ambiguous results. 234
Several limitations must be considered. Our PA measures relied on participants’ recall, 235
potentially affected by social desirability. Recall of current participation in PA may be more 236
explaining stronger associations with outcomes. Finally, given PA was measured at first follow-238
up, PA measures were assessed within a year after health variables. Lack of changes in 239
anthropomorphic variables between baseline and second follow-up (data not shown) allowed us 240
to assume health variables did not change at first follow-up as well. 241
Despite the above limitations, our study has several strengths. PA was assessed over one-year 242
periods, accounting for seasonal variations in PA choices (39). PA measures were in all four 243
domains, which is important for gaining insights into general patterns of PA throughout life. 244
Even though recall periods are a limitation, habitual PA patterns are more accurately reported 245
than irregular ones (40), allowing us to identify regular behaviours, unlike accelerometers or 246
questionnaires that may capture more punctual behaviors. 247
In conclusion, PA levels were higher among men at all-time points, and declined for both sexes 248
after the age of 65 in all domains. Moreover, health-PA relationships are domain-specific. 249
Among past and present PA domains, LTPA at older age may represent the most effective 250
domain to improve anthropomorphic variables at older age. 251
Taken together, these results suggest that sustained PA levels should be maintained across life. 252
More importantly, it seems that significant health benefits could be achieved by practicing LTPA 253
at older age, irrespective of past inactivity. From a public health perspective, older adults aged 254
around 65, especially women, should be encouraged to engage in LTPA, regardless of their 255
history. 256
ACKNOWLEDGMENTS 257
The authors gratefully acknowledge the commitment of participants enrolled in the NuAge study 258
and the contribution of Modou Sene in data analyses. We also acknowledge grants from the 259
Canadian Institutes of Health Research (MOP-62842) and the Quebec Network for Research on 260
Aging. IJD holds the Canada Research Chair on Exercise recommendations for a Healthy Aging. 261
KBV and MA hold doctorate awards from the Fonds de la Recherche en Santé du Québec and 262
the Canadian Institutes of Health Research, respectively. 263 Conflict of Interest 264 None. 265 Authors’ Contributions 266
HP, IJD: study concept and design, acquisition of data. HP: recruitment of subjects. MA, MB, 267
KBV: analysis and interpretation of data; KBV: preparation of the manuscript. All authors 268
revised the manuscript for the important intellectual content and read and approved the final 269 manuscript. 270 Sponsors’ Role 271 None. 272
REFERENCES
1. Janssen I, Leblanc AG. Systematic review of the health benefits of physical activity and fitness in school-aged children and youth. Int J Behav Nutr Phys Act 2010;7:1–16.
2. Colley RC, Garriguet D, Janssen I et al. Physical activity of Canadian adults: accelerometer results from the 2007 to 2009 Canadian Health Measures Survey. Health Rep Stat Can Can Cent Health Inf 2011;22:7–14.
3. Health Canada and Canadian Society for Exercise Physiology. Canada’s Physical Activity Guide to Healthy Active Living. Ottawa (ON): Health Canada, 2011.
4. Juhola J, Oikonen M, Magnussen CG et al. Childhood physical, environmental, and genetic predictors of adult hypertension: the cardiovascular risk in young Finns study. Circulation 2012;126:402–409.
5. Raudsepp L, Neissaar I, Kull M. Longitudinal stability of sedentary behaviors and physical activity during early adolescence. Pediatr Exerc Sci 2008;20:251–262.
6. Nguyen HQ, Herting JR, Kohen R et al. Recreational physical activity in postmenopausal women is stable over 8 years of follow-up. J Phys Act Health 2013;10:656–668.
7. Pan L-Y, Hsu H-C, Chang W-C et al. Trajectories of physical activity and risk factors among Taiwanese older adults. Int J Behav Med 2015;22:62–69.
8. Xue Q-L, Bandeen-Roche K, Mielenz TJ et al. Patterns of 12-year change in physical activity levels in community-dwelling older women: can modest levels of physical activity help older women live longer? Am J Epidemiol 2012;176:534–543.
9. Knuth AG, Hallal PC. Temporal trends in physical activity: a systematic review. J Phys Act Health 2009;6:548–559.
10. Barnett I, Van Sluijs EM, Ogilvie D. Physical activity and transitioning to retirement: a systematic review. Am J Prev Med 2012;43:329–336.
11. Rovniak LS, Sallis JF, Saelens BE et al. Adults’ physical activity patterns across life domains: cluster analysis with replication. Health Psychol 2010;29:496–505.
12. Bauman AE, Reis RS, Sallis JF et al. Correlates of physical activity: why are some people physically active and others not? Lancet 2012;380:258–271.
13. Wanner M, Tarnutzer S, Martin BW et al. Impact of different domains of physical activity on cause-specific mortality: a longitudinal study. Prev Med 2014;62:89–95.
14. Gaudreau P, Morais JA, Shatenstein B et al. Nutrition as a determinant of successful aging: description of the Quebec longitudinal study Nuage and results from cross-sectional pilot studies. Rejuvenation Res 2007;10:377–386.
15. Friedenreich CM, Courneya KS, Bryant HE. The lifetime total physical activity questionnaire: development and reliability. Med Sci Sports Exerc 1998;30:266–274.
16. Ainsworth BE, Emplaincourt PO, Jacobs J D R. et al. Compendium of physical activities: an update of activity codes and MET intensities. Med Sci Sports Exerc 2000;32:S498.
18. Levasseur M. Sources et justifications des questions utilisées dans l’enquête Santé Québec. Cahier technique, 87-03. Québec (QC): Ministère de la santé et des services sociaux, Gouvernement du Québec, 1987.
19. Lohman TG, Roche AF, Martorell R. Anthropometric Standardization Reference Manual. Champaign, IL: Human Kinetics, 1988.
20. Fillenbaum GG, Smyer MA. The development, validity, and reliability of the OARS multidimensional functional assessment questionnaire. J Gerontol 1981;36:428–434. 21. World Health Organization. Waist circumference and waist-hip ratio, report of a WHO
expert consultation. Geneva, Switzerland: World Health Organization, 2008.
22. Canadian Diabetes Association Clinical Practice Guidelines Expert Committee, Goldenberg R, Punthakee Z. Definition, classification and diagnosis of diabetes, prediabetes and
metabolic syndrome. Can J Diabetes 2013;37 Suppl 1:S8–S11.
23. Go AS, Bauman MA, Coleman King SM et al. An effective approach to high blood pressure control: a science advisory from the American Heart Association, the American College of Cardiology, and the Centers for Disease Control and Prevention. Hypertension 2014;63:878– 885.
24. Samitz G, Egger M, Zwahlen M. Domains of physical activity and all-cause mortality: systematic review and dose-response meta-analysis of cohort studies. Int J Epidemiol 2011;40:1382–1400.
25. Sassen B, Cornelissen VA, Kiers H et al. Physical fitness matters more than physical activity in controlling cardiovascular disease risk factors. Eur J Cardiovasc Prev Rehabil
2009;16:677–683.
26. Lee I-M, Sesso HD, Oguma Y et al. Relative intensity of physical activity and risk of coronary heart disease. Circulation 2003;107:1110–1116.
27. Knaggs JD, Larkin KA, Manini TM. Metabolic cost of daily activities and effect of mobility impairment in older adults. J Am Geriatr Soc 2011;59:2118–2123.
28. Kvaavik E, Klepp KI, Tell GS et al. Physical fitness and physical activity at age 13 years as predictors of cardiovascular disease risk factors at ages 15, 25, 33, and 40 years: extended follow-up of the Oslo Youth Study. Pediatrics 2009;123:e80–e86.
29. Carrick-Ranson G, Hastings JL, Bhella PS et al. The effect of lifelong exercise dose on cardiovascular function during exercise. J Appl Physiol 2014;116:736–745.
30. Blair SN, Cheng Y, Holder JS. Is physical activity or physical fitness more important in defining health benefits? Med Sci Sports Exerc 2001;33:S379–S399; discussion S419–S420. 31. Ekelund U, Luan J, Sherar LB et al. Moderate to vigorous physical activity and sedentary
time and cardiometabolic risk factors in children and adolescents. J Am Med Assoc 2012;307:704–712.
32. Hirvensalo M, Lintunen T, Rantanen T. The continuity of physical activity--a retrospective and prospective study among older people. Scand J Med Sci Sports 2000;10:37–41.
33. Haukka E, Ojajärvi A, Takala E-P et al. Physical workload, leisure-time physical activity, obesity and smoking as predictors of multisite musculoskeletal pain. A 2-year prospective study of kitchen workers. Occup Environ Med 2012;69:485–492.
34. Camões M, Lopes C. Dietary intake and different types of physical activity: full-day energy expenditure, occupational and leisure-time. Public Health Nutr 2008;11:841–848.
35. Ekblom-Bak E, Hellénius M-L, Ekblom O et al. Independent associations of physical activity and cardiovascular fitness with cardiovascular risk in adults. Eur J Cardiovasc Prev Rehabil 2010;17:175–180.
36. Cornelissen VA, Smart NA. Exercise training for blood pressure: a systematic review and meta-analysis. J Am Heart Assoc 2013;2:e004473.
37. Whelton PK, Appel LJ, Sacco RL et al. Sodium, blood pressure, and cardiovascular disease: further evidence supporting the American Heart Association sodium reduction
recommendations. Circulation 2012;126:2880–2889.
38. Player MS, Peterson LE. Anxiety disorders, hypertension, and cardiovascular risk: a review. Int J Psychiatry Med 2011;41:365–377.
39. Hagströmer M, Rizzo NS, Sjöström M. Associations of season and region on objectively assessed physical activity and sedentary behaviour. J Sports Sci 2014;32:629–634.
40. Jobe JB, Tourangeau R, Smith AF. Contributions of survey research to the understanding of memory. Appl Cogn Psychol 1993;7:567–584.
TABLES
Table 1. Baseline Characteristics of the NuAge Cohort Subset Participants (N=1378)
* p-value from Mann-Whitney U test, unless stated otherwise. † p-value from Chi-square test.
Men (n=667) Mean±SD Women (n=711) Mean±SD Sex differences p-value* Sociodemographic status Age, yrs 74.0±4.1 74.4±4.2 0.055 Married, % 76.8 44.3 <0.001† Education, yrs 12.0±5.1 11.4±3.9 0.368 Household income, k$ 45.1±23.6 34.6±20.3 <0.001 Anthropomorphic measures Body weight, kg 79.6±12.9 66.8±12.2 <0.001 Fat mass, kg 22.1±8.6 26.0±8.8 <0.001
Lean body mass, kg 53.9±7.1 37.5±4.3 <0.001
BMI, kg/m2 28.1±4.0 27.7±4.9 0.012
Waist circumference, cm 101.7±11.4 89.9±11.8 <0.001
Waist to hip ratio 0.97±0.06 0.84±0.05 <0.001
Metabolic profil
SBP, mmHg 133.3±16.6 131.8±17.1 0.111
DBP, mmHg 70.1±9.6 68.9±9.0 0.048
Sum of risk factors (/6) 2.7±1.3 2.2±1.4 <0.001 Health habits Current smoker, %(n) 7.8 (52) 4.2 (30) <0.001† Past smoker, %(n) 58.6 (391) 27.6 (196) Never smoked, %(n) 33.6 (224) 68.2 (485) Occasional drinker (<1 alcoholic drink/day), %(n) 12.4 (83) 23.9 (170) <0.001† Moderate drinker (1 alcoholic drink/day), %(n) 13.8 (92) 29.3 (208) Regular drinker (≥2 alcoholic drink/day), %(n) 73.8 (492) 46.8 (333)
Table 2. Beta Estimates of the Relationship Between Levels of LTPA, OPA, HPA, and CPA at Different Periods of Life and Health Variables in Older Adults Obtained from Stepwise Linear Regressions, Age-adjusted Models.
* p<0.05 † p≤0.01 ‡ p≤0.001
Men correlates Standardized-β Women correlates Standardized-β Body mass index
(BMI-1/2)
F: 7.32‡
Adj. R2: 0.071
Body mass index (Log[BMI])
F: 9.58‡
Adj. R2: 0.046
Non-active bhv, 65 yrs 0.268 LTPA, present -0.188
OPA, 65 yrs 0.182 HPA, present -0.078
LTPA, present 0.150 CPA, present -0.076
HPA, present 0.149
Non-active bhv, 45 yrs -0.125
OPA, 25 yrs -0.124
OPA, 15 yrs -0.091
Waist to hip ratio F: 6.38‡
Adj. R2: 0.052
Waist to hip ratio F: 4.76†
Adj. R2:0.012
OPA, 15 yrs 0.159 LTPA, present -0.116
Non-active bhv, 65 yrs -0.125
LTPA, present -0.100
Fat mass (FM%2) F: 11.50‡ Adj. R2: 0.083 Fat mass (FM1/2) F: 7.42‡ Adj. R2:0.035
LTPA, present -0.243 LTPA, present -0.204
HPA, present -0.145
Lean body mass F: 20.75‡
Adj. R2:0.101
Lean body mass (LBM-1/2)
F: 7.26*
Adj. R2:0.018
OPA, 15 yrs 0.113 CPA, 15 yrs 0.106
Fasting glucose (Glucose-2) F: 4.48† Adj. R2:0.016 Fasting glucose (Glucose-2) F: 5.99‡ Adj. R2:0.028
LTPA, present 0.101 HPA, 15 yrs -0.105
HPA, 25 yrs -0.077 Non-active bhv, 25 yrs -0.089
HPA, 45 yrs -0.075 Blood pressure ([SBP•DBP]-1/2) F: 3.24* Adj. R2:0.010 Blood pressure ([SBP•DBP]-1/2) F: 3.405† Adj. R2:0.014
CPA, 45 yrs 0.091 OPA, 45 yrs 0.189
CPA, 15 yrs -0.083 Non-active bhv, 45 yrs 0.157
LTPA, 45 yrs 0.091
β, Standardized beta coefficient; Bhv, Behaviors; BMI, Body mass index; CPA, Commuting physical activity; DBP, Diastolic blood pressure; FM, Fat mass; FM%, Fat mass percentage [Fat mass (kg)/body weight (kg)]; HPA, Household physical activity; LBM, Lean body mass; LTPA, Leisure time physical activity; OPA, occupational physical activity; SBP, Systolic blood
FIGURE LEGENDS
Figure 1. A) Physical activity domain-specific volumes in men across lifespan. B) Physical activity domain-specific volumes in women across lifespan. * denotes significant within-domain
changes from the preceding time period. See Supplementary material for more details about physical activity components.
SUPPLEMENTAL MATERIAL FOR ONLINE ONLY
Supplementary Table S1. Physical activity components for each period of life in men and women (N=1378)
a Significantly different from present; b 65 years old; c 45 years old; d 25 years old; e 15 years old. * p-value from t-test for independent samples, unless stated otherwise.
† p-value for a “Time*Sex” interaction from two-way ANOVA.
Men (n=667) Women (n=711) Sex difference in volume Sex difference in intensity Physical activity domain Volume (MET-hours/week) Mean ± SD Intensity (MET) Mean ± SD Volume (MET-hours/week) Mean ± SD Intensity (MET) Mean ± SD p-value* p-value* 16-hour standardized score <0.001† <0.001†
Present 198.4 ± 35.3bcde 2.12 ± 0.68 bcde 184.7 ± 20.8bcde 1.83 ± 0.40 bcde <0.001 <0.001
45 years old 242.0 ± 69.4abd 2.67 ± 1.02abde 222.7 ± 38.1be 2.31 ± 0.54 ab <0.001 <0.001
25 years old 249.9 ± 76.7abc 2.82 ± 1.25 abc 222.2 ± 36.9abe 2.30 ± 0.57 ab <0.001 <0.001
15 years old 244.6 ± 65.7ab 2.87 ± 1.05 abc 212.6 ± 38.5abcd 2.36 ± 0.69 ab <0.001 <0.001
Leisure time 0.376† 0.155†
Present 23.1 ± 25.5bcde 4.10 ± 1.28bcde 15.7 ± 17.9bde 3.89 ± 1.12 bcde <0.001 0.004
65 years old 27.2 ±29.0acd 4.49 ± 1.41 acde 20.3 ± 21.9acd 4.31 ± 1.36 acde <0.001 0.032
45 years old 18.9 ± 25.5abe 5.25 ± 1.60 abde 14.4 ± 20.2bde 4.74 ± 1.56 abe <0.001 <0.001
25 years old 17.7 ± 29.5abe 6.68 ± 1.70 abce 12.0 ±19.9abce 5.02 ± 1.69 abe <0.001 <0.001
15 years old 30.4 ± 38.3acd 6.53 ± 1.33 abcd 23.5 ± 32.7acd 6.15 ± 1.62 abcd <0.001 <0.001
Household <0.001† ----
Present 11.6 ± 28.1bde 5.0 3.8 ± 14.7bc 5.0 <0.001 ----
65 years old 16.8 ± 33.9ade 5.0 5.9 ± 17.8ade 5.0 <0.001 ----
45 years old 13.3 ±24.4de 5.0 6.5 ± 19.3ade 5.0 <0.001 ----
25 years old 5.9±19.3abce 5.0 2.3 ± 9.7bc 5.0 <0.001 ----
Present 16.9 ± 36.3bcde 2.58 ± 1.46 12.3 ± 27.1bcde 2.17 ± 0.75 bcde 0.009 <0.001
65 years old 46.1 ± 60.0acde 2.63 ± 1.38 36.2 ± 48.0acde 2.39 ± 0.84 ade 0.001 0.002
45 years old 112.5 ± 71.3abd 2.67 ± 1.39 d 98.5 ± 44.1abe 2.49 ± 0.75 ae <0.001 0.004
25 years old 124.1 ± 78.0abce 3.02 ± 1.69 ce 102.4 ± 45.4abe 2.55 ± 0.80 abe <0.001 <0.001
15 years old 110.1 ± 69.7abd 2.59 ± 1.46d 80.4 ± 42.9abcd 2.01 ± 0.75 abcd <0.001 <0.001
Commuting 0.295† ----
Present 0.1 ± 0.8bcde 4.08 ± 0.36 0.2 ± 0.9bcde 4.21 ± 1.02 0.135 0.577
65 years old 0.35 ± 2.0acde 4.81 ± 2.31 0.6 ± 2.6acde 4.15 ± 0.96 0.034 0.112
45 years old 1.7 ± 6.8abde 4.26 ± 1.08 1.5 ± 4.1abde 4.17 ± 0.91 0.496 0.521
25 years old 3.6 ± 8.0abce 4.41 ± 1.50 3.0 ± 7.3abce 4.26 ± 1.09 0.214 0.278
15 years old 8.5 ± 10.9abcd 4.48 ± 1.54 7.8 ± 10.2abcd 4.18 ± 0.99 0.282 <0.001
Non-active behaviour
score
0.010† ----
Present 146.8 ± 20.0bcde 1.5 152.8 ± 17.9bcde 1.5 <0.001 ----
45 years old 95.7 ± 17.6abd 1.5 101.8 ± 21.0ab 1.5 <0.001 ----
25 years old 98.6 ± 19.4abce 1.5 102.5 ± 20.1abe 1.5 <0.001 ----