Towards a more automated mineralogy
Eric PirardGeMMe, Université de Liège, Belgium
Abstract. Automated mineralogy has been around for more than thirty years as the reference technique to support process mineralogy and geometallurgical studies. Pioneering techniques such as the QEM-SEM have been further improved to benefit from the latest hardware developments in terms of stable, sensitive and efficient imaging. FEG sources, solid state x-ray detectors and almost real-time signal processing have made the most significant contributions in the last decade. A quick overview of existing technologies reveals that further improvement could be gained by merging different imaging modes and using more advanced classification algorithms such as those well known in machine learning and remote sensing. If such algorithms were complemented with hierarchical databases wherein only important economic minerals are listed with their associated probabilities of occurrences, significant improvements could be gained in automated mineral identification. This paper contributes to demonstrate that a real “mineral intelligence” of ores and materials is now within reach.
1 Introduction
Minerals are the essential building blocks of the rocks and ores we prospect and process. Therefore our capacity to describe any material in terms of constituent phases is of primary importance if we want to develop a prognostic characterisation of the behaviour of this material during mineral processing, extractive metallurgy or even recycling.
Quantitative approaches have been pioneered in the XIXth century and led to the incidental discovery of the first principle of stereology by a French mining engineer (Delesse 1848). In those times, hand-drawn contours of mineral grains were the basis of area fraction estimations (AA) whereas today the proportion of pixels in a digital image is a more straightforward procedure (Pirard and Sardini 2008) … given any pixel has previously been associated to a mineral species!
This critical step of properly assigning a mineralogical species to a pixel is at the heart of what is designated a bit abusively today as automated mineralogy (Sutherland et al. 1988). Indeed, the process of building a species identification protocol (SIP) before running any new analysis is a critical step still requiring a lot of manual editing and supervision by a skilled operator. A fully automated mineralogy will only be claimable once we reach a fully non-supervised classification. In this paper we explore some possible ways forward.
2 Mineral identification
2.1 Minerals from spectral signatures
Marcasite is a common mineral with a fixed composition FeS2 exactly similar to pyrite, but an orthorhombic crystal structure. With the exception of using micro-diffraction technologies, there is obviously no easy way to discriminate it from pyrite under the scanning electron microscope.
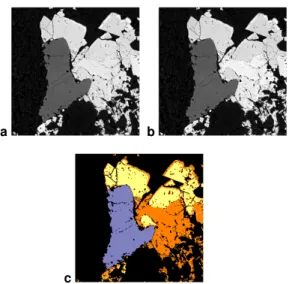
As evidenced by figure 1, the full reflectance spectrum from 400 to 1000 nm documented by Castroviejo et al. (2010) offers good perspectives in reflected light optical microscopy provided a suitable imaging technology is being used. A first possibility would be to take images in the very near infrared (700nm) and use a simple thresholding criteria to classify pixels as marcasite (< 50%) or pyrite (>50%). An alternative technique is to stack together images taken at 500 nm but at different orientations of the polariser (Pirard et al., 2007) and make use of the variability of individual pixels as classification criteria (Fig. 2).
Figure 1. Specular reflectance spectra (400 nm – 1000nm) of bireflectant marcasite (red dotted lines) as compared to pyrite (green line). Data from Castroviejo et al. 2010.
2.2 Minerals from chemical composition
Modern Si-drift detectors have brought significant improvements to the capabilities of energy dispersive analysis of X-rays generated by e-beam excitation (SEM-EDX). It has been common practice until recently to identify mineral species by least square comparison of their raw spectrum with synthesized or experimental spectra collected in user-defined database. However, it is now possible to achieve almost real-time deconvolution of EDX spectra and identify minerals from their quantitative chemical composition.
a b
c
Figure 2. Selection of two images (a,b) from the same scene taken at different orientations of the polariser and resulting classified image (c) with marcasite (yellow), pyrite (orange) and sphalerite (purple). Pixels are classified based on their absolute reflectance and variability with orientation.
Most recent systems such as the Zeiss Mineralogic use indeed compositional data to classify pixels into minerals. But, due to the limited integration time acceptable for full mapping (typ. 3000 counts) the stoichiometry of minerals is still approximate and often large compositional tolerances are required to reach high classification rates. Tolerances have to be even higher when chemical zonation is present within mineral grains (Fig. 3).
a b
c d
Figure 3. Hercynite crystal from a Cu-Co slag with variable composition as seen in backscattered electrons imaging (a) and in a false-colour Al-Fe-Si map (b). Classification based on large elemental ranges (c) shows a single crystal of hercynite (blue) whereas a non-supervised cluster analysis (d) clearly identifies at least two different regions (FeO.Al2O3 (blue) and 5FeO.3Al2O3
(green)).
3 Lessons learnt
3.1 Multimodal imagingPrevious examples indicate that the combination of several imaging modes, what is known today as correlative microscopy, is the way forward to achieve an optimal phase recognition. Mineralogical imaging software should be able to stack together multispectral (different wavelengths) and/or multiradial (different orientations of the polariser) optical images, backscattered electrons images and EDX maps so as to almost perfectly discriminate the different domains existing in any material.
In order to improve image segmentation it is also strongly recommended to use multivariate classification and not just simple thresholding techniques. Basically, there are two families of multivariate classification techniques: the supervised and the non-supervised. The first ones require the operator to introduce a priori knowledge in terms of a list of minerals present in the scene, or alternatively to train the system by designating representative regions of the different minerals. Non-supervised techniques on the other hand, are fully autonomous and will identify clusters in the spectral signatures (feature space), which can then be checked automatically against a mineral database. The only problem with non-supervised techniques is that they need a stopping criterion such as for example the maximum number of clusters to be identified. Figure 3d illustrates how segmenting into six clusters instead of five reveals a chemical zonation in a hercynite crystal which would otherwise be considered as a single domain.
3.2 Mineral databases
There are plenty of databases compiling physical and chemical properties of minerals. Among the most well-known are WEBMINERAL with 4171 minerals searchable by composition or structure and RRUFF with 3527 minerals and their chemistry, X-ray diffraction patterns, Raman or Infrared reflectance spectra. Despite the commendable efforts made by the authors, these databases will remain of poor use in automated mineralogy as long as probabilities of occurrences and associations are not being introduced.
Considering applications in geometallurgy and process mineralogy, the selection of minerals can certainly be reduced to a few hundred species of economic interest. Moreover, within a given environment (orebody model), it is obvious that some minerals or some associations (parageneses) have to be ruled out or have very low probabilities of occurrence.
In addition to probabilities, a database could also include a hierarchical grouping of minerals into geometallurgical families as illustrated in figure 4. Geometallurgical families could be defined as groups of minerals with similar behaviour in a given process (ex. flotation) or containing the same valuable element.
Figure 4. Example of a hierarchical classification of sulphides and secondary Cu-bearing sulphides (chalcopyrite, bornite, covellite, digenite, chalcocite,…)
3.3 Mixels
A classical problem in image segmentation is the appearance of mixels or pixels with a mixed signature. Mixels are very common in remote sensing as the spatial resolution is often so low that most pixels have to be interpreted as a mix of one or more pure mineralogical (or lithological) components. Algorithms such as pixel purity index have found interesting applications in mineral resources mapping (Caceres et al. 2008).
In automated mineralogy under the microscope, spatial resolution is usually higher than the smallest grain size. Hence, mixels are most often due to solid solutions or to transitions between two grains. In the first case, a mixel has to be interpreted correctly as a transition between two acceptable mineral species (ex. hübnerite and ferberite), whereas in the second case a mixel has to be replaced by either one or the other mineralogical species. Figure 4 illustrates how well identified mineralogical species can compete for a transition zone (mixels) using conditional dilation.
a
b c
Figure 5. Classification (b) of sulphides from the Chelopech epithermal mineralisation into chalcopyrite (orange), pyrite (yellow), enargite (grey) and tennantite (green). The same after conditional propagation (c).
4 Conclusions
The proper identification of major ore minerals under the microscope is within reach of automated systems provided they use and combine all possible sources of information within one single classification procedure. So-called correlative microscopy should become a standard technology to seamlessly observe ore textures under different microscopy modes. Thanks to advanced classification algorithms (using for example hierarchical clustering), it will be possible to identify the purest signatures in a scene and check these with respect to a hierarchical database including probabilities of mineral occurrences. Remaining unclassified pixels should be further refined and checked against the possibility of being mixels of previously identified species. A propagation algorithm will make sure to reallocate all mixels to the corresponding mineral classes or eventually to a new term (solid-solution).
After classification, a cross-validation should always be performed between image analysis and chemical analysis (ICP-MS) or semi-quantitative mineralogy (XRD). Discrepancies should be identified and eventually lead to the decision to repeat the classification in case of major discrepancies in terms of identified minerals or mineral abundances.
Acknowledgements
The author would like to acknowledge the help of Hassan Bouzahzah with SEM-based imaging techniques and the contributions of several master students with applications of quantitative imaging in optical microscopy.
References
Caceres F, Ali-Ammar H, Pirard E (2008) Mapping evaporitic minerals in Sud Lipez salt lakes (Bolivia) using remote sensing. Reviews in Economic Geology, 16.
http://hdl.handle.net/2268/12321
Castroviejo R, Catalina JC, Bernhardt HJ, Pirard E, Brea C, Pérez-Barnuevo L, Segundo F, Espí JA (2010) Multispectral (visible and near infra-red, 400-1000 nm range) reflectance data file from common ore minerals
http://www.minasyenergia.upm.es/laboratorio/microscopia_aplicada Delesse A (1848) Procédé mécanique pour déterminer la composition
des roches: Comptes-Rendus de l'Académie des Sciences. Mineralogy Database Online, available at http://webmineral.com Pirard E, Lebichot S, Krier W (2007) Particle texture analysis using polarized light imaging and grey level intercepts. International Journal of Mineral Processing, 84 (1-4): 299-309.
http://hdl.handle.net/2268/456
Pirard E, Sardini P (2011) Image analysis for advanced characterization of industrial minerals and geomaterials in Christidis, G. (Ed.) Advanced Characterization of Industrial Minerals. EMU Lecture Notes Vol IX.
RRUFF an integrated database of Raman spectra, X-ray diffraction and chemistry data for minerals, available online at
http://rruff.info
Sutherland D, Gottlieb P, Jackson R, Wilkie G, Stewart P. (1988) Measurement in section of particles of known composition. Minerals Engineering 1(4): 317-326. doi:10.1016/0892-6875(88)90021-0