Automated analysis of background EEG and reactivity during therapeutic hypothermia in comatose patients after cardiac arrest
Noirhomme Qa,b, Lehembre Ra,b, Lugo Za,b, Lesenfants Da,b, Luxen Aa, Laureys Sa,b, Oddo Mc,d, Rossetti AOd,e.
a Cyclotron Research Centre, University of Liège, Liège, Belgium
b Coma Science Group, Neurology department, University Hospital of Liège, Liège, Belgium c Department of Intensive Care Medicine, CHUV-University Hospital, Lausanne, Switzerland d Faculty of Biology and Medicine, University of Lausanne, Lausanne, Switzerland
e Service de Neurologie, CHUV-University Hospital, Lausanne, Switzerland
Acknowledgments
This study was funded by FEDER structural fund RADIOMED-930549; Belgian National Funds for Scientific Research (FNRS); Fonds Léon Fredericq; James S. McDonnell Foundation; Mind Science Foundation; European ICT Programme Projects FP7-247919 DECODER; Concerted Research Action (ARC 06/11-340); Public Utility Foundation “Université Européenne du Travail” and “Fondazione Europea di Ricerca Biomedica”. The Swiss National Science
Foundation provides support to MO (320030_138191) and AOR (CR32I3_143780). The funding sources are not liable for any use that may be made of the information contained therein. The funders had no role in study design, data collection and analysis, decision to publish, or preparation of the manuscript.
Reference
Quentin Noirhomme, Rémy Lehembre, Zulay del Rosario Lugo, Damien Lesenfants, André Luxen, Steven Laureys, Mauro Oddo, and Andrea O. Rossetti
Automated Analysis of Background EEG and Reactivity During Therapeutic Hypothermia in Comatose Patients After Cardiac Arrest Clin EEG Neurosci 1550059413509616, first published
Abstract
Visual analysis of EEG background and reactivity during therapeutic hypothermia provides important outcome information, but is time-consuming and not always consistent between reviewers. An automated EEG analysis approach may help to quantify the brain damage. Forty-six comatose patients in therapeutic hypothermia after cardiac arrest were included in the study. EEG background was quantified with burst-suppression ratio and approximate entropy, both used to monitor anesthesia. Reactivity was detected through change in the power spectrum of signal before and after stimulation. Automatic results obtained almost perfect agreement (discontinuity) to substantial agreement (background reactivity) with a visual score from EEG-certified neurologists. Burst-suppression ratio was more suited to distinguish continuous EEG background from burst-suppression than approximate entropy in this specific population.
Automatic EEG background and reactivity measures were significantly related to good and poor outcome. We conclude that quantitative EEG measurements can provide promising information regarding current state of the patient and clinical outcome, but further work is needed before a routine application in a clinical setting.
Introduction
EEG monitoring provides important information regarding brain function, particularly in comatose patients1-3, and is increasingly used to monitor early changes of cerebral
electrophysiology at the bedside in critically ill patients. EEG background activity and EEG reactivity are associated with prognostic information2, 4-6. Currently, EEG is monitored mostly through visual analysis of the raw signals, but this approach is subjective and therefore
dependent on the investigator. Agreement ratings between trained electroencephalographers are generally moderate to good, but not absolute7, 8. Quantitative EEG analysis, the numerical computations of parameters from the EEG, has received some attention in this setting, and has been shown to offer better validity than visual scoring9.
In this specific setting, visually assessed absent EEG background, lack of reactivity, persistent discontinuous background, or the presence of seizures or epileptiform discharges are strong risk factors of poor outcome10-13; these features are generally assessed in normothermia. Recently, EEG reactivity during therapeutic hypothermia (TH) has also been shown to carry robust prognostic information2, 11, 14. Automatic analysis of background EEG has been proposed with methods based on burst-suppression ratio, entropy15 or amplitude equivalent EEG16, 17 and shown to have prognostic implications, but was not compared to visual analysis. Furthermore, these studies did not include the important variable of reactivity.
In the present study, we sought to examine the relation between automatic and visual EEG analysis of background EEG and reactivity. We also investigated their prognostic value. Background EEG was analyzed with two methods developed to monitor anesthesia: the burst suppression ratio (BSR)18and the approximate entropy19, 20. Reactivity was analyzed with a method based on frequency features of the signal.
Materials and methods
Patients
We included 46 post-anoxic comatose patients (9 females; age 61± 2) admitted from January 2011 to May 2012 to the Department of Adult Critical Care Medicine, Centre Hospitalier
Universitaire Vaudois (CHUV-Lausanne University Hospital), Lausanne, Switzerland. The study was approved by the Ethics Committee of the institution. The average time between cardiac arrest (CA) and return of spontaneous circulation was 20±12 minutes. Level of consciousness was assessed based on the Glasgow Coma Scale at regular intervals (every 2–3 h) during the first 48 h after coma onset. All patients scored 3 or 4 during these first 48 h, indicating unconscious state.
All patients were managed according to a standard protocol21; they were resuscitated following current recommendations (American Heart Association, 2005) and treated with mild therapeutic hypothermia to 33°C for 24 h, using ice-packs, intravenous ice-cold fluids and a surface cooling
device (Arctic Sun System, Medivance) for the maintenance of therapeutic hypothermia, during which standardized doses of midazolam (0.1 mg/kg/h) and fentanyl (1.5 mg/kg/h) were
administered for sedation, and vecuronium (0.1 mg/kg boluses) to control shivering. Patients with myoclonus and/or electroencephalographic epileptiform activity were treated with
intravenous anti-epileptic drugs, which were discontinued if no clinical improvement was noted after at least 72 h. An interdisciplinary decision on withdrawal of intensive care support was based on a multimodal approach11 including at least two of the following (assessed in
normothermia at least 48–72 h after cardiac arrest): incomplete recovery of brainstem reflexes, early myoclonus, bilaterally absent cortical somatosensory evoked potentials, and lack of EEG reactivity, Specifically, the EEG reactivity during TH, which is the object of the present study, was not used for this decision.
Outcome assessment
Neurologic outcome was assessed at 3 months by a semi-structured phone interview, and categorized according to the Glasgow-Pittsburgh Cerebral Performance Categories (CPC), in which 1 = good recovery, 2 = moderate disability, 3 = severe disability with dependency for daily-life activity, 4 = vegetative state, and 5 = death22, and outcome was dichotomized as good (CPC 1 and 2) versus poor (CPC 3 to 5).
EEG recording
Video-EEG (Viasys Neurocare, Madison, WI, USA) was performed during TH, by using 19 electrodes arranged according to the international 10-20 system (Fp1, Fp2, F7, F3, Fz, F4, F8, T3, C3, Cz, C4, T4, T5, P3, Pz, P4, T6, O1, O2) referenced to Oz, ground Fpz, and repeated after rewarming. Background reactivity on EEG was tested with repetitive auditory and nociceptive stimulations performed by a neurologist during and after TH, as described in our previous study11. Patients had 5 stimulations in average (range 1 to 9 stimulations, median 5). While these EEGs were recorded for at least 20 minutes, for the present study we selected the parts of the recordings that contained stimulations, excluding artifacts, and generated EEG files lasting 3 to 12 minutes. Offline, data were re-referenced to a common average reference. Some recordings of this dataset were previously visually analyzed and the results summarized in a publication14.
Visual scoring
All recordings were interpreted by two EEG-certified CHUV neurologists; EEG background reactivity was considered present if cerebral electrical activity of at least 10 μV (regardless of frequency range) was observed and EEG background showed any clear and reproducible change in amplitude or frequency on simulation (auditory or painful), excluding “stimulus-induced rhythmic, periodic, or irritative discharges” (SIRPIDS)23or induction of muscle artifact alone. Stimulation and EEG background activity were assessed in all patients after at least 12 hours after the start of TH (that is, during the maintenance phase of TH) and within 24 hours from CA, still during TH. EEG background interrupted by flat periods lasting more than 10% of the
recording was labeled as “discontinuous”24 if this pattern was found over the whole recording. Spontaneous, repetitive or rhythmic, focal or generalized spikes, sharp waves, spike and waves, or rhythmic waves evolving in amplitude, frequency, or field were categorized as “epileptiform,” as detailed in our previous studies11, 25, 26. Of note, no patient presented isolated epileptiform transients. After reviewing the EEG separately, the two EEG certified neurologists established a consensus score.
Automatic analysis
In the current study, automatic processing of the data aimed at describing background activity and reactivity to auditory or nociceptive stimulation (reactive/not reactive). Background activity was automatically measured by computing the “burst suppression ratio” (BSR)18 and the
approximate entropy19on Fz, Cz and Pz. In the BSR, suppression intervals are defined as periods longer than 240 ms during which EEG voltage does not exceed 5μV18. BSR represents the ratio between the total suppression time and the total recording time. An EEG was coined suppressed if the ratio was greater than a chosen threshold.
Approximate entropy is a measure that quantifies the regularity or predictability of a time series. Approximate entropy has been applied to the analysis of EEG to measure depth of anesthesia20, 27 or to estimate sleep stage28, and was shown to correlate with BSR during anesthesia29.
Approximate entropy measures the logarithmic likelihood that runs of patterns that are close for
m contiguous observations remain close on subsequent comparisons between m+1contiguous
observations. Approximate entropy is a relative measure which depends on three parameters: the number of contiguous observations m, the length of the epoch N, and a distance measure r19, 30. In our analysis, we used m = 2 and 8 seconds epochs (N = 2000), based on theoretical
considerations19, 30 as well as previous studies20, 27. These studies also suggested to chose r = 0.1, 0.15, 0.2 or 0.25 times the standard deviation of the original data sequence. The present data had standard deviation ranging from 0.8 to 17.3 (mean = 5.5 ± 3.3). As comparisons between time series segments can only be made with the same values of m and r{Pincus, 2001 #2201}, and Bruhn and colleagues29 in a study on approximate entropy and burst suppression ratio suggested not to use a standard deviation below 7, we decided to take r = 0.2*7 for all data.
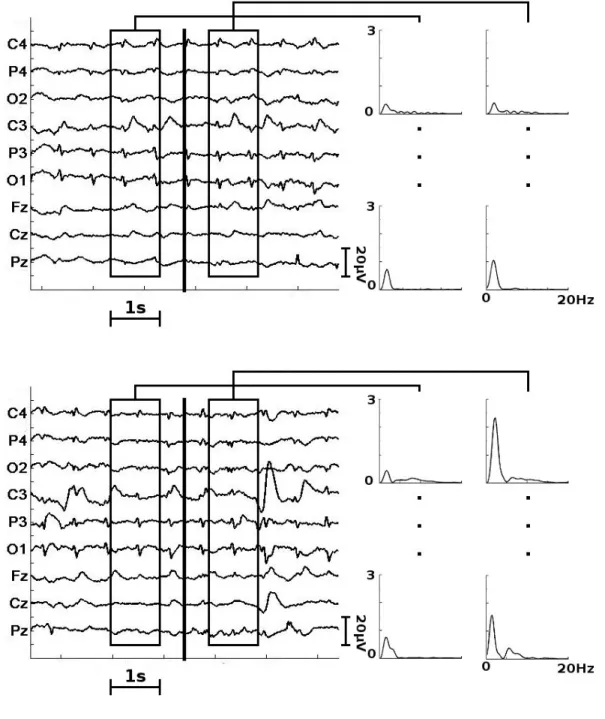
Reactivity to stimulation was computed as change in power at given frequencies between two one-second windows taken half a second before and after stimulation (Fig. 1). Data were high pass filtered above 1Hz before to be epoched. The Welch periodogram algorithm estimated the power spectrum of each one-second window. The frequencies of interest were selected as the peaks in the power spectrum. A peak has to be at least as high as 20% of the maximum value in the window to be recognized as a peak. A stimulation was considered reactive if (i) a peak detected at a given frequency was twice higher than same frequency of the other window31, and (ii) a peak was also present and twice higher on a chosen minimal number (see below) of other electrodes. The reactive frequency plus or minus 0.5 Hz was checked in other conditions. The frequency with most reactive conditions was kept. The final result was the ratio between the number of detected change and the total number of stimulations in a recording. To avoid false
positive results due to change in activity not related to stimulation, we removed from analysis the windows fulfilling one of the two following criteria. First, the number of detected peaks was greater than a maximum number (see below). This corresponds to the fact that no clear peak appears in these data. Second, the change in total power between pre and post windows was greater than a threshold (see below). High change of the whole spectrum was most probably due to pathological EEG patterns, such as epileptiform bursts on a suppressed background.
Comparison between automatic and EEG-certified neurologists
To compare the ratio of the automatic scoring with the binary EEG-certified neurologist scores, we fixed a threshold at 0.5. A recording was reactive if at least half of the stimulations were reactive. We computed the agreement between automatic detection of reactivity and the
reactivity given by the consensus score. We also computed the Cohen’s kappa coefficient, which take into account sensitivity, specificity and agreement occurring by chance.
The choice of parameters (minimum number of electrodes to name a condition reactive,
maximum number of peak in the power spectrum, threshold on the total power) had an influence on the final results: with strict parameters, we may reject as noise reactive stimulations. On the other hand, with loose parameters, every artifact may induce false reactivity. Therefore,
parameters selection was done through an approach from machine learning, a 9-fold
cross-validation scheme. The 46 subjects were randomly distributed into 9 sets (8 sets of 5 subjects and one of 6 subjects). We then repetitively performed an exhaustive search for best parameters on 8 sets and applied these parameters to the remaining set. Each patient was then used once as a test subject with parameters independently selected. We repeated this procedure 5 times with
different folds and averaged the final results. During exhaustive search, we optimized the Cohen’s kappa coefficient between automatic measure and consensus score.
Third reviewer
The EEG was further reviewed by a separate third EEG neurologist from Liège which did not have access to patients’ medical information. This third reviewing was intended as a comparison with the automatic score in similar condition (only short EEG segment). We computed the agreement and Cohen’s kappa coefficient between the score from the third neurologist and the clinical consensus score of the CHUV neurologists.
Results
The clinical characteristics of the 46 patients are summarized in Table 1. At 3 months, 25 of the 26 patients who left alive the hospital were assessed: 21 had a CPC of 1 or 2 (good outcome), while 3 had a CPC of 3 and one patient died; one patient was missed. The remaining patients died in hospital. Of note, no patient remained in vegetative state. Visually, the CHUV
non-reactive EEG background in hypothermia, while corresponding proportions for a discontinuous background were 4/21 and 23/24.
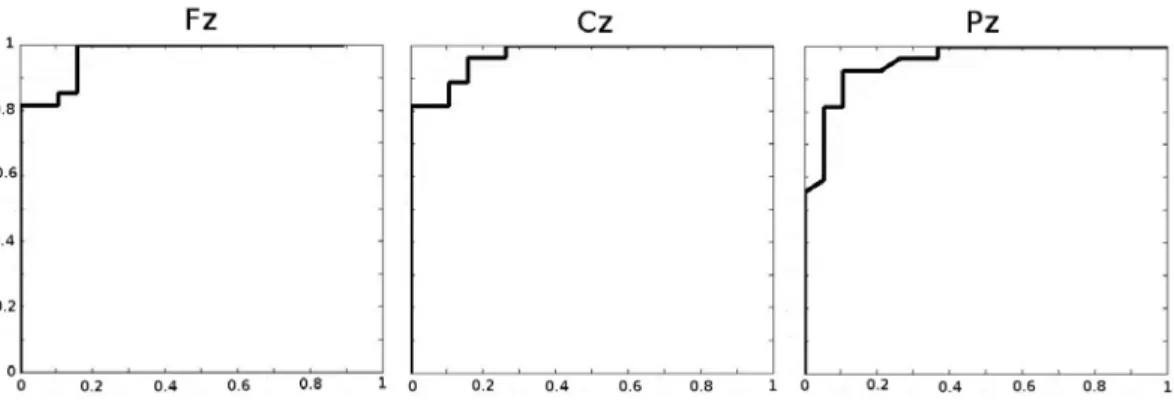
Quantitative results were compared to the consensus score of the two CHUV neurologists. The ROC curves of agreement between automatic and consensus score of background activity are presented in figure 2. Automatic analysis of background activity on Fz yielded 93.5%
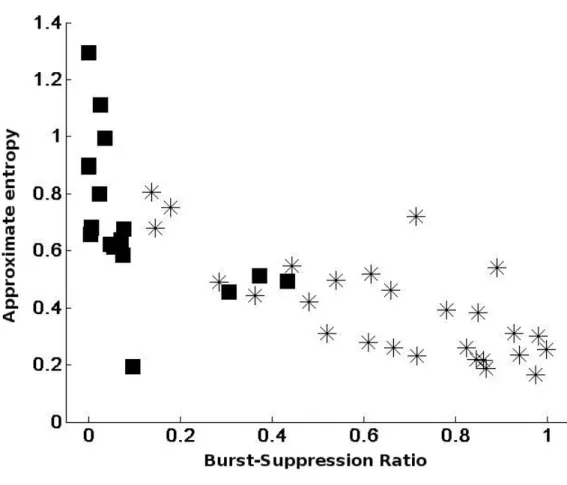
correspondence with the background activity of the consensus score (kappa 0.86; almost perfect agreement) with a threshold of 0.12. Similar agreements were obtained for Cz and Pz (89.1% for Cz, and 91.3% for Pz). Approximate entropy negatively correlated with BSR (r = -0.76, -0.77, and -0.78 for Fz, Cz and Pz respectively, p<0.001) (Fig. 3). The correspondence between consensus score and approximate entropy was lower than for BSR on all electrodes. The computation of approximate entropy on Fz yielded 82.6% correspondence with background activity of consensus score (kappa score 0.64) with a threshold of 0.55.
The automatic procedure for reactivity had 79±2% (kappa = 0.71±0.01) agreement (substantial) with the consensus score (Fig. 1). One combination of parameters was selected the majority of the time. In that combination, the minimum number of electrodes to name a condition reactive was 6, the maximum accepted number of peak in the power spectrum was 4, and the threshold on the total power was a ratio of maximum 5 between the total power before and after the stimulus. Other combinations were slight variations of the favored combination.
Six subjects were presented as reactive in the 5 cross-validations while the clinical assessment diagnosed them as non-reactive. One subject was automatically diagnosed as non-reactive while the clinically they were considered as reactive. One more subject was automatically diagnosed as non-reactive four times out of five. A few other subjects were selected as reactive or non-reactive once or twice while consensus clinical score had the opposite diagnosis.
The association between outcome and EEG findings from the consensus score and the automatic score during TH is shown in Table 2. Nonreactive EEG background and discontinuous EEG background were strongly associated with poor outcome by both consensus and automatic
scores. Continuous EEG background was associated with a good outcome. The average BSR was significantly lower in the good outcome group than in the poor outcome group for all electrodes (permutation test, 10000 permutations) (Table 3). The approximate entropy values were
significantly higher in the good outcome group than in the poor outcome group (permutation test, 10000 permutations) (Table 3).
The third physician score achieved a 91.3% agreement on the background activity (kappa score = 0.83) with the consensus score and a 78.3% agreement on the reactivity (kappa score = 0.53). Discussion
In the present study, automatic analysis of background activity and reactivity in patients in TH following cardiac arrest provided results almost perfect agreement with the visual inspection of certified EEG neurologists regarding discontinuity, and substantial agreement regarding EEG reactivity; agreements were comparable to the observed inter-rater agreement among clinicians. The automatic scoring was also a good predictor of outcome.
Clinical EEG analysis in the intensive care unit is mostly based on visual inspection of the raw signal to detect background patterns, epileptical activities and reactivity. This approach is time consuming and requires extensive training31. Quantitative EEG analysis can provide
complementary information and improve generalizability.
Reactivity is defined as change in cerebral EEG activity in response to stimulation24, however, formal guidelines do not exist. Lack of reactivity is related to poor neurologic recovery4, 5. In patients with postanoxic coma, nonreactive EEG background activity during or after TH is an early predictor of poor outcome2, 6. Previous automatic detection of reactivity was limited to data from patients investigated for epilepsy and the detection of attenuation of the alpha band over the occipital region between an idle and an eye-open state31. The present approach is wider,
investigating more type of stimulations, more frequency bands and more electrodes. The proposed automatic approach to detect reactivity was in good agreement with the consensus scores. However, seven patients obtained an automatic score different from the consensus score. The automatic approach did not detect any reproducible change while the consensus score detected reactivity in the theta band in one patient. This patient had a good outcome. In six patients, the automatic score found reactive patterns but not the consensus score: two patients presented a high-voltage burst-suppression just before or after stimulations, two had a slight increase in delta activity following stimulations; and another patient had epileptiform activity. All these patients died. One last patient, presented changes in delta activity in half of the stimulations: despite being scored as non-reactive by the consensus score, he had a good outcome.
The proposed approach scored each stimulation individually before testing the inter-stimulation reproducibility. If reproducibility is important, ideally it should be compared among stimulations of same intensity. A patient may not respond to auditory stimuli but to pain, in which case the neurologist will classify the EEG as reactive while the automatic scoring will consider that only one third of the stimulations are reactive. This scenario was not present in our data, but it illustrates the difficulty to reduce a classification for each stimulation to a binary score for the whole recording. Furthermore, the number of stimulations varied from one subject to the next, and the response to previous stimulations as well as other clinical factors may influence the decision to continue or stop the test. To enable the comparison between automatic scores and consensus scores, we set an arbitrary threshold at 0.5. Half of the stimulations had to be reactive in order to score a recording reactive. In future developments, an individual score should be
given for each stimulation as well as group of stimulations, which could reflect the intensity of the reaction.
BSR and entropy measures have been developed for anesthesia before to be applied to comatose patients15, 32. The BSR and entropy characteristics have significantly different values in good outcome and poor outcome group15 as confirmed in the present study. Discontinuous EEG background is strongly associated with poor outcome6, 11, 14, although (in clinical EEG interpretation) it is less robust that lack of background reactivity. Furthermore, we tested the agreement between automatic and physician score. A high (respectively low) BSR was an unequivocal sign of discontinuous (respectively diffuse continuous) background. Patients with in-between values (from 0.1 to 0.5 for frontal lead) should be further inspected by EEG certified neurologists to disentangle discontinuous background from other patterns. The consensus score differed from the score of the third physician for 3 of the 10 patients in this “grey zone”. Three more patients had a burst suppression ratio above the threshold while both physicians classified their EEG as continuous. Indeed, on visual inspection these patients had an EEG with very low power but no sign of discontinuity. One of these three patients deceased after leaving the hospital while the other two had a good outcome. One patient suffered from epilepsy which increased his BSR. The remaining three patients were scored identically by physicians and BSR.
Approximate entropy was shown to be negatively correlated with the BSR but less sensitive than BSR in regards to consensus score. The negative correlation is in accordance with results from anesthetized subjects where approximate entropy was inversely related to BSR (r=-0.94)27. Approximate entropy measures the complexity of the signal and has been shown to correlate with the level of anesthesia20, 27, 29 or sleep{Burioka, 2005 #2196}. EEG entropy was shown to correlate with the coma-recovery scale in an acute setting32. Further studies are needed to see if approximate entropy may be more suited to follow longitudinally a given patient, or rather to disentangle background patterns or rhythms.
Automatic scoring is sensitive to epileptiform activity, muscle activity as well as other artifacts. One patient had generalized periodic discharges with a suppressed background and no sign of reactivity according to the three neurologists. Both BSR and approximate entropy could not detect the suppressed state which should have resulted in a high BSR and low approximate entropy. Instead, the BSR was at the border with continuous background and the entropy was in the middle range. Furthermore, the subject was scored reactive. The present approach was not developed to detect epileptiform activity as only two recordings in our cohort presented epileptical activity. Of note, approaches based on wavelet entropy15 or amplitude-integrated EEG16 have been proposed to automatically detect epilepsy in comatose patients.
Quantitative EEG provides results in accordance with trained physicians scoring, but the correlation is not absolute. Pending confirmation in a larger dataset and the identification of
reliable thresholds (especially for entropy), we propose that this quantitative EEG analysis might contribute to improve the generalization of EEG interpretation in this clinical setting, and
Bibliography
1. Friedman D, Claassen J, Hirsch LJ. Continuous electroencephalogram monitoring in the intensive care unit. Anesth Analg 2009; 109: 506-23.
2. Rossetti AO, Urbano LA, Delodder F, Kaplan PW, Oddo M. Prognostic value of continuous EEG monitoring during therapeutic hypothermia after cardiac arrest. Crit
Care 2010; 14: R173.
3. Lehembre R, Gosseries O, Lugo Z, Jedidi Z, Chatelle C, Sadzot B et al.
Electrophysiological investigations of brain function in coma, vegetative and minimally conscious patients. Arch Ital Biol 2012; 150: 122-39.
4. Gutling E, Gonser A, Imhof HG, Landis T. EEG reactivity in the prognosis of severe head injury. Neurology 1995; 45: 915-8.
5. Logi F, Pasqualetti P, Tomaiuolo F. Predict recovery of consciousness in post-acute severe brain injury: the role of EEG reactivity. Brain Inj 2011; 25: 972-9.
6. Rossetti AO, Oddo M. The neuro-ICU patient and electroencephalography paroxysms: if and when to treat. Curr Opin Crit Care 2010; 16: 105-9.
7. Gerber PA, Chapman KE, Chung SS, Drees C, Maganti RK, Ng YT et al. Interobserver agreement in the interpretation of EEG patterns in critically ill adults. J Clin
Neurophysiol 2008; 25: 241-9.
8. Abend NS, Gutierrez-Colina A, Zhao H, Guo R, Marsh E, Clancy RR et al. Interobserver reproducibility of electroencephalogram interpretation in critically ill children. J Clin
Neurophysiol 2011; 28: 15-9.
9. Thatcher RW. Validity and Reliability of Quantitative Electroencephalography. Journal
of Neurotherapy: Investigations in Neuromodulation, Neurofeedback and Applied Neuroscience 2010; 14: 122-52.
10. Thenayan EA, Savard M, Sharpe MD, Norton L, Young B. Electroencephalogram for prognosis after cardiac arrest. J Crit Care 2010; 25: 300-4.
11. Rossetti AO, Oddo M, Logroscino G, Kaplan PW. Prognostication after cardiac arrest and hypothermia: a prospective study. Ann Neurol 2010; 67: 301-7.
12. Fugate JE, Wijdicks EF, Mandrekar J, Claassen DO, Manno EM, White RD et al. Predictors of neurologic outcome in hypothermia after cardiac arrest. Ann Neurol 2010; 68: 907-14.
13. Crepeau AZ, Rabinstein AA, Fugate JE, Mandrekar J, Wijdicks EF, White RD et al. Continuous EEG in therapeutic hypothermia after cardiac arrest: prognostic and clinical value. Neurology 2013; 80: 339-44.
14. Rossetti AO, Carrera E, Oddo M. Early EEG correlates of neuronal injury after brain anoxia. Neurology 2012; 78: 796-802.
15. Wennervirta JE, Ermes MJ, Tiainen SM, Salmi TK, Hynninen MS, Sarkela MO et al. Hypothermia-treated cardiac arrest patients with good neurological outcome differ early in quantitative variables of EEG suppression and epileptiform activity. Crit Care Med 2009; 37: 2427-35.
16. Rundgren M, Rosen I, Friberg H. Amplitude-integrated EEG (aEEG) predicts outcome after cardiac arrest and induced hypothermia. Intensive Care Med 2006; 32: 836-42. 17. Rundgren M, Westhall E, Cronberg T, Rosen I, Friberg H. Continuous
amplitude-integrated electroencephalogram predicts outcome in hypothermia-treated cardiac arrest patients. Crit Care Med 2010; 38: 1838-44.
18. Rampil IJ, Weiskopf RB, Brown JG, Eger EI, 2nd, Johnson BH, Holmes MA et al. I653 and isoflurane produce similar dose-related changes in the electroencephalogram of pigs.
Anesthesiology 1988; 69: 298-302.
19. Pincus SM. Approximate entropy as a measure of system complexity. Proc Natl Acad Sci
U S A 1991; 88: 2297-301.
20. Bruhn J, Ropcke H, Hoeft A. Approximate entropy as an electroencephalographic measure of anesthetic drug effect during desflurane anesthesia. Anesthesiology 2000; 92: 715-26.
21. Oddo M, Ribordy V, Feihl F, Rossetti AO, Schaller MD, Chiolero R et al. Early predictors of outcome in comatose survivors of ventricular fibrillation and
non-ventricular fibrillation cardiac arrest treated with hypothermia: a prospective study. Crit
Care Med 2008; 36: 2296-301.
22. Booth CM, Boone RH, Tomlinson G, Detsky AS. Is this patient dead, vegetative, or severely neurologically impaired? Assessing outcome for comatose survivors of cardiac arrest. JAMA 2004; 291: 870-9.
23. Alvarez V, Oddo M, Rossetti AO. Stimulus-induced rhythmic, periodic or ictal discharges (SIRPIDs) in comatose survivors of cardiac arrest: characteristics and prognostic value. Clin Neurophysiol 2013; 124: 204-8.
24. Hirsch LJ, LaRoche SM, Gaspard N, Gerard E, Svoronos A, Herman ST et al. American Clinical Neurophysiology Society's Standardized Critical Care EEG Terminology: 2012 version. J Clin Neurophysiol 2013; 30: 1-27.
25. Rossetti AO, Logroscino G, Liaudet L, Ruffieux C, Ribordy V, Schaller MD et al. Status epilepticus: an independent outcome predictor after cerebral anoxia. Neurology 2007; 69: 255-60.
26. Rossetti AO, Oddo M, Liaudet L, Kaplan PW. Predictors of awakening from postanoxic status epilepticus after therapeutic hypothermia. Neurology 2009; 72: 744-9.
27. Bruhn J, Ropcke H, Rehberg B, Bouillon T, Hoeft A. Electroencephalogram approximate entropy correctly classifies the occurrence of burst suppression pattern as increasing anesthetic drug effect. Anesthesiology 2000; 93: 981-5.
28. Burioka N, Miyata M, Cornelissen G, Halberg F, Takeshima T, Kaplan DT et al. Approximate entropy in the electroencephalogram during wake and sleep. Clin EEG
Neurosci 2005; 36: 21-4.
29. Bruhn J, Bouillon TW, Shafer SL. Bispectral index (BIS) and burst suppression: revealing a part of the BIS algorithm. J Clin Monit Comput 2000; 16: 593-6. 30. Pincus SM, Gladstone IM, Ehrenkranz RA. A regularity statistic for medical data
analysis. Journal of clinical monitoring 1991; 7: 335-45.
31. Lodder SS, van Putten MJ. Quantification of the adult EEG background pattern. Clin
Neurophysiol 2013; 124: 228-37.
32. Gosseries O, Schnakers C, Ledoux D, Vanhaudenhuyse A, Bruno MA, Demertzi A et al. Automated EEG entropy measurements in coma, vegetative state/unresponsive
Table 1: clinical characteristics of the studied patients Good outcome (21 patients) Poor outcome (24 patients)
Age (years, mean ±SD) 60.1 ± 11.2 63.1 ± 12.4
Female gender 4 5
Ventricular fibrillation 14 14
Time to return of spontaneous circulation (minutes, mean ±SD) 18.8 (13.0) 21.5 (10.4) Mean delay from cardiac arrest to EEG recording of stimulations
during hypothermia (hours, mean ±SD)
17.4 (6.5) 20.0 (5.8)
Hypotermic EEG epileptiform 0 5
Bilaterally absent somtosensory evoked potentials 0/21 9/23 Cerebral performance categories at 3 months (median, range) 1 (1-2) 5 (3-5)
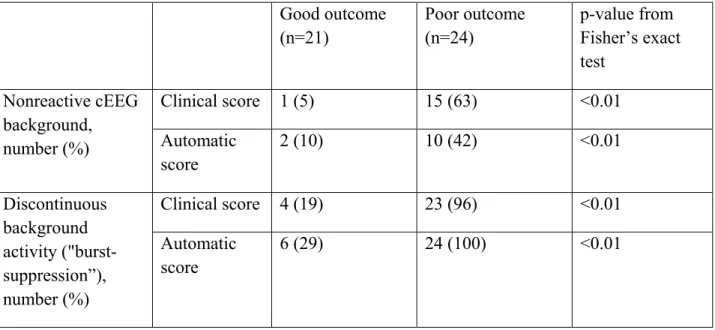
Table 2. Automatic score in good outcome and poor outcome groups Good outcome (n=21) Poor outcome (n=24) p-value from Fisher’s exact test Nonreactive cEEG background, number (%) Clinical score 1 (5) 15 (63) <0.01 Automatic score 2 (10) 10 (42) <0.01 Discontinuous background activity ("burst-suppression”), number (%) Clinical score 4 (19) 23 (96) <0.01 Automatic score 6 (29) 24 (100) <0.01
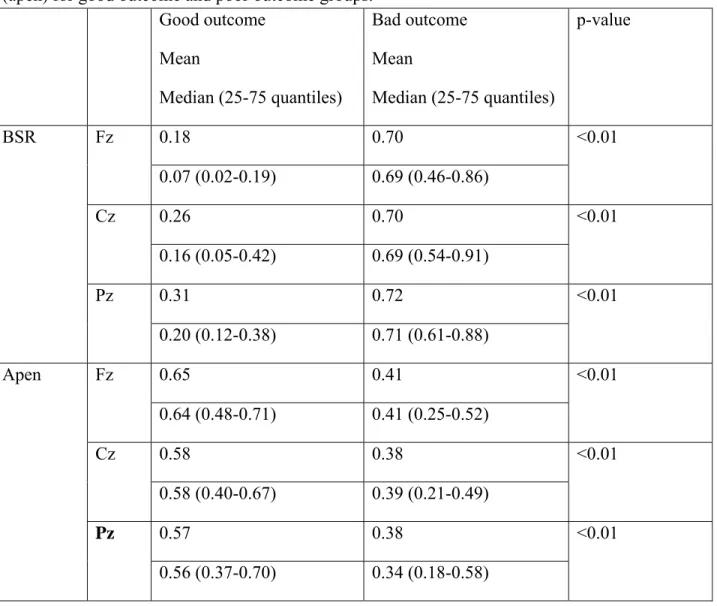
Table 3. Average and median values of burst suppression ratio (BSR) and approximate entropy (apen) for good outcome and poor outcome groups.
Good outcome Mean Median (25-75 quantiles) Bad outcome Mean Median (25-75 quantiles) p-value BSR Fz 0.18 0.70 <0.01 0.07 (0.02-0.19) 0.69 (0.46-0.86) Cz 0.26 0.70 <0.01 0.16 (0.05-0.42) 0.69 (0.54-0.91) Pz 0.31 0.72 <0.01 0.20 (0.12-0.38) 0.71 (0.61-0.88) Apen Fz 0.65 0.41 <0.01 0.64 (0.48-0.71) 0.41 (0.25-0.52) Cz 0.58 0.38 <0.01 0.58 (0.40-0.67) 0.39 (0.21-0.49) Pz 0.57 0.38 <0.01 0.56 (0.37-0.70) 0.34 (0.18-0.58)
Figure 1. Computation of reactivity. Left, a subset of the original EEG. The black vertical line indicates the stimulation. The two one-second windows are taken half a second before and after stimulation. Right, the power spectrum decomposition of the one-second windows before and after stimulation. One electrode by row. First figure, a stimulation where no change is detected, neither by the physicians, nor by the automatic scoring. Second figure, a stimulation which is considered as reactive by the automatic scoring (increased low frequency) and as non-reactive by the physicians. Third figure, a stimulation inducing a decrease of low frequency as detected by physicians and automatic scoring.
Figure 2. ROC curves of burst-suppression ratio and physicians’ EEG continuity scores for electrodes Fz, Cz and Pz
Figure 3. Correlation between burst-suppression ratio and approximate entropy for Fz. Squares correspond to patients with continuous background following the clinical EEG interpretation. Stars correspond to patients with discontinuous background following the consensus diagnosis.