HAL Id: hal-01290055
https://hal-mines-paristech.archives-ouvertes.fr/hal-01290055
Submitted on 17 Mar 2016
HAL is a multi-disciplinary open access
archive for the deposit and dissemination of
sci-entific research documents, whether they are
pub-lished or not. The documents may come from
teaching and research institutions in France or
abroad, or from public or private research centers.
L’archive ouverte pluridisciplinaire HAL, est
destinée au dépôt et à la diffusion de documents
scientifiques de niveau recherche, publiés ou non,
émanant des établissements d’enseignement et de
recherche français ou étrangers, des laboratoires
publics ou privés.
Energy sector contribution to regional climate action:
The case of Latin America
Sébastien Postic, Sandrine Selosse, Nadia Maïzi
To cite this version:
Sébastien Postic, Sandrine Selosse, Nadia Maïzi. Energy sector contribution to regional climate
ac-tion: The case of Latin America. [Research Report] Working Paper 2016-01-20, Chaire Modélisation
prospective au service du développement durable. 2016, pp.24 - Les Cahiers de la Chaire.
�hal-01290055�
cahi
e
rs
chaire
de la
chaire mod
élisation prospective au service du d
éveloppement durable
Energy sector contribution to regional
climate action:
The case of Latin America
Sebastien Postic, Sandrine Selosse, Nadia Maïzi
MINES ParisTech - PSL Research University
Centre for Applied Mathematics (CMA), France
W
Working Paper
N°2016-02-20
«
www.modelisation-prospective.org
W
Working Paper N°2016-02-20conte
n
ts
I
II
III
IV
V
Introduction
Methods and scenarios
2-1/ The T-ALyC model
2-2/ GHG emissions and storage in T-ALyC 2-3/ Climate scenarios
Results and discussion: impact of climate pledges on the
energy sector
3-1/ Impacts of climate pledges on electricity
3-2/ Impacts of climate pledges on primary energy consumption
3-2-1/ The relevance of oil exports
3-2-2/ Brazilian pledges drive regional decarbonization 3-2-3/ Sectorial targets: limited impact on energy
3-3/ Non-energy emissions
Conclusion and policy implications
Acknowledgements
3
www.cma.fr
climate action:
The case of Latin America
Sebastien Postic
1, Sandrine Selosse, Nadia Maïzi
MINES ParisTech - PSL Research University Centre for Applied Mathematics (CMA), France
W
Working Paper N°2016-02-20The most optimistic Representative Concentration Path-way (RCP 2.6) in the fifth IPCC Assessment Report pre-dicts a 0.3°C to 1.7°C global mean temperature change in 2100, putting natural species and systems at risk, possibly triggering large-scale irreversible natural dam-age, and strongly impacting human activities (IPCC, 2014). In South America and the Caribbean, a region representing a relevant share of global GHG emissions with a weight of 7.7% in 2011 (World Resources Insti-tute, 2015), slightly more than its share of the world’s population (6.9% in 2010), the latest estimates point to a 1.5% to 5% GDP loss by 2050 (Samaniego et al., 2014). Particularly, Brazil already ranks fourth in the world when it comes to national contributions to global warming (Matthews et al., 2014) and a strong increase in GHG emissions can be anticipated in the years to come throughout the region on a BAU basis (Carvallo et al., 2014; Fundación Bariloche, 2008; van Ruijven et al., 2015). In this context, quite logically, the region has a relevant role to play in mitigating global emissions. No South American countries are included in Annex I of the United Nations Framework Convention on Climate Change (UNFCCC) and as such, before the Paris Agree-ment on climate change signed in December 2015 in Paris during the COP 21, they were not bound to any GHG quantified emission reduction. They had, however, been invited to voluntarily commit to Nationally Appro-priate Mitigation Actions (NAMAs). Part of the Copen-hagen Accord, NAMAs provide a flexible framework within which non-Annex I countries can pledge voluntary actions at an economy-wide or sectorial level, aimed at deviating from BAU emissions (Sharma and Desgain, 2014). The nature, quantification and implementation roadmap1of these NAMAs vary considerably across
South America.
Chile has pledged emission reductions of 20% by •
2020, compared to a 2009 Business-As-Usual sce-nario (BAU); there is no quantified measure in its en-gagement letter concerning how this target will be met, and little description. Energy efficiency, renew-able energies and AFOLU (Agriculture, Forestry and Other Land-Use) are specified as the main action sectors for these reductions. Brazil has based most of its pledge on quantified •
emission reductions in the field of deforestation and more generally the AFOLU sector. These sectorial reductions have been aggregated into an estimated national target of 36.6% to 38.9% emission reduc-tions below a national baseline by 2020. Colombia has committed to 77% renewables in its •
installed electricity production capacity by 2020, and 20% biofuels in overall fuel consumption. Peru has pledged a 0% net deforestation rate by •
2021, as well as a minimum of 33% renewable en-ergy in all enen-ergy consumed in the country, and non-quantified measures for waste emissions reduction. The country has not quantified the overall impact of these pledges, but independent academics esti-mate that the measures should lead to a 41% GHG reduction compared to BAU (Hof et al., 2013).
Corresponding author:
MINES ParisTech, PSL University, CMA-Centre for Applied Mathematics, 1 For an exhaustive compilation of theses pledges, see (UNFCCC, 2013)
www.modelisation-prospective.org
W
W
Working Paper N°2016-02-20With the exception of small countries such as Antigua and Barbuda, the rest of the continent has so far made no pledges to the UNFCCC. However, national communications emphasize national measures and strategies in:
Argentina: energy efficiency programs, renewable energy including biofuels and hydrogen, forest management, •
solid waste management; Ecuador: by 2020, •
82% of oil in primary energy, down from 92% in 2011 At least 90% renewable electricity, 80% from hydropower
Uruguay: the National Plan to 2015 aims at over 15% electricity from unconventional renewable sources •
Paraguay: the country has set reforestation targets and expressed its intention to expand energy-crop cultures. •
This list is far from exhaustive for national targets and measures that are not bound to the UNFCCC.
The energy sector, the largest contributor to GHG emission, shows promising potential to achieve climate mitigation worldwide (Akimoto et al., 2010) and South American NAMAs consider it extensively. However, the potential of the South American energy sector may remain below world averages (Bassi and Baer, 2009; Borba et al., 2012; Di Sbroiavacca et al., 2015), because of an already-renewable energy mix, fast energy growth –the electrification rate jumped from 75% in 2009 to around 90% in 2012 in Peru and Bolivia (CIER, 2013, 2011) – and the use of energy as a tool for domestic and international policy (Colgan, 2014).
Given Latin America’s regional specificities, what contributions can its energy sector make to the fight against climate change, and at what cost? This paper investigates this specific aspect of the energy-climate nexus in Latin America through the prism of ongoing climate negotiations. This analysis focuses on the climate commitment of Latin America pledged before the Intended Nationally Determined Contributions (INDCs) asked to publish through the 2015 United Nations Climate Change Conference held in Paris in December and which led to the signing of a historical global agreement on climate change. We use a bottom-up energy prospective model from the MarkAl/TIMES family with four contrasted scenarios for future climate policies in South America, presented in section 2. In section 3, we study the energy sector’s contribution to meeting regional climate pledges and the evolutions that such a contribution im-plies. We start by considering the specific case of the power mix then expand our study to the whole total primary energy supply, underlining the role of Brazil and Chile in driving the energy transition in South America. We also con-sider the efficiency and impact of Peru and Colombia’s national commitments and the links between the AFOLU sec-tor, the energy sector and the fight against climate change in Latin America.
The results presented and discussed in this paper are based on the T-ALyC model. T-ALyC, standing for TIMES para América Latina y el Caribe, (TIMES for Latin Amer-ica and the Caribbean), is a multiregional model based on the TIMES paradigm for long-term energy prospec-tive. This modeling approach developed under IEA’s En-ergy Technology Systems Analysis Program (IEA-ETSAP) Agreement considers a bottom-up representation of the energy system and relies on linear optimization tech-niques to meet an exogenous energy service demand at the lowest possible discounted cost, over a given time horizon (typically 2010-2050). The energy system is ex-plicitly represented through a few thousand energy processes and commodities and their individual features (efficiency, investment costs, O&M costs, emission fac-tors, etc.). Demand satisfaction is subject to resource
constraints (resource availability, extraction cost), tech-nical constraints (physical balances, availability factors, process lifetimes, etc.) and non-technical constraints (market penetration limits, policy scenarios, environmen-tal specifications, etc.). For more information on the TIMES paradigm and its implementation, please refer to (Loulou et al., 2005). TIMES models minimize the cost of delivering a given energy service through both invest-ment in, and operation of, energy processes. The outputs of TIMES models are the evolution and final structure of the energy system, individual investment and operation costs for each modeled technology, process-related and fuel-related emissions, energy trade flows between model regions and with the rest of the world, and the marginal cost of political constraints such as emission pledges.
II - Methods and scenarios
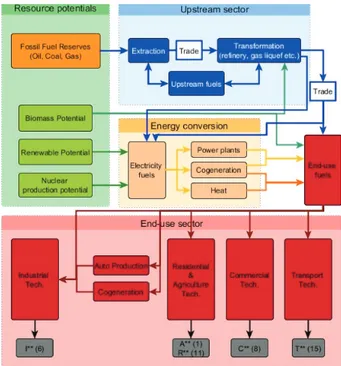
T-ALyC’s technological description is inherited from the TIMES Integrated Assessment Model TIAM, a 15-region representation of the whole world’s energy system, from resource extraction to end-use energy demands (Loulou and Labriet, 2008; Ricci and Selosse, 2013; Syri et al., 2008). The Reference Energy System is split into a mod-ule for fossil fuel extraction, a transformation modmod-ule from primary to refined fuels (including biomass trans-formation), an energy conversion module for electricity and heat production, and 5 end-use demand sectors, as shown in Figure 1.
Figure 1: Schematic description of T-ALyC’s RES
T-ALyC considers the entire Latin America and the Caribbean region, excluding Mexico (conforming with the current Central and South America region in TIAM). T-ALyC relies on an ad hoc disaggregation of the area into 10 sub-regions (cf. Table 1) to address region-spe-cific issues including the role of hydropower and inter-rogations about its future development, the current and future role of biofuels in the energy mix, challenges, op-portunities and time dynamics of regional integration and the climate change-energy nexus. T-ALyC thus em-phasizes in its geographical structure the main geo-en-ergy trends of the continent, which include among others the weight and diversity of Brazil, the strategic interconnecting role of Bolivia, Paraguay, Uruguay and Central America, and the diverging paths of Chile and Argentina. The base year for model projections is 2010 and the end horizon is 2050. This time span is divided into 6 time periods, then 6 representative time slices in each period (three seasons: Winter, Summer, Intermedi-ate; two diurnal divisions: Day, Night).
Region name Region description
AND Peru, Ecuador
ARG Argentina
BPU Bolivia, Paraguay, Uruguay
BSE Brazil – South and Southeast administrative regions BWC Brazil – North, Northeast and Center administrative regions
CHL Chile
COL Colombia
CYC Central America and the Caribbean SUG Suriname, Guyana, French Guyana
VEN Venezuela
Table 1: T-ALyC geographical disaggregation
Energy potentials and end-use demands are calibrated based on a wide variety of sources, including (ALACER, 2013; Gar-cés et al., 2012; Global Energy Observatory, 2013; Hoornweg and Bhada-Tata, 2012; IEA, 2014; IER, 2006; IMF, 2014; Riegelhaupt and Chalico, 2009; Smeets et al., 2007; UN-DESA, 2012; UNEP, 2012; US-EIA, 2014; World Nuclear Association, 2008) and na-tional sources. For this study, prices for energy commodity trade with the rest of the world are based on TIAM endoge-nous trade prices for the Cen-tral and South America region.
www.modelisation-prospective.org
W
Working PaperN°2016-02-20
2-2 - GHG emissions and storage in T-ALyC
The emission structure in South America is quite different from the rest of the world. Brazil’s national emission inventory reports GHG emissions from the energy sector that amount to only 15% of total national emissions (Brazilian Ministry of Science and Technology, 2010). By comparison, energy emissions for the European Union at the same date accounted for 80% of total emissions2 (European
Commission, 2014). This is mainly due to AFOLU: while in 2005 the Land-use, Land Use Change and Forestry sector in Europe was a net sink at 281 Mt CO2eq, the same sector in Brazil contributed up to 1,329 Mt CO2eq to national emissions. AFOLU emissions are thus not explicitly energy-related, yet they can impact the energy system through climate pledges. Faced with an emission-reduction objec-tive, planners could choose to spend the money either on emission reductions in the
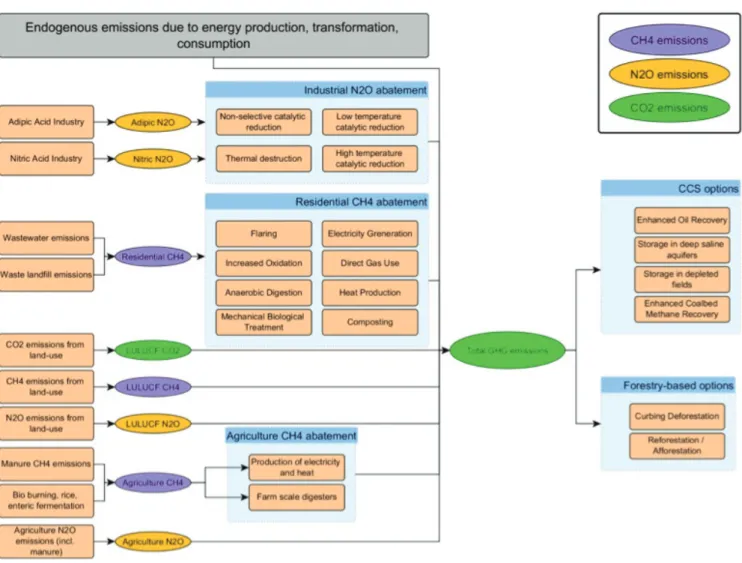
energy-pro-duction sector, or on dedicated non-energy meas-ures in e.g. the AFOLU or waste sectors. In the case of waste-linked emissions, emission reduc-tions can even lead to energy production if landfill gases are retrieved and used for electricity gener-ation. Available options in AFOLU include curbing deforestation, reforestation measures (re-establish-ment of a forest depleted by deforestation) and af-forestation (creation of new forest areas). See (Smith et al., 2014) for a complete description of AFOLU’s stakes in relation to global warming. Such emissions are taken into account in our model through dedicated emission technologies, with an exogenous calibration based on national communications to the UNFCCC. Figure 2 below summarizes these contributions.
2 Excluding AFOLU which is actually a sink rather than a source of CO2 emissions in Europe
While some emission reduction potentials are directly linked to the amount of emissions (e.g. thermal de-struction of N2O emissions from the Nitric Acid In-dustry, or the fight against deforestation), some potentials are only partially related to such emissions – e.g. reforestation – or totally unrelated – e.g. stor-age in deep aquifers. In the case of forestry-based options, the potentials and associated costs were calibrated on external sources such as (Asner et al., 2014; Brazilian Ministry of Science and Technology, 2010; Elberg Nielsen et al., 2014; Gonzalez Arenas et al., 2011; Ministerio de Ambiente de Colombia, 2012; Ministerio de Ambiente del Perú, 2010; Ministerio del Ambiente del Ecuador, 2012, 2011; Ministerio del Medio Ambiente de Chile, 2011; Ministerio del Medio Ambiente de Uruguay, 2010; Nepstad et al., 2009; Secretaria de Ambiente de la República Argentina, 2007; Secretaria de Ambiente del Paraguay, 2011;
Smith et al., 2014; Viceministerio del Medio Ambiente de Bolivia, 2009). We separate measures related to the fight against deforestation, calibrated on national baseline projections for deforestation, from afforesta-tion-related measures, whose potential is linked to the available surface area. This area depends on the amount of forest-free land, and on the competition between afforestation and agriculture or other pro-ductive activities.
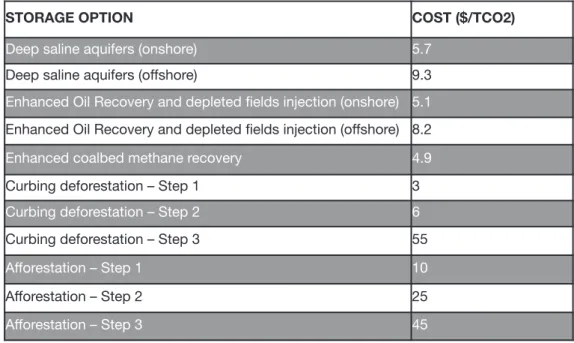
For all other options, we used TIAM costs and po-tentials (Ricci and Selosse, 2013) and regionalized the latter based on the T-ALyC regions’ extraction potentials and surface areas. The potentials and costs of carbon storage technologies are detailed in Table 2 and Table 3 respectively. CCS option costs include transportation.
STORAGE OPTION AND ARG BPU BSE BWC CHL COL CYC SUG VEN
Enhanced Oil Recovery 1,629 2,863 1,732 1,593 7,258 778 1,087 762 369 928
Storage in depleted fields 5,341 9,389 5,680 5,224 23,798 2,552 3,564 2,498 1,211 3,044
Enhanced coalbed meth. recov. 171 301 182 168 764 82 114 80 39 98
Deep saline aquifers 2,598 4,566 2,763 2,541 11,574 1,241 1,733 1,215 589 1,480
Curbing deforestation 15,506 1 4,905 1,272 12,053 0 3,764 0 0 0
Afforestation/reforestation 3,299 1,561 756 572 5,424 229 1,258 0 0
Table 2: Cumulative storage capacity (2010-2050) for T-ALyC carbon storage options (MtCO2)
STORAGE OPTION COST ($/TCO2)
Deep saline aquifers (onshore) 5.7 Deep saline aquifers (offshore) 9.3 Enhanced Oil Recovery and depleted fields injection (onshore) 5.1 Enhanced Oil Recovery and depleted fields injection (offshore) 8.2 Enhanced coalbed methane recovery 4.9 Curbing deforestation – Step 1 3 Curbing deforestation – Step 2 6 Curbing deforestation – Step 3 55 Afforestation – Step 1 10 Afforestation – Step 2 25 Afforestation – Step 3 45
www.modelisation-prospective.org
W
Working PaperN°2016-02-20
2-2 - Climate scenarios
We investigate the impact of climate negotiations on the South American energy sector through 4 scenarios, namely “Business-As-Usual” (BAU), “Brazil and Chile only” (BraChi), “All Nationally Adapted Mitigation
Ac-tions” (NAMAs) and “Quantified reductions for all” (Red4All).
The Business-As-Usual scenario considers that no climate pledge is taken by any country. It allows us to present the key energy determinants of the continent, and serves as a comparison point for our climate pledge scenarios. We also use it to set the targets for climate scenarios, when such targets are defined as a reduction below a national emission baseline.
Brazil and Chile only is the least stringent climate scenario, considering only quantified reduction pledges
for Brazil and Chile. For Brazil, our target is less stringent than that pledged in 2010, since the original ob-jective was based on national BAU projections. We did not have access to this BAU, but the fight against deforestation improved dramatically between 2005 and 2010, so we can assume that part of the objective has already been met (emissions in 2010 and after in our own BAU are calibrated based on updated national inventories and are already much lower than in 2005). Also, Brazil’s constraint is written as an overall cap for the joint emissions of the two-region Brazil, meaning that the choice of where to reduce emissions is left to the model. Both Brazil and Chile’s targets are extrapolated to a 40% reduction below BAU in 2050.
All Nationally Adapted Mitigation Actions considers that UNFCCC pledges as described in the Introduction
are implemented in Brazil, Chile, Colombia and Peru, plus a 30% deforestation reduction in Ecuador. Unlike for Brazil and Chile, the pledges for Colombia, Peru and Ecuador do not become stronger between 2020 and 2050. National voluntary policies that have not led to an NAMA pledge to the UNFCCC were not in-cluded in our modeling hypotheses.
Last, in Quantified Reductions for all, we consider that all countries make Chilean-like pledges on their future emissions. The only exceptions are Venezuela, Suriname, and Guyana. We consider that Venezuela would not adhere to any international agreements on climate3and the data we have on Suriname and
Guyana is too poor to make any valuable projection concerning climate commitments. These assumptions are summarized in Table 4.
Region 2020 targets 2050 targets
BAU BraChi NAMAs Red4All BAU BraChi NAMas Red4All
AND ARG BPU BSE BWC CHL COL CYC SUG VEN
-
-
NAMAs -20%-
-
- -20%-
-
---
-
---
-
---
-
---
-
- -20%-
-
- -20%-
-25% -25% -25%-
-25% -25% -25%-
-20% -20% -20%-
-40% -40% -40%-
-40% -40% -40%-
-40% -40% -40%-
- NAMAs -20%-
- NAMAs -40%-
-
- -40%-
-
- -40%-
-
NAMAs -40%-
-
- -40%Table 4: Scenario assumptions for regional emission targets
3 Venezuela’s current strong opposition to the US, as well as the fact that the country uses oil as a power tool for its domestic and international politics, make
Figure 3 shows the regional impact of climate scenarios in terms of emission reductions. Pledges by Brazil and Chile alone achieve a reduction of 1.08 GtCO2eq, equal to 17.5% below BAU projection, which is nearly half of the reductions achieved in the most stringent scenario. The NAMAs scenario results in an emissions reduction of 23.6% below BAU in 2050 (4.8 GtCO2eq instead of 6.2), yet 2050 emissions are still above 2010 figures, and the upward trend is not curbed. In the case of national commitments to reduce emissions by at least 40% from all countries (minus Venezuela), a 35.3% emission reduction below BAU is achieved in the region. 2050 GHG emissions are below 2010 levels, yet they climb up again from 2020 onwards, mainly due to Venezuelan emissions.
III - Results and discussion: Impact of climate pledges on the Energy sector
Figure 3: GHG emissions in CSA under BAU, NAMAs and Red4All scenarios
In the following paragraphs we detail this first insight, by comparing our Business-As-Usual projections with climate scenarios at sub-region and sector level. We first consider the power mix, then total primary energy production.
3-1 Impact of climate pledges on electricity
In 2012, South America already boasted a highly renewable electricity mix, with more than 60% of hydro-sourced electricity (CIER, 2013). The remaining electricity production was mainly made up of fossil fuels (gas, oil and coal) and nuclear power, leaving some room for improvement. Elec-tricity generation is bound to almost double between 2010 and 2050, reflecting the region’s fore-casted strong growth, and this could, in principle, increase the share of carbon-emitting electricity sources in the energy mix, under BAU conditions. Figure 4, however, shows a completely different outcome in our projections. Despite a 92% increase in electricity generation, the share of fossil fuels drops sharply between 2012 and 2040. Similarly, while hydro production keeps increasing in absolute terms – from 677 TWh in 2010 to 1554 TWh in 2050, its share stabilizes in 2030, then starts dropping in the last two decades. The production gap is filled mainly by wind- and solar-based electricity production.
www.modelisation-prospective.org
W
Working PaperN°2016-02-20
Figure 4: Electricity production in South America, 2012-2050 (Business-As-Usual)
The implications of such a result are already highly interest-ing: with no other assumption apart from cost minimization on a long-term horizon, the model already chooses green energies as the most interesting options for electricity pro-duction. This is partly due to the fact that this scenario oc-curs in an ideal world where long-term centralized planning is the rule. In practice, authors such as (Arango and Larsen, 2010) have stressed the fact that market forces and national policies in e.g. Argentina may lead to a carbonization of the electricity matrix in the years to come. However, our results imply that moving from a nearly 100% renewable power mix today to a 100% renewable mix tomorrow in South America is more about social acceptation and economic limitation than its lack of technical or economic potential.
Figure 5 displays the variations in power generation for our three climate scenarios compared to BAU, from the least stringent (BraChi) to the most stringent (Red4All). The impact
of climate pledges on the energy sector appears clearly: the reliance on fossil fuels decreases in the three climate sce-narios, and more so as time goes by. The amount of elec-tricity generated under emission constraints is also slightly higher than in our BAU case, and so are electricity prices. Fossil fuels are replaced by hydropower, geothermal elec-tricity and biomass-based production. The lower reliance on solar electricity in 2050 is mostly due to Brazil and Argentina and Colombia, and occurs for two main reasons. First, once oil has been completely removed from the electricity mix, the model installs BECCS technologies instead of solar panels to further decarbonize its electricity. Second, electricity prices rise slightly under climate constraint, and we reach a tipping point between decentralized PV and centralized, mid-price hydro production. This is a manifestation of the ‘razor edge effect’ of linear optimization models, as documented by e.g. (Labriet et al., 2010).
proposed by Peru/Ecuador and Colombia (T-ALyC’s AND and COL regions). They lead to an additional emissions re-duction of 380 Mt CO2eq in 2050 on the continent compared to BraChi, which is a further 6.2% below BAU. Figure 6 presents the evolution of the power mix, from BraChi to NAMAs, in three cost scenarios:
The first one (NAMAs in the key on the figure) is the BAU cost scenario. •
In NAMAs_1%, both the investment and O&M costs for mid-price dam technology increase by 1%, to 1.290 $/W •
and 2.42 cts/W/yr, respectively.
In NAMAs_2%, both the investment and O&M costs for mid-price dam technology increase by 2%, to 1.300 $/W •
and 2.44 cts/W/yr, respectively.
While this cost evolution does not impact the power mix in the AND region, the effect is quite disproportionate for COL: in the regular NAMAs scenario, most decentralized PV generation is displaced by hydropower, but this effect disappears completely with 2% higher dam costs. The cost structure is different for decentralized PV and centralized hydro pro-duction: in the decentralized PV case, investment costs are high and daily availability is constrained, but we consider no operation and maintenance costs, no transmission costs and/or losses. Investment costs are lower for hydropower, yet this technology is burdened by fixed operation and maintenance costs, transmission costs and transmission losses. However, the present value of the electricity generated by these two technologies in 2050 differs very little. Climate con-straints increase the volumes and marginal costs of electricity production and favor the latter, as a consequence of the aforementioned ‘razor edge’ effect. In AND, NAMAs induce an increase in wind, solar and hydro energy in the electricity mix, while biomass is redirected towards heat production.
Figure 6: Deviation from the BraChi power mix in COL and AND in the NAMAs scenario, for three price scenarios
South America’s electricity mix thus contributes to regional emission targets by two means:
First, by lowering the carbon intensity of the electricity produced: the reliance on fossil fuels is reduced by 75% in •
2050 under the most stringent climate scenario, compared to BAU projection. Together with the introduction of BECCS technologies, 17% of the continent’s total electricity generation in 2050 shifts towards greener technologies, from a situation in which the electricity matrix was already quite virtuous.
Second, by increasing the absolute amount of electricity produced, by up to 5% in 2050. Clean electricity competes •
here with other forms of energy for providing end-use energy services, mainly in the industry sector.
However, the added impact of the NAMAs scenario on the electricity mix is rather limited. This is mainly due to two factors: first, the only regions where NAMAs apply, namely AND and COL, together represent 11% of the electricity gen-erated in South America in 2010 (15% in 2050). Second, unlike Chile and Brazil’s pledges, which are based on BAU pro-jections, the electricity targets registered as NAMAs for COL and AND are already partially met under BAU conditions.
www.modelisation-prospective.org
W
Working PaperN°2016-02-20
3-2 - Impact of climate pledges on primary energy consumption
3-2-1- The relevance of oil exports
When taking export-bound oil production into ac-count, fossil fuels dominate primary energy produc-tion, constantly accounting for more than 70% of total production (Figure 7). In 2030, fossil fuels rep-resent 80% of Latin American primary production; oil alone makes up 60% of this production, at 1,186 Mtoe.
The decrease in oil production after 2030 is owed to two factors (see Figure 8). First, Venezuelan crude oil exports, which make up the bulk of South American exports, are capped in our model at 24 PJ/year (ap-prox. 573 Mtoe/yr) to avoid over-unrealistic export volumes, since global oil prices are static in this ver-sion of T-ALyC. Due to capacity expanver-sion inertia, this threshold is reached in 2030, marking a clear
break in the upward trend. Second, after two decades of oil bounty, exporting towards its neigh-bors and the rest of the world, Brazil itself starts im-porting oil, dragging Argentina and Uruguay along. The conjunction of those factors starts a downward trend for oil production in 2030. In the 2030-2050 pe-riod however, the rise of biomass and solar energy in the primary mix offsets this trend, leading to nearly stationary primary energy consumption between 2030 and 2050. However, primary solar energy as considered here is the incoming solar radiation be-fore conversion into electricity4. As a consequence,
the contribution of both biomass and solar energy to primary energy consumption is significantly larger than their actual output in terms of electricity/fuel/heat production.
4 That is, without the energy losses incurred by solar panels/connecting lines. About 85% of this primary energy
is lost in the conversion process.
Figure 7: Primary energy production under BAU assumptions
The overwhelming majority of exported oil is crude, with few associated emissions. Nevertheless, climate pledges could still impact oil trade in South America, in three main ways:
Regardless of decisions and pledges from other world regions, penalizing the regional consumption of fossil fuels (through taxes, subsidies on green fuels, etc.) would indeed make them less competitive on the in-ternal market, but would not impact exports’ compet-itiveness. We can thus expect that the decrease in primary fossil energy production will at best be limited, with a shift from internal consumption to exports. Fi-nancing a green subsidy policy could even lead to an increase in oil production when the takeoff of renew-ables is bound to the redistribution of an oil rent, as studied by (Goldemberg et al., 2014).
Export volumes can be voluntarily reduced as part of a political volition to reduce the continent’s contribu-tion to global emissions. The Yasuni-ITT initiative, al-though unsuccessful, established an interesting case for this type of new cooperation framework (Pellegrini et al., 2014; Vallejo et al., 2015).
Export volumes can also drop as a result of interna-tional climate pledges, through their impact on global
oil prices. The idea here is that international pledges would push renewable energy production and reduce global oil demand, thus bringing down oil prices. Venezuela produces heavy oil at relatively high costs (breakeven price estimated at USD 30, compared to USD 10 for Saudi Arabian wells) and would be among the first impacted by such a slowdown (its budget breakeven is considered by most analyses to be around or above USD 120). This assumption is con-firmed by studies such as e.g. (Labriet et al., 2015). Another route could be a global border tax system, which would place oil exports on a level field with in-ternal oil consumption (see e.g. (Keen and Kotsogian-nis, 2014)) but have a detrimental effect on national industries.
The risk inherent to such a scenario would be that the no-longer-exported oil could be consumed within Latin America itself, replacing other renewable forms of energy production, starting with biofuels. As a first approximation of this issue, Figure 9 presents the evo-lution of the primary energy mix (net of trade) in a global context with oil prices 40% lower than their BAU value: solar energy all but disappears from the energy mix, and some gas is also replaced.
Figure 9: Change in primary energy consumption in CSA with low global oil prices Brazilian pledges drive regional decarbonization
www.modelisation-prospective.org
W
Working PaperN°2016-02-20
3-2-2- Brazilian pledges drive regional decarbonization
Figure 10 shows primary energy production in Latin America minus net energy trade. The total primary energy supply is multiplied by slightly more than 2.5 between 2010 and 2050. The share of oil is considerably reduced (from 60% down to 35% in 2030) and, conversely, the share of gas increases, mainly due to net gas imports from Brazil and Chile. The overall fossil fuel share remains below 70% of total primary consumption during the whole period, yet the mix is quite heavily fossil-fuel based. While the power sector is the first fossil fuel consumer in 2010, the demand for fossil fuels is increasingly driven by industry and transport (Figure 11), as electricity depends less and less on fossil fuels5.
Beyond relatively virtuous power production, BAU projections for energy production in Latin America thus leave some room for GHG emission reductions, most of all in the transport and industry sectors. This decarbonization potential could be tapped through biofuel policies, energy efficiency measures, investment in clean generation and transportation, modal shift, etc. We consider here the impact of pledge reductions as is, that is, without choosing a particular sector to achieve emission reductions ex ante, and without implementing any other ad hoc scheme than those described in Introduction.
Figure 11: fossil fuel consumption in 2010 and 2050 (BAU) Figure 10: Primary energy consumption in BAU case – net of trade
5 The elctric mobility option, although much discussed in literature, is actually not studied here, due to model
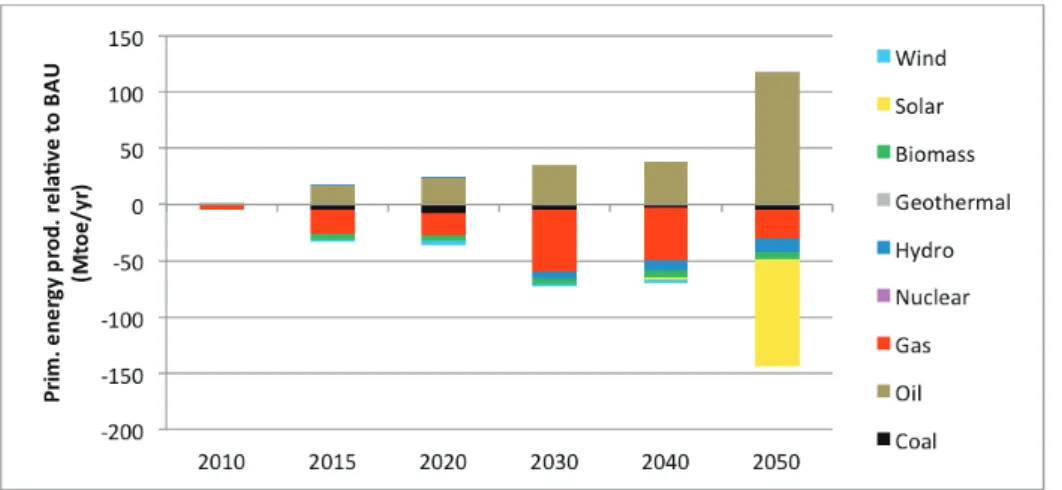
Figure 12 displays the variations in pri-mary energy supply (net of trade) for the three climate scenarios compared to BAU, from the least stringent (BraChi) to the most stringent (Red4All). As for elec-tricity, the decline in fossil fuels is note-worthy; a new element, however, is the higher penetration of natural gas in pri-mary energy. Under climate constraints, the industry sector shifts from coal to gas for steam and process heat genera-tion, most of all in the two Brazil regions (BSE and BWC). BSE’s industrial sector still exhibits a strong reliance on biomass (bagasse) in the three scenarios. Transport shifts heavily from oil-based fuels to biodiesel, with more than 40 Mtoe/yr new bio-based fuels in 2050 in the Red4All scenario. Both gasoline and diesel are impacted by this trend. All in all, a little more than 15% of the conti-nent’s 2050 primary energy production is transferred towards greener energy sources in the most stringent climate scenario, Red4All.
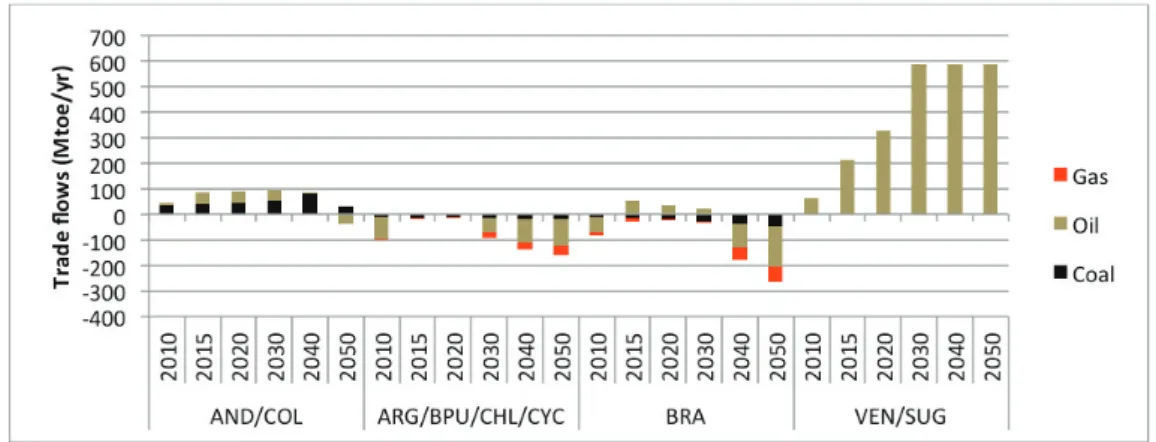
We now compare the BraChi scenario, where only Brazil and Chile’s pledges are considered, with our BAU scenario. Fig-ure 13 shows the impact of Brazil and Chile’s pledges on energy trade in South America. BraChi pledges result not only in a decrease in national fossil fuel pro-duction and an increase in renewable-based energy production for the countries concerned; they also impact the rest of the continent through trade. BPU oil exports to Brazil and AND ex-ports to Chile drop due to oil’s reduced competitiveness in these two countries.
Bolivia increases its gas exports to Brazil until 2040; however, this increase ex-hausts Bolivian low-cost gas reserves, leading Brazil to shift to global markets to import its oil in the last period (2050). Finally, and most importantly, Colombia slows down its coal exports to Brazil (and, to a lesser extent, Chile), preferring to export its coal out of South America. This impact is far from negligible, as the coal redirected towards global markets in 2040 and 2050 represents more than 70% of total Colombian coal exports to Brazil – which, in turn, represent nearly all of Brazil’s coal consumption in 2050.
Figure 12: Modification of the primary energy mix relative to BAU in BraChi, NAMAs and Red4All scenarios
Figure 13: Impact of Brazil and Chile’s pledges on intra-continental trade
A commitment by Brazil and Chile alone thus impacts the whole continent. Brazilian pledges to reduce emissions below BAU make fossil fuels less com-petitive in the country, and Brazil’s eco-nomic weight6also drives their reduced
competitiveness in neighboring coun-tries, which translates into lower fossil fuel consumption inside South America itself and more exports outside the sub-continent.
www.modelisation-prospective.org
W
Working PaperN°2016-02-20
3-2-3- Sectorial targets: limited impact on energy
Let us now move to the NAMAs scenario. As already stated in paragraph 3.1, sectorial NAMAs have only been proposed by Peru/Ecuador and Colombia (T-ALyC’s AND and COL regions). They lead to an additional emissions reduction of 380 Mt CO2eq in 2050 on the continent compared to BraChi, which is an additional 6.2% below BAU. However, this emissions reduction burden is not shared equally: for AND, emission reduc-tions in 2050 under NAMAs assumpreduc-tions represent 35.1% of all BAU emissions, while they account for 3.2% of BAU emissions in COL. There are two explanations for this difference:
First, Colombia’s primary energy consumption is much less impacted by national NAMAs than Peru’s (Figure 14). In the Andean region, bio-based energy production increases by up to 26.9 Mtoe/yr in 2050 compared to the BraChi scenario, that is, the increase represents 23% of AND total primary energy production in 2050 in BraChi7. On the other hand, primary energy production is only slightly impacted in 2050 in Colombia: the
lower reliance on fossil fuels in 2050 (-3.03 Mtoe/yr) represents only a 2.8% deviation from Colombia’s primary energy mix in BraChi. The main reason is that Colombia’s NAMAs are already satisfied in our BAU projections, and more so in the BraChi scenario. This highlights one drawback of NAMAs compared to pledges for global reductions below a Business-as-Usual projection: while the latter always forces a change in the trend, the former may only follow the trend, with little if any impact.
Second, Peru and Ecuador’s NAMAs include a strong commitment to reduce deforestation, while Colombia’s national objectives in this area are not formalized as UNFCCC pledges. Beyond real but limited improvements through the energy mix, deforestation pledges account for 332 MtCO2eq avoided emissions in the AND re-gion; in other words, 90% of AND’s emission reductions result from the fight against deforestation. This high-lights a second drawback of NAMAs: even NAMAs that effectively move the energy mix away from its BAU track may fail to deliver relevant GHG emission reductions in the specific South American context. On the positive side, though, well-designed NAMAs (here with deforestation-based targets) may deliver substantial emission reductions, without impacting strategic sectors such as energy production.
From the AND experience, we can infer that the energy sector may not have the highest emissions reduc-tion potential in South America, due to the weight of forestry and agriculture in the continent’s emissions. This assumption is detailed and confirmed in the next paragraph.
7 We consider NAMAs’ impact by comparison with BraChi and not BAU to remove Brazil’s influence on e.g. Colombia’s coal exports.
In this last paragraph, we review the various sources and sinks for greenhouse gases modeled in T-ALyC and their contribution to GHG emission reduction, to contextual-ize the energy sector’s contribution to fulfilling regional climate commit-ments.
Figure 15 shows GHG emissions, sector by sector, under the least stringent (BAU) and most stringent (Red4All) pledge scenarios, for the whole region. Figure 16 details GHG abatement in the Red4All sce-nario. Agriculture is the most emit-ting sector, totaling 47% of regional emissions in 2050 in the BAU sce-nario (2.9 GtCO2eq out of 6.17 GtCO2eq total emissions). The in-dustry and transport sectors ac-count for 37% of GHG emissions, while the energy sector (oil refining and electricity production) comes third with 12% of total emissions. The cumulative emission reduc-tions achieved by energy, industry, transport, residential and
commer-cial sectors together, through modal shift, renewable energy, car-bon capture and storage, industrial efficiency, etc. represent 44% of total GHG abatement in 2050 under the Red4All scenario. Meanwhile, the remaining 56% are provided by AFOLU measures (mainly fighting deforestation, and reforestation). It is worth noting that due to the vir-tuous trend highlighted in para-graph 3.1, energy emissions already decrease in Business-as-Usual conditions, and that energy is the only sector showing this down-ward trend.
Figure 16 allows us to focus specif-ically on emissions absorption. The gray shading concerns absorption in the energy sector, green shows forestry options and red indicates GHG abatement options deployed in end-use sectors. The GHG abatement displayed here only re-lates to specific abatement-tar-geted measures as described in the legend, i.e. it does not consider
emission reductions through e.g. fuel shift, demand reduction or effi-ciency improvements. As a conse-quence, the origin of emissions reduction in the transport and in-dustry sectors is not captured well. The role of carbon storage in reduc-ing energy emissions, however, ap-pears clearly: together, enhanced Oil & Gas Recovery and Storage in depleted fields account for 200 MtCO2eq of emission reductions, i.e. more than 40% of all energy-bound emission reductions. Proper handling of flared gases adds an-other 36.5 MtCO2eq, with the re-maining reductions due to further decarbonization of the energy mix. What also clearly emerges is the key role played by forestry in GHG emissions abatement, with 1,218 MtCO2eq emissions avoided by combating deforestation and pro-moting reforestation.
3-3 - Non-energy emissions
www.modelisation-prospective.org
W
Working PaperN°2016-02-20
Figure 16: GHG capture and storage by sector (Red4All scenario)
The emissions reduction patterns considered here are radically different from the situation in Europe, where energy is foreseen as the main contributor to emissions reduction by 2050 (European Commission, 2011). In Central and South America, due to the overwhelming weight of AFOLU emissions, decarbonizing energy production and consumption is no longer the least expensive or most efficient tool to reduce GHG emissions. In fact, it would fall short of delivering more than 50% emission reduction, even at a prohibitive cost, and the target set here for 2050 –a 40% reduction– is not that far from that limit. GHG emission reductions in South America should therefore be considered from a very different viewpoint: energy is not the easiest way to achieve emissions reduction because it is not the main problem; forestry, on the other hand, remains a long-run carbon sink whose management options are the focus of active research, in terms of both technol-ogy and policy aspects (Arima et al., 2014; Asner et al., 2014). In the whole world, it is estimated that defor-estation and forest degradation account for 17% of GHG emissions (IPCC, 2007) and these activities are already seen as a ‘low-hanging fruit’ in the fight against climate change (Stern, 2007), (Buizer et al., 2014). The present work tends to confirm this trend in the case of South America.
IV - Conclusions and policy implications
This paper analyzed the energy sector’s contribution to GHG emissions reduction in the UNFCCC framework. We outlined South America’s energy sector potential for GHG abatement and the evolutions required to realize this potential.
We investigated this issue by means of a bottom-up, long-term optimization model, based on the TIMES paradigm yet specifically designed for South America: the TIMES-América Latina y el Caribe model, or T-ALyC. We com-pared four scenarios based on current national communications to the UNFCCC: a Business-As-Usual case, a BraChi scenario where only Brazil and Chile’s pledges apply, a NAMAs scenario including all communi-cated NAMAs, and a hypothetic Red4All scenario where all countries except Venezuela would make Brazil-like commitments to reduce their GHG emissions by 40% below their baseline by 2050.
In our projections, energy accounts for nearly 20% of emission reductions in the most stringent (Red4All) sce-nario, with AFOLU providing 56% of these reductions in 2050. We find that energy is not the main contributor to emission reductions in South America for two main rea-sons: first, in our baseline, long-term economic optimiza-tion already leads to a decarbonizaoptimiza-tion of the electricity sector. Further decarbonization can be achieved by shift-ing primary energy consumption by end-use sectors such as industry or transport. Second, the weight of deforesta-tion and land degradadeforesta-tion in the continent’s GHG balance is considerable, even today, and it is more economically viable to curb this trend than to decarbonize a fairly clean energy mix. As a consequence, the impact of national pledges on the energy sector is real, yet feedback in terms of GHG abatement remains limited. We find that while pledges by Brazil and Chile impact the whole continent’s energy trade by undermining oil and coal competitiveness, the added impact of Colombia’s NAMAs is low, since na-tional targets do not go far beyond our BAU trend. In Peru and Ecuador, NAMAs’ impact on the energy system is more significant, yet forestry-aimed NAMAs alone deliver 90% of the sub-region’s GHG abatement. However, the overall impact of NAMAs on Peru and Ecuador is strong, leading to significant emission reductions compared to BAU (35%). We also showed that a sustained drop in in-ternational oil prices due to e.g. an inin-ternational climate agreement, could negatively impact the continent’s emis-sions if South America did not commit to such an agree-ment, as oil exports would be redirected towards internal consumption and displace renewable energy sources. It is worth noting that such a drop would also have dramatic consequences on the Venezuelan economy, which relies quite heavily on oil exports.
The policy implications of these results, as developed in the results section, are many. We summarize four of them here. First, our results confirm the initial statement that South American climate-energy issues merit ad hoc mod-eling at a regional scale, since the countries on the conti-nent share features that are quite different from the rest of the world, i.e. a highly renewable energy mix, very high re-newable energy potentials along with high deforestation and degradation rates, which call for regional answers to regional issues. Second, in light of our results, that is, con-sidering a first-order optimum that leaves aside energy markets and short-term decision-making, clean energy generation appears to be an economically viable option for South America. It is beyond the range of our modeling ap-proach to take non-optimality factors into account to de-termine a second-best optimum; however, these first results suggest that heavy subsidies on fossil fuels such as those that exist in Venezuela, Argentina and Peru, may not move in the direction of economic optimality, in addi-tion to their environmental inefficiency. Third, the signifi-cance of Brazil in South America’s fight against climate change is incontestable, since its decisions already drive relevant changes in its neighbors’ energy mixes. Last, and most important, we confirm that, in contrast to Annex I countries, energy cannot be the main focus of efforts to fight global warming in South America because it is not the continent’s main problem. In South America, deforestation and land degradation are not only part of the climate issue: they make up the bulk of it.
The importance of deforestation also points to one limita-tion of our study: although we considered energy produc-tion and transformaproduc-tion in a very detailed way, our representation is more limited when it comes to AFOLU, due to the weak link between energy and e.g. reforesta-tion. Further investigation of energy and AFOLU interac-tions in a climate context would require internalizing a bottom-up approach of the forestry sector, building on work such as e.g. (Overmars et al., 2014). Following an-other research line, integrating our results back into the global TIAM energy model would extend the intuitions we developed here on the role of oil in an interesting way, pro-viding dynamic oil price feedback based on the possible results of climate talks, rather than a mere sensitivity analy-sis. Last, one major component of the climate-energy nexus that has not been touched on here is the adaptation issue: beyond mitigation, how to prepare a strongly renew-able, climate-sensitive energy mix to tackle uncertain cli-mate change effects? This issue is currently being worked on, and will form the basis of another publication.
www.modelisation-prospective.org
W
Working PaperN°2016-02-20
This research was supported by the Chair Modeling for sustainable development, driven by MINES Paris-Tech, Ecole des Ponts ParisParis-Tech, and AgroParisParis-Tech, supported by ADEME, EDF, GRTgaz, SCHNEIDER ELECTRIC and the French Ministry of Ecology, Sustainable Development and Energy. The funding body was not involved in study design; collection, analysis and interpretation of data; the writing of the report; or the decision to publish.
VI - Bibliography
Akimoto, K., Sano, F., Homma, T., Oda, J., Nagashima, M., Kii, M., 2010. Estimates of GHG emission reduction
po-tential by country, sector, and cost. Energy Policy,
Large-scale wind power in electricity markets with Regular Papers 38, 3384–3393. doi:10.1016/j.enpol.2010.02.012
ALACER, 2013. América Latina en cifras - Asociación
Lati-noamericana del Acero.
Arango, S., Larsen, E.R., 2010. The environmental paradox
in generation: How South America is gradually becoming more dependent on thermal generation. Renew. Sustain.
Energy Rev. 14, 2956–2965. doi:10.1016/j.rser.2010.07.049
Arima, E.Y., Barreto, P., Araújo, E., Soares-Filho, B., 2014.
Public policies can reduce tropical deforestation: Lessons and challenges from Brazil. Land Use Policy 41, 465–473.
doi:10.1016/j.landusepol.2014.06.026
Asner, G.P., Knapp, D.E., Martin, R.E., Tupayachi, R., An-derson, C.B., Mascaro, J., Sinca, F., Chadwick, K.D., Hig-gins, M., Farfan, W., Llactayo, W., Silman, M.R., 2014.
Targeted carbon conservation at national scales with high-resolution monitoring. Proc. Natl. Acad. Sci.
doi:10.1073/pnas.1419550111
Bassi, A.M., Baer, A.E., 2009. Quantifying cross-sectoral
impacts of investments in climate change mitigation in Ecuador. Energy Sustain. Dev. 13, 116–123.
doi:10.1016/j.esd.2009.05.003
Borba, B.S.M.C., Lucena, A.F.P., Rathmann, R., Costa, I.V.L., Nogueira, L.P.P., Rochedo, P.R.R., Castelo Branco, D.A., Júnior, M.F.H., Szklo, A., Schaeffer, R., 2012.
Energy-related climate change mitigation in Brazil: Potential, abatement costs and associated policies. Energy Policy,
Special Section: Fuel Poverty Comes of Age: Commemo-rating 21 Years of Research and Policy 49, 430–441. doi:10.1016/j.enpol.2012.06.040
Brazilian Ministry of Science and Technology, 2010. Second
national communication of Brazil to the United Nations Framework convention on Climate Change. Brasilia.
Buizer, M., Humphreys, D., de Jong, W., 2014. Climate
change and deforestation: The evolution of an intersect-ing policy domain. Environ. Sci. Policy, Climate change and
deforestation: the evolution of an intersecting policy domain 35, 1–11. doi:10.1016/j.envsci.2013.06.001
Carvallo, J.P., Hidalgo-Gonzalez, P., Kammen, D.M., 2014.
Envisioning a sustainable Chile.
CIER, 2013. Síntesis Informativa energética de los países
de la CIER, datos 2012.
CIER, 2011. Síntesis informativa energética de los países
de la CIER, datos 2009.
Colgan, J.D., 2014. Oil, Domestic Politics, and
Interna-tional Conflict. Energy Res. Soc. Sci. 1, 198–205.
doi:10.1016/j.erss.2014.03.005
Di Sbroiavacca, N., Nadal, G., Lallana, F., Falzon, J., Calvin, K., 2015. Emissions reduction scenarios in the Ar-gentinean Energy Sector. Energy Econ.
doi:10.1016/j.eneco.2015.03.021
Elberg Nielsen, A.S., Plantinga, A.J., Alig, R.J., 2014.
Miti-gating climate change through afforestation: New cost es-timates for the United States. Resour. Energy Econ. 36,
83–98. doi:10.1016/j.reseneeco.2013.11.001
European Commission, 2014. Sixth national
Communica-tion from the European Union under the UNFCCC.
European Commission, 2011. Roadmap for moving to a
low-carbon economy in 2050.
Fundación Bariloche, 2008. Argentina: Diagnóstico,
prospectivas y lineamiento para definir estrategias posi-bles ante el Cambio Climático.
Garcés, P., Garcia, F., Parra, C., Preciado, V., Lim, S.H.,
Franco, E., 2012. Potencial de Recursos Energéticos y Minerales en América del Sur: Coincidencias Jurídicas hacia una Estrategia Regional.
Global Energy Observatory, 2013. Information on Global En-ergy Systems and Infrastructure [WWW Document]. glob-alenergyobservatory.org. URL http://globalenergyobservatory.org/ (accessed 8.4.14).
Goldemberg, J., Schaeffer, R., Szklo, A., Lucchesi, R., 2014.
Oil and natural gas prospects in South America: Can the petroleum industry pave the way for renewables in Brazil? Energy Policy 64, 58–70. doi:10.1016/j.enpol.2013.05.064
Gonzalez Arenas, J.J., Etter Rothlisberger, A.A., Sarmiento López, A.H., Orrego Suaza, S.A., 2011. Análisis de
tenden-cias y patrones espaciales de deforestación en Colombia.
Instituto de Hidrología, Meteorología y Estudios Ambien-tales de Colombia.
Hof, A.F., den Elzen, M.G.J., Roelfsema, M., 2013. The ef-fect of updated pledges and business-as-usual
projec-www.modelisation-prospective.org
W
Working PaperN°2016-02-20
tions, and new agreed rules on expected global green-house gas emissions in 2020. Environ. Sci. Policy 33,
308–319. doi:10.1016/j.envsci.2013.06.007
Hoornweg, D., Bhada-Tata, P., 2012. What a Waste - A
Global Review of Solid Waste Management. The World
Bank.
IEA, 2014. International Energy Agency - World Energy
Statistics - 2013 Edition.
IER, 2006. Institut für Energiewirtschaft und Rationelle
Energieanwendung - Review of resources and trade of
fossil energy resources in the TIAM model.
IMF, 2014. International Monetary Fund - World
Eco-nomic Outlook Database [WWW Document]. URL http://www.imf.org/external/pubs/ft/weo/data/changes.ht m (accessed 6.17.14).
IPCC, 2014. Summary for Policymakers, in: Climate
Change 2014: Impacts, Adaptation, and Vulnerability.
Part A: Global and Sectoral Aspects. Contribution of Working Group II to the Fifth Assessment Report of the Intergovernemental Panel on Climate Change. Cambridge University Press, Cambridge, United Kingdom and New York, NY, USA.
IPCC, 2007. Climate Change 2007: Synthesis Report.
Contribution of Working Groups I, II and III to the Fourth Assessment Report of the Intergovernmental Panel on Climate Change. Geneva, Switzerland.
Keen, M., Kotsogiannis, C., 2014. Coordinating climate
and trade policies: Pareto efficiency and the role of bor-der tax adjustments. J. Int. Econ. 94, 119–128.
doi:10.1016/j.jinteco.2014.03.002
Labriet, M., Drouet, L., Vielle, M., Loulou, R., Kanudia, A., Haurie, A., 2015. Assessment of the Effectiveness of
Global Climate Policies Using Coupled Bottom-up and Top-down Models, Climate Change and Sustainable
De-velopment. Fondazione Eni Enrico Mattei, Milano.
Labriet, M., Loulou, R., Kanudia, A., 2010. Modeling
Un-certainty in a Large scale integrated Energy-Climate Model, in: Filar, J.A., Haurie, A. (Eds.), Uncertainty and
Environmental Decision Making, International Series in Operations Research & Management Science. Springer US, pp. 51–77.
Loulou, R., Labriet, M., 2008. ETSAP-TIAM: the TIMES
integrated assessment model Part I: Model structure. Comput. Manag. Sci. 5, 7–40.
doi:10.1007/s10287-007-0046-z
Loulou, R., Remme, U., Kanudia, A., Lehtila, A., Goldstein, G., 2005. Documentation for the TIMES model: Part I.
Energy Technol. Syst. Anal. Programme Available
Http-www Etsap Orgdocumentation Asp.
Matthews, H.D., Graham, T.L., Keverian, S., Lamontagne, C., Seto, D., Smith, T.J., 2014. National contributions to
observed global warming. Environ. Res. Lett. 9, 014010.
doi:10.1088/1748-9326/9/1/014010
Ministerio de Ambiente de Colombia, 2012. Plan
Na-cional de Restauración.
Ministerio de Ambiente del Perú, 2010. El Perú y el
Cam-bio Climático. Lima.
Ministerio del Ambiente del Ecuador, 2012. Línea Base de Deforestación del Ecuador Continental. Quito.
Ministerio del Ambiente del Ecuador, 2011. Segunda
Co-municación Nacional sobre Cambio Climático. Quito.
Ministerio del Medio Ambiente de Chile, 2011. Segunda
comunicación nacional de Chile ante la convención marco de las Naciones Unidas sobre cambio climático.
Maval Chile, Santiago, Chile.
Ministerio del Medio Ambiente de Uruguay, 2010. Tercera
Comunicación Nacional del Uruguay a la Conferencia de la Partes en la Convención Marco de la Naciones Unidas sobre el Cambio Climático. Montevideo.
Nepstad, D., Soares-Filho, B.S., Merry, F., Lima, A., Moutinho, P., Carter, J., Bowman, M., Cattaneo, A., Ro-drigues, H., Schwartzman, S., McGrath, D.G., Stickler, C.M., Lubowski, R., Piris-Cabezas, P., Rivero, S., Alencar, A., Almeida, O., Stella, O., 2009. The End of
Deforesta-tion in the Brazilian Amazon. Science 326, 1350–1351.
doi:10.1126/science.1182108
Overmars, K.P., Stehfest, E., Tabeau, A., van Meijl, H., Bel-trán, A.M., Kram, T., 2014. Estimating the opportunity
costs of reducing carbon dioxide emissions via avoided deforestation, using integrated assessment modelling.
Land Use Policy 41, 45–60. doi:10.1016/j.landusepol.2014.04.015
Pellegrini, L., Arsel, M., Falconí, F., Muradian, R., 2014.
The demise of a new conservation and development policy? Exploring the tensions of the Yasuní ITT initia-tive. Extr. Ind. Soc. 1, 284–291. doi:10.1016/j.exis.2014.05.001
Ricci, O., Selosse, S., 2013. Global and regional
poten-tial for bioelectricity with carbon capture and storage. Energy Policy, Special Section: Transition Pathways to a
Low Carbon Economy 52, 689–698. doi:10.1016/j.enpol.2012.10.027
Riegelhaupt, E., Chalico, T.A., 2009. Opportunities and
23
www.cma.fr
W
forester’s perspective. CIFOR.
Samaniego, J., Bárcena, A., Prado, A., Pérez, R., 2014.
The economics of climate change in Latin America and the Caribbean: Paradoxes and challenges. United Na-tions - CEPAL.
Secretaria de Ambiente de la República Argentina, 2007.
Segunda Comunicación Nacional de la República Ar-gentina a la convención Marco de las Naciones Unidas sobre Cambio Climático.
Secretaria de Ambiente del Paraguay, 2011. Segunda
Comunicación Nacional - Cambio Climático. Asunción.
Sharma, S., Desgain, D., 2014. Understanding NAMA
Cycle.
Smeets, E., Faaij, A., Lewandowski, I., Turkenburg, W.,
2007. A bottom-up assessment and review of global
bio-energy potentials to 2050. Prog. Energy Combust.
Sci. 33, 56–106. doi:10.1016/j.pecs.2006.08.001
Smith, P., Bustamante, M., Ahammad, H., Clark, H., Dong, H., Elsiddig, E.A., Haberl, H., Harper, R., House, J., Jafari, M., Masera, O., Mbow, C., Ravindranath, N.H., Rice, C.W., Robledo Abad, C., Romanovskaya, A., Sper-ling, F., Tubiello, F., 2014. Agriculture, Forestry and
Other Land Use (AFOLU), in: Edenhofer, O.,
Pichs-Madruga, R., Sokona, Y., Faraghani, E., Kadner, S., Sey-both, K., Adler, A., Baum, I., Brunner, S., Eickemeier, P., Kriemann, B., Savolainen, J., Schlömer, S., von Ste-chow, C., Zwickel, T., Minx, J.C. (Eds.), Climate Change 2014: Mitigation of Climate Change. Contribution of Working Group III to the Fifth Assessment Report of the Intergovernmental Panel on Climate Change. Cam-bridge, United Kingdom and New York, NY, USA.
Stern, N., 2007. The Economics of Climate Change:
The Stern Review. Cambridge University Press.
Syri, S., Lehtilä, A., Ekholm, T., Savolainen, I., Holttinen, H., Peltola, E., 2008. Global energy and emissions
sce-narios for effective climate change mitigation—Deter-ministic and stochastic scenarios with the TIAM model. Int. J. Greenh. Gas Control 2, 274–285.
UNDESA, 2012. World Population Prospects, the 2012
Revision [WWW Document]. URL
http://esa.un.org/unpd/wpp/ASCII-Data/DISK_NAVIGA-TION_ASCII.htm (accessed 8.20.14).
UNEP, 2012. Global Chemicals outlook 2012 [WWW
Document]. URL
http://www.unep.org/pdf/GCO_Syn-thesis%20Report_CBDTIE_UNEP_September5_2012.p df (accessed 5.8.14).
UNFCCC, 2013. Compilation of information on
nation-ally appropriate mitigation actions to be implementes by developing country Parties - Revised note by the secretariat.
US-EIA, 2014. Energy Information Administration -
In-ternational Energy Statistics.
Vallejo, M.C., Burbano, R., Falconí, F., Larrea, C., 2015.
Leaving oil underground in Ecuador: The Yasuní-ITT initiative from a multi-criteria perspective. Ecol. Econ.
109, 175–185. doi:10.1016/j.ecolecon.2014.11.013
Van Ruijven, B.J., Daenzer, K., Fisher-Vanden, K., Kober, T., Paltsev, S., Beach, R.H., Calderon, S.L., Calvin, K., Labriet, M., Kitous, A., Lucena, A.F.P., van Vuuren, D.P.,
2015. Baseline projections for Latin America:
base-year assumptions, key drivers and greenhouse emis-sions. Energy Econ. doi:10.1016/j.eneco.2015.02.003
Viceministerio del Medio Ambiente de Bolivia, 2009.
Se-gunda Comunicacion del estado plurinacional de Bo-livia ante la Convención Marco de las Naciones Unidas sobre el Cambio Climático. La Paz.
World Nuclear Association, 2008. WNA Nuclear Century
Outlook Data [WWW Document]. URL http://www.world-nuclear.org/WNA/Publications/WNA-Reports/nco/Nuclear-Century-Outlook-Data/ (accessed 4.23.14).
World Resources Institute, 2015. CAIT 2.0: WRI’s
cli-mate data explorer [WWW Document]. World Resour.
Inst. URL http://cait2.wri.org/wri?undefined (accessed 3.17.15).
Working Paper N°2016-02-20