10
Cenozoic Structure and Tectonic
Evolution of the Kuqa Fold Belt,
Southern Tianshan, China
Xin Wang
Department of Geosciences, Zhejiang University, Hang Zhou, China
John Suppe
1Department of Geosciences, National Taiwan University, Taipei, Taiwan
Shuwei Guan
Research Institute of Petroleum Exploration and Development, PetroChina, Beijing, China
Aurelia Hubert-Ferrari
Ge´omorphologie, Universite´ de Lie`ge, Lie`ge, Belgium
Ramon Gonzalez-Mieres
2Department of Geosciences, Princeton University, Princeton, New Jersey, U.S.A.
Chengzao Jia
Research Institute of Petroleum Exploration and Development, PetroChina, Beijing, China
ABSTRACT
The east–west-trending late Cenozoic Kuqa fold belt is a part of the compressive southern margin of the Tianshan Mountains in western China. Approximately 20,000 km (12,000 mi) of two-dimensional seismic reflection profiles are integrated with surface geology and well data to examine the deformation style and structural evolution of the Kuqa fold belt. Mesozoic through Holocene strata in the northern Tarim Basin have been deformed in a thrust system that roots northward into the Paleozoic basement of the southern Tianshan. The south-vergent deformation is characterized by a series of forward-breaking thrust faults, fault-related folds, and detachment folds. Two major decollement levels exist: an upper detachment in salt-gypsum lithologies in the Paleogene – Miocene Kumgeliem, Suweiyi, and Jidike formations, and the lower detachment mostly within Jurassic coal and mudstone strata. Fault-propagation folds
215
J. Suppe, eds., Thrust fault-related folding: AAPG Memoir 94, p. 215 – 243.
1Also at: Department of Geosciences, Princeton University, Princeton, New Jersey, U.S.A.
2Present address: Saudi Arabian Chevron, Chevron Global Upstream and Gas, Houston, Texas, U.S.A.
Copyrightn2011 by The American Association of Petroleum Geologists. DOI:10.1306/13251339M94389
developed above both detachments and have been refolded in some cases by displacement on the lower thrust faults. Imbricate thrust faults and duplex structures linking the two detach-ments developed with salt that apparently flowed into the cores of the duplex structure. Near the high Tianshan mountain front, Mesozoic and Cenozoic strata are involved in deformation that began at approximately 25 – 26 Ma as documented by growth strata north of Kuqa. To-ward the southTo-ward limit of the fold belt, Miocene through Holocene strata are folded in the Quilitage and Yaken anticlines, which began growing above a thrust system that propagated at about 5.5 Ma. The Yaken anticline at the south edge of the eastern Kuqa fold belt has only emerged as a topographic anticline in the last 0.2–0.3 Ma associated with an acceleration of the Quilitage-Yaken thrust system. Structural restoration suggests a shortening of 15 – 20 km (9 – 12 mi) across the eastern Kuqa fold belt. Considering that this shortening began about 25 Ma, the average shortening rate was about 0.7 mm/yr (0.03 in./yr). Because the frontal thrust system underlying the Quilitage and Yaken anticlines has a shortening of 6 km (3.7 mi) that began approximately 5.5 Ma, their average shortening rate is about 1.1 mm/yr (0.04 in./yr). However, the shortening rate on this frontal system from about 5.5 Ma to about 0.2 –0.3 Ma is approximately 0.6 mm/yr (0.02 in./yr) followed by an acceleration to about 4 – 5 mm/yr (0.16 –0.19 in./yr) at approximately 0.2– 0.3 Ma, causing the topographic emergence of these structures. These results indicate that shortening rates in the Kuqa fold belt have increased in the late Pleistocene, which is consistent with more regional present-day geodetic shortening rates of about 9 mm/yr (0.35 in./yr) across the southern Tianshan, which also indicate a substantial acceleration relative to Neogene shortening rates.
INTRODUCTION
The Kuqa thrust and fold belt along the front of south-ern Tianshan contains a record of the interactions be-tween the Tianshan Mountains and the Tarim Basin during the Neogene to Holocene (Lu et al., 1994; Jia, 1997; Yin et al., 1998; Allen et al., 1999; Burchfiel et al., 1999; Hubert-Ferrari et al., 2007) (Figure 1). Cenozoic compressional deformation exists on both the northern and southern flanks of the Tianshan, which is part of the broad India-Eurasia collision (Molnar and Tapponnier, 1975; Tapponnier and Molnar, 1979; Allen et al., 1991; Hendrix et al., 1994; Sobel, 1995; Sobel and Dumitru, 1997) (Figure 1). In the Kuqa area, only a few of active faults reach the surface and offset the youngest sedi-ments; these have been investigated in previous work, and the rates and processes of crustal shortening and thickening in the Tianshan are documented (Brown et al., 1998; Yin et al., 1998; Burchfiel et al., 1999). How-ever, many faults are blind. Similarly, the active faults on the northern flank of the Tianshan have been inves-tigated (Avouac et al., 1993). Despite these substantial research efforts, discussing the subsurface structure of the Cenozoic deformation along the southern and northern flanks of the Tianshan has been difficult in the past because only few seismic reflection profiles have been published (Lu et al., 1994; Jia, 1997; Hubert-Ferrari et al., 2005b, 2007).
In this chapter, we present data on the structure and evolution of the Cenozoic Kuqa fold belt based on
analy-sis of the surface geology, seismic reflection profiles, and well data. We interpreted almost 20,000 km (12,000 mi) of two-dimensional (2-D) seismic profiles in the Kuqa fold belt obtained by the Tarim Oilfield Company. In addition, 59 wells (most over 4000 m [13,000 ft] deep) are used to control the subsurface structure. The loca-tions of these wells, with abbreviated names such as YH1 or DQ5, are shown on the maps and cross sec-tions. Surface geological maps at scales of 1:100,000 and 1:50,000 were integrated into this project (Zhong and Xia, 1998a). These maps, along with new structural field measurements, provide important surface constraints on the subsurface structural interpretation. Detailed stratigraphic profiles of the stratigraphic reference sec-tions are published at a scale of 1:2500 (Zhong and Xia, 1998b) to which maps, seismic horizons, and wells are tied throughout the Kuqa Basin. Furthermore, strike and dip data in remote and inaccessible regions along seismic lines were obtained from stereo Corona satel-lite images using techniques described by Hubert-Ferrari et al. (2007, their appendix A).
We first review the geology and stratigraphy of the Kuqa fold belt, which is an important component in understanding the structure of the area; then major geo-logical structures of the Kuqa fold belt are described. The timing and rate of Cenozoic deformation of the Kuqa fold belt are constrained by key seismic lines that show unconformities and growth strata that allow us, combined with magnetostratigraphic data tied to the mapped seis-mic horizons, to estimate the timing of deformation and
slip rate of the thrust faults. These results suggest a sub-stantial acceleration in shortening in the late Pleistocene.
REGIONAL SETTING
Overview of the Study Area
The Kuqa fold belt is located in the northern part of the Tarim Basin at the southern edge of the Tianshan, ex-tending 300– 400 km (200 – 250 mi) west to east from Aksu to Korle with a width of 40– 80 km (25 –50 mi) (Jia, 1997) (Figures 1, 2). The Kuqa fold belt is a part of the Cenozoic southern thrust belt of the Tianshan, with the Kalping-Wushi thrust zone to the west and the Korla transfer system to the east (Yin et al., 1998). The Kuqa fold belt is composed almost entirely of terrestrial Triassic, Jurassic, Cretaceous, late Paleogene, Neogene, and Quaternary strata with a total Mesozoic – Cenozoic thickness of up to 12,000 m (40,000 ft) in the Baicheng basin and Cenozoic strata exceeding 8000 m (25,000 ft). The series of south-vergent thrust and fold belts in the Kuqa fold belt developed sequentially from north to south and can be subdivided into four parts according to deformation styles: the northern Kuqa fold belt, Baicheng syncline, Quilitage anticline, and Yaken anticline (Lu et al., 1994; Jia, 1997) (Figure 2). Several oil and gas fields have been discovered in the Kuqa fold belt, including the Kela, Dina, Yinan, Dabei, and Tubei gas fields and the Dawanqi oil field, with sufficient
production to justify completion of a gas pipeline to eastern China.
Stratigraphy
The stratigraphy of the Kuqa fold belt has been exten-sively investigated (Hao et al., 1982; Ye and Huang, 1990; Zhong and Xia, 1998a, b). Mesozoic strata are well established from outcrop studies in the northern Kuqa fold belt (Hendrix et al., 1992; Zhong and Xia, 1998a, b), and the Cenozoic sequence is constrained by surface outcrops and wells in the Quilitage anticline (Yin et al., 1998; Zhong and Xia, 1998a, b). Mesozoic and Paleo-gene biostratigraphy of the Kuqa fold belt has been ex-tensively investigated based on studies of bivalves, algae, Ostracoda, pollens, and gastropods (Lu and Luo, 1990; Ye and Huang, 1990; Zhong and Xia, 1998a, b). The Neogene fluvial sequence, which is deposited in an arid environment, is of questionable biostratigraphic age because fossils are rare. Nevertheless, detailed magnetostratigraphic studies in the Kuqa fold belt provide important and detailed timing constraints for Cenozoic sediments in the area. The nomenclature of the Mesozoic and Cenozoic stratigraphic units used in this chapter follows that of Yin et al. (1998) and Zhong and Xia (1998a, b), who divided the sedimentary units principally based on their lithology, fossil content, and magnetostratigraphic data (Figure 2).
Assigning absolute ages to formation boundaries requires some attention to detail and is important for Figure 1. Regional location of the Kuqa fold belt (Figure 2) at the southern edge of the Tianshan Mountains (Mtns.) and the northern edge of the Tarim Basin.
determining tectonic timing and rates. Most of the Ce-nozoic magnetostratigraphic data are from the eastern Kuqa Basin (Yin et al., 1998; Meng, 1999; Charreau et al., 2006, 2008; Huang et al., 2006, 2008) and along or close to the cross section 40 km (25 mi) northeast of Kuqa (labeled Figure 7 in Figure 2), which is also the loca-tion of the detailed (1:2500) stratigraphic reference sec-tions of Zhong and Xia (1998b) that define the forma-tion boundaries used in the present chapter. The Meng
(1999) magnetostratigraphy was collected along the Zhong and Xia reference sections and uses their forma-tion boundaries and thicknesses. The high-resoluforma-tion magnetostratigraphy of Charreau et al. (2006) does not use formation boundaries but coincides with Zhong and Xia’s (1998b) and Meng’s (1999) reference sections to which we have correlated it. The high-resolution mag-netostratigraphic study of Huang et al. (2006) uses dif-ferent formation boundaries, but we have been able to Figure 2.Geological map of the Kuqa thrust and fold belt (geology simplified with reinterpretation from Zhong and Xia, 1998a). The belt is divided into four segments: the northern Kuqa thrust and fold belt, the Baicheng syncline, the Quilitage anticline, and the Yaken anticline (Lu et al., 1994; Jia, 1997). (1) Tuger anticline, (2) Yiqikelike anticline, (3) Jidike anticline, (4) Bashijiqike anticline, (5) Kumgeliem anticline, (6) Kasangtuokai anticline, (7) Tuzimaza anticline, (8) Dawanqi anticline, (9) eastern Quilitage anticline, (10) Kuqadawu anticline, (11) southern Quilitage anticline, (12) northern Quilitage anticline, (13) Miskantag anticline, (14) eastern Awate anticline, (15) Kalayuergun anticline, (16) Yaken anticline. Locations of the cross sections (Figures 6 – 11, 13) are shown. Fm = formation.
correlate it unambiguously to the nearby Zhong and Xia (1998b) and Meng (1999) stratigraphy, making use of the coordinates of the Huang sections (B. J. Huang, 2006, personal communication), tracing key horizons at the surface and correlating key reversal signatures of the magnetostratigraphic sections. The ages of Ce-nozoic formations in the present chapter therefore are based on Zhong and Xia’s (1998b) stratigraphy, which has been tied throughout the Kuqa Basin in seismic lines, surface mapping, and well picks. However, we emphasize that the late Cenozoic formation boundaries are regionally time transgressive.
The Mesozoic stratigraphy is well constrained by out-crop exposures along the northern foothills of the south-ern Tianshan, deep wells, and seismic profiles. The
Tri-assic sequence, composed of the Ehaobulake, Karamay, Huangshanjie, and Taliqik formations, is up to 2000 m (6562 ft) thick (Zhong and Xia, 1998a, b). Fluvial con-glomerate, sandstone, siltstone, and shale unconform-ably overlie Permian rhyolitic rocks. During the Early and Middle Triassic, the Kuqa region had a relatively arid climate, which by late Triassic became more humid (Hendrix et al., 1992). The Jurassic, including the Ahe, Yangxia, Kezilenuer, Qakemake, Qigu, and Kalaza for-mations (up to 2100 m [6890 ft] thick), is in conformable contact with the underlying Triassic (Hendrix et al., 1992; Zhong and Xia, 1998a, b). It is composed of mas-sive gray sandstones grading upward into fine green-ish sandstone, siltstone, and shale. Coal horizons with thickness of several tens of meters have been found in Figure 2. (cont.).
the Lower to Middle Jurassic, which are important de-tachment horizons. The Jurassic has been interpreted as meandering fluvial sediments with local lacustrine deltaic influence (Hendrix et al., 1992; Zhong and Xia, 1998a). The Triassic and Jurassic shales are considered to be the major source rocks that generated the bulk of the reservoired oil in the Kuqa fold belt (Jia, 1997). The preserved Cretaceous strata in the Kuqa region are com-posed of the Yageliemu, Shusanhe, Baxigai, and Basjiqike formations (up to 1600 m [5000 ft]), which lie uncon-formably on the Jurassic (Hendrix et al., 1992; Zhong and Xia, 1998a). A recent magnetostratigraphic study (Peng et al., 2006) shows that there is a 45-Ma hiatus between the Yageliemu, Shusanhe, Baxigai formations formed during the early–middle stage of the Early Cre-taceous (142–124 Ma) and the Basjiqike Formation de-posited during the Late Cretaceous (79–66 Ma). The Cretaceous sequence begins with a 10–20-m (30–70-ft)-thick basal conglomerate grading into coarse- to medium-grained sandstone interbedded with fine-medium-grained red siltstone and shale. Isopach maps show a thick sequence of Mesozoic strata thinning southward in the northern and central Kuqa fold belt, with depocenters located along the southern Tianshan front (Figure 3).
Late Paleogene – early Miocene strata unconform-ably overlie the Mesozoic along the northern Kuqa fold belt and are up to 1200 m (4000 ft) thick (Zhong and Xia, 1998a, b). They are divided into the Talake, Xiao-kuzibai, and Avate formations in the western region of the Kuqa fold belt and the Kumgeliem and Suweiyi formations in the eastern part of the Kuqa fold belt. The basal part of the late Paleogene strata (the Kumgeliem formation in the east and the Talake Formation in the west) is composed of a brown-gray 4–20-m (10–70-ft)-thick conglomerate. Overlying strata are a sequence of red and reddish-brown mudstone, siltstone, and fine-grained sandstone interbedded with gypsum and thin dolomite. This basal Cenozoic sequence in the Kuqa area, deposited in a marginal marine environment, has been considered to be Oligocene to early Miocene in age (Lu and Luo, 1990; Ye and Huang, 1990; Yin et al., 1998; Zhong and Xia, 1998a). In contrast, Eocene spores are reported from the Talake formation in the western Kuqa Basin (Zhong and Xia, 1998a, b). Magnetostrati-graphic data show that the Kumgeliem and Suweiyi formations of the Kuqa River and Bestantuogela sec-tions in the north of Kuqa belong to Oligocene–early Miocene (Yin et al., 1998; Meng, 1999; Charreau et al., 2006, Huang et al., 2006), and that an approximately 30 – 35 Ma sedimentary hiatus with the underlying Cretaceous strata exists (Peng et al., 2006). The age of the base of the Kumgeliem is not well constrained but is greater than 32 Ma, using the Zhong and Xia (1998b) formation boundary. The age of the Suweiyi formation
is better constrained magnetostratigraphically, with a base at 25–26 Ma and the top at 20–21 Ma, using Zhong and Xia’s (1998b) formation boundaries. The depocenter in the late Paleogene–early Miocene trended west–east along the present axis of the Quilitage anticline, which demonstrates that the Quilitage anticline was folded in the area where the basal Cenozoic sequence reached a maximum thickness (Figure 4).
The Neogene is divided into the Jidike, Kanchung, and Kuqa formations (Yin et al., 1998; Zhong and Xia, 1998a, b). The Jidike formation consists of yellowish-red and gray mudstone interbedded with gypsum, silt-stone, and medium-grained sandstone (Zhong and Xia, 1998a, b). Gypsum beds are present in the lower Jidike in the eastern Kuqa fold belt, indicating that brackish water conditions may have only existed in the eastern region during the early Jidike. We favor the interpre-tation that the Jidike formation represents a transition from a lacustrine to braided-fluvial depositional setting (Yin et al., 1998). Several depocenters of the Jidike for-mation (Figure 4) may indicate sites of shallow basins, with the deepest lake located at the eastern part of the Kuqa fold belt where the Jidike formation is up to 1600 m (5249 ft) thick. Fossils found in the Jidike formation sug-gest ages ranging from Oligocene to Miocene (Lu and Luo, 1990; Ye and Huang, 1990; Zhong and Xia, 1998a). These ages overlap with the Miocene magnetostrati-graphic ages of 21 – 15 Ma from the Jidike formation in the northern Kuqa area by Huang et al. (2006) using Zhong and Xia’s (1998b) formation boundaries. Mag-netostratigraphic data 15 km (9 mi) southward in the same sequence by Charreau et al. (2006) give an age for the top of the Jidike formation of 10.5 Ma, indicating that the formation is time transgressive and has pro-graded south. Evaporite of the Jidike formation is one of the decollement horizons in the eastern part of the Kuqa fold belt. The Kanchung and Kuqa formations are composed of thick sandstones interbedded with silt-stone and conglomerate. The entire unit is characterized by an increase in the abundance of coarse-grained sand-stone and conglomerate beds upward, probably re-flecting a dramatic increase in topographic relief of the southern Tianshan and Kuqa fold belt from Kanchung to Kuqa times. Analyses of the lithologic character and fossil assemblages of the Kanchung and Kuqa groups indicate that the Kanchung formation was deposited in a lacustrine and alluvial-fan environment and that the Kuqa formation was deposited in a fluvial environment (Ye and Huang, 1990; Yin et al., 1998).
Recent high-resolution magnetostratigraphy of Huang et al. (2006, 2008) and Charreau et al. (2006, 2008) in two locations separated by about 15 km (9 mi) in the eastern Kuqa fold belt shows that the Kanchung for-mation is time transgressive. The Kanchung forfor-mation
is 15 to 6 Ma old in the northern section of Huang et al. (2006) and 10.5 to 7 Ma old in the southern Quilitage section of Charreau et al. (2006) based on Zhong and Xia’s (1998b) formation boundaries. Therefore, the base of the Kanchung formation has prograded southward, whereas the base of the overlying Kuqa formation has prograded rapidly northward, which agrees with the rising base level suggested by the termination of the
time-transgressive growth unconformity in Figure 8b. The Kanchung and Kuqa formations are up to 1200 and 4000 m (4000 and 13,000 ft) thick, respectively (Figure 4). This implies that the sedimentation rate increased great-ly in the last 10 Ma. During Kanchung deposition, the sedimentation rate was about 0.2–0.3 mm/yr (0.007– 0.012 in./yr) (Zhong and Xia, 1998b; Charreau et al., 2006, 2008; Huang et al., 2006, 2008). The rate increased Figure 3. Isopach map of Mesozoic basins in the Kuqa area. (a) Thickness of Triassic strata with a 200-m (656-ft) contour interval. (b) Thickness of Jurassic strata with a 200-m (656-ft) contour interval. (c) Thickness of Cretaceous strata with a 200-m (656-ft) contour interval (modified from Ye and Huang, 1990).
to 0.43 mm/yr (0.01y in./yr) 10–11 m.y. (Charreau et al., 2006, 2008). The late Miocene and Pliocene depocen-ters thin northward and southward, respectively, and were located in the central part of the Kuqa fold belt extending parallel to the trend of the Baicheng syncline (Figure 4). This suggests that the Kanchung and Kuqa formations accumulated during the uplift of the north-ern and southnorth-ern Kuqa fold belt.
The younger Xiyu formation is a dark gray sequence of conglomerate with deposition starting 5 Ma ago in the northern Quilitage area (Charreau et al., 2006). It reaches a thickness of 600 m (1938 ft), interfingers with the Kuqa formation, and is locally unconformable on older formations because of fold growth (Hubert-Ferrari et al., 2005b, 2007). In the westernmost southern Tianshan, the Xiyu formation has been shown to be Figure 4.Isopach map of Tertiary basins in the Kuqa area. (a) Thickness of Eocene – lower Miocene strata with a 200-m (656-ft) contour interval. (b) Thickness of the Miocene Jidike formation with a 200-m (656-ft) contour interval. (c) Thickness of the Miocene Kanchung-Kuqa formations with a 500-m (1640-ft) contour interval (modified from Ye and Huang, 1990). 222 Wang et al.
highly time transgressive (Heermance et al., 2007). The Xiyu formation represents the conglomeratic mountain-front alluvial facies, whereas the Kuqa formation rep-resents the more distal sandy fluvial facies. The Xiyu-Kuqa facies boundary is currently just south of the thrust belt but was formerly within the area of the Yaken anti-cline just before it emerged topographically at about 0.2–0.3 ka (Hubert-Ferrari et al., 2005b, 2007).
MAJOR STRUCTURAL GEOLOGY
The major south Tianshan thrust fault that marks the topographic edge of the high Tianshan places diverse Paleozoic basement rocks of the high Tianshan Moun-tains over the Mesozoic and younger sedimentary cover of the adjacent foreland in both the easternmost Kuqa Basin extending east to Korla and in the southern Tian-shan north and west of Aksu (Figures 1, 2). In con-trast, in the central and westernmost Kuqa Basin, the basement-cover contact that marks the edge of the high Tianshan is depositional in outcrop (Figure 2) (also Hubert-Ferrari et al., 2005a). Nevertheless, the major south Tianshan basement thrust system is present in the subsurface as the fundamental structure of the northern Kuqa fold belt, as shown by a synthesis of seismic, out-crop, and well data (Figures 6–11). The southern front of this allochthonous Paleozoic in the subsurface is ap-proximately 20–30 km (10–20 mi) south of the south-ernmost Paleozoic in outcrop and underlies a relatively narrow south-dipping monocline of Mesozoic and late Paleogene strata at the southern edge of the north Kuqa fold belt (Figure 2).
The north Kuqa fold belt is characterized by several east-west–striking thrust faults and folds and also con-fines the Heiyingshan piggyback basin on its north side, which is a present-day surface topographic depo-sitional basin (Figure 2). The north Kuqa fold belt under-went multiple phases of deformation and uplift, so that Mesozoic and Tertiary strata are exposed along the belt. The main structure in the southern Kuqa fold belt is the active Quilitage anticline, which has 1200 m (4000 ft) of structural relief and is 20 – 30 km (10 – 20 mi) wide at the surface. The Quilitage anticline runs 280 km (174 mi) along strike and confines the great Baicheng topographic and sedimentary synclinal basin to the north, with only the Weigan River exiting the Baicheng basin across the Quilitage anticline, about 30 km (20 mi) west of Kuqa. Neogene and Quaternary strata are ex-posed within the Quilitage anticline. The Yaken anti-cline, 10 km (6 mi) south of the Quilitage anticline in the eastern Kuqa fold belt, is an active fold with beds dipping only a few degrees on both sides of the Qua-ternary surface (Hubert-Ferrari et al., 2005b, 2007).
This anticline for about 100 km (60 mi) along strike marks the southern edge of the eastern Kuqa fold belt (Figures 2, 4).
Evaporites (gypsum and halite) are widely exposed in the western Kuqa fold belt along the eastern Awate, Tuzimaza, Kumgeliem, and Kasangtuokai anticlines (Figure 5). Exploration wells have also penetrated mas-sive salt in the cores of many anticlines in the Kuqa fold belt, including the Dawanqi, Miskantag, Kasangtuokai, Bashijiqike, and western Quilitage anticlines. Two major evaporitic horizons in the Kuqa fold belt are observed. One is located in the Miocene Jidike formation in the eastern Kuqa fold belt, and the other is located in the Paleogene Kumgeliem formation in the western Kuqa fold belt (Figure 5). These formations represent the main shallow decollement horizon in the southern Kuqa fold belt and are consistent with the interpreted seismic sec-tions (Figures 6 – 11). The lower decollement horizon developed in the northern part of the Kuqa fold belt is mostly within the Middle Jurassic mudstone and coal beds. The interpretation of seismic profiles shows that thrusts in the northern part of the Kuqa fold belt are located at this Jurassic level and that the rocks exposed in the cores of these anticlines in this area are Creta-ceous and older (Figures 6 – 11).
Several regional profiles have been constructed across strike (Figures 6–11) constrained by two-dimensional seismic reflection profiles, well data, and surface ge-ology. They provide the simple interpretations of the locally complex Cenozoic deformation of the Kuqa fold belt based on available surface and subsurface con-straints. In the Kuqa fold belt, lateral velocity var-iations are anticipated due to the thrusting of high-velocity rocks from deeper to shallower positions and facies changes along strike. Interval velocities, deter-mined from sonic logs and seismic stacking veloci-ties, were used to depth convert seismic profiles by techniques of Suss and Shaw (2003). These velocities were used along with well data to determine the tops and thicknesses of different stratigraphic units of the Kuqa fold belt.
Eastern Part of the Kuqa Fold Belt
The Tuger, Yiqikelike, Jidike, eastern Quilitage, and Yaken anticlines are located in the eastern area of the Kuqa fold belt (Figure 2). We present two cross sections through the area. The eastern section (Figure 6) passes through the Yiqikelike anticline, the eastern tip of the eastern Quilitage anticline, and the eastern Yaken anti-cline. The western section (Figure 7) passes through the Jidike, eastern Quilitage, and western Yaken anticlines. Along the eastern section (Figure 6), the Yiqikelike anticline is interpreted as a fault-propagation fold above
Figure 5.Isopach map of evaporites in the Miocene Jidike formation and in the Oligocene – Miocene Kumgeliem formation in the Kuqa area. Thickness of evaporites with an 800 – 600-m (2625 – 1968-ft) contour interval. (1) Tuger anticline, (2) Yiqikelike anticline, (3) Jidike anticline, (4) Bashijiqike anticline, (5) Kumgeliem anticline, (6) Kasangtuokai anticline, (7) Tuzimaza anticline, (8) Dawanqi anticline, (9) eastern Quilitage anticline, (10) Kuqadawu anticline, (11) southern Quilitage anticline, (12) northern Quilitage anticline, (13) Miskantag anticline, (14) eastern Awate anticline, (15) Kalayuergun anticline, (16) Yaken anticline (modified from Ye and Huang, 1990). Fm. = formation.
224
Wang
et
three imbricate thrust sheets that are stacked vertical-ly by break-forward propagation. The steepvertical-ly north-dipping imbricate faults are detached along the Middle Jurassic mudstone and coal beds and were encountered at measured depths of 1600, 2450, and 3239 m (5249, 8038, and 10,627 ft) in the YS4 well. Middle Jurassic strata, Yangxi and Kezilenuer formations, were repeated three times in the core of the Yiqikelike anticline where the Yiqikelike oil field was discovered in 1964. A buried anticline, here called the south Yiqikelike anticline, and the eastern tip of the eastern Quilitage anticline are lo-cated south of the Yiqikelike anticline (Figure 6). The south Yiqikelike anticline is a basement-involved fold, which is indicated by penetration of Carboniferous strata at the bottom of the YN2 well. The region of poor seismic data quality at and below the bottom of the well is interpreted as Paleozoic basement rocks that move upward along a north-dipping thrust ramp. The YN2 well penetrated Tertiary, Cretaceous, Jurassic, Triassic, and Carboniferous strata and encountered two minor faults at depths of 2850 and 4100 m (9350 and 13,451 ft). The eastern Quilitage anticline is interpreted as an asym-metric breakthrough fault-propagation fold with a steep and narrow forelimb and a long, planar backlimb. The forelimb was cut by a north-dipping reverse fault, which soles into evaporates of the Miocene Jidike formation, which detach this fold from deeper structure. Below the Jidike detachment, older Jurassic, Triassic, and Eocene strata have been folded, creating the structure of the Dina gas field discovered in 2001 (Figure 6). The Yaken anticline, which is the southernmost active structure, is a detachment fold above the Jidike evaporates (Hubert-Ferrari et al., 2005b; Gonzalez-Mieres and Suppe, 2006, 2011).
The interpretation of the east Kuqa profile (Figure 7) shows three north-dipping reverse faults rooting in the Paleozoic basement in the northern part of the profile. The thrust faults give rise to a broad anticline and a large amount of structural relief in the near-surface sec-tion (Figure 7). The Paleozoic basement rocks moved upward, and Triassic, Jurassic, and Cretaceous strata are exposed at an elevation of 2000 m (6500 ft) above sea level. The Jidike anticline is a hanging-wall fold above the south-dipping backthrust faults where Cre-taceous and Tertiary strata were highly dissected and de-veloped a large monocline structure (Figure 7). A major buried thrust ramp, now folded to horizontal, accounts for the large change in stratigraphic thickness across the syncline between the Jidike and Quilitage anticlines. The eastern Quilitage anticline has a box shape at the surface. The south limb of the anticline is narrow and steep, with a dip of 70 to 808, developing several breaking thrusts in it, with horizontal strata on its crest. The north limb of the anticline is long and gentle, with a 50 to 608
dip. The subsurface structure of the eastern Quilitage is composed of two structural levels bounded by detach-ments: (1) a deep thrust ramp that steps up southward from a 9-km (5.5-mi)-deep lower detachment level in Upper Jurassic coal horizons and flattens to a 5-km (3-mi)-deep upper detachment in evaporates of the Miocene Jidike formation, producing a fault-bend fold anticline with limb dips of 10–158 above the deep thrust ramp; and (2) an overlying complex wedging system that produces the steep dips of the surface anticlinal core (Figure 7). The Yaken anticline, which occurred at the south of this section, is a detachment fold; the decolle-ment fault underlying the anticline is nearly horizontal, without a ramp of thrust, sliding along the gypsum and shale layers of the Miocene Jidike formation (Figure 7). The Quilitage upper detachment level extends to the south and corresponds to the Yaken basal detachment. Slip on the deep ramp (!5 km [3 mi]), plus deeper folding of the fault, has generated a 7- to 8-km (4- to 5-mi)-wide north-dipping kink band imaged in the seismic profile (Figure 7). The shallower structure of Quilitage is necessarily complex because Yaken, which is located above the same Jidike detachment, has con-sumed only 1.2 km (0.7 mi) of the 5-km (3.1-mi) slip coming from the deep ramp of Quilitage. The remain-ing 3.8 km (2.4 mi) is wedged back in the anticlinal core of Quilitage. Above the deep ramp, additional wedging occurs at a shallower level in the anticlinal core, located at the intersection between the back thrust and an up-per bedding-parallel detachment level. At this shal-lower wedge tip, the thrust system splits into two main faults. The upper thrust reaches the surface in the south limb of Quilitage. Slip on the lower thrust is consumed in folding. Additional deep detachment folding and as-sociated wedging in the north syncline completes the slip budget of Quilitage.
Central Part of the Kuqa Fold Belt
North-dipping imbricate thrust faults and roughly west-east–striking folds are interpreted in the northern part of the center of the Kuqa fold belt (Figures 2, 8, 9). The long profile in Figure 8a has been interpreted as three imbricate thrust faults and duplex wedges near the southern Tianshan deformation front. This area under-went multiple phases of deformation and experienced more uplift than the southern part of the Kuqa fold belt, exposing Mesozoic and Tertiary strata along the belt. To the south, Tertiary strata are preserved within the cores and limbs of Bashijiqike and Kasangtuokai anticlines. These anticlines are interpreted as fault-propagation folds with the detachment being along the gypsum and shale of the Paleogene Kumgeliem formation. The KL3
well penetrates the detachment fault (Figure 8a). The Kuqatawu anticline, which represents a transverse jog in the Quilitage anticline belt, is a tight fold, con-sisting of steep strata in the core and gentle dip strata in the limbs. From seismic reflection data, the anticline is dominated by the south-dipping back thrust in the forelimb, developing in the Miocene Jidike formation, similar to other sections through the central Quilitage anticline (Figure 9) (Hubert-Ferrari et al., 2007, their figures 14, 16). The deeper levels of the anticline are
interpreted to have two fault-bend folds, whose lower detachment fault is in the coal bed at the base of the Jurassic and whose upper detachment fault is located in the gypsum layer of the Paleogene Kumgeliem for-mation. The ramps of the faults cut upward through the Jurassic, Cretaceous, and Paleogene strata. Slips on the two deep ramps have generated 4 – 5-km (2.5 – 3-mi)-wide north-dipping kink bands imaged in the seismic profile. The Tukelaketan anticline, one of the two deeper anticlines, has surface expression.
Figure 6. (a) Uninterpreted and (b) interpreted depth-converted 2-D seismic profile across the Yiqikelike, south Yiqikelike, eastern Quilitage, and Yaken anticlines. Horizontal scale equals vertical scale. The profile is located on Figure 2. N2k = Pliocene –
Pleistocene Kuqa formation; N1k = Miocene Kanchung formation; N1j = Miocene Jidike formation; Nks = Oligocene–Miocene
Kumgeliem and Suweiyi formations; K = Cretaceous; J2-3= Middle – Upper Jurassic; J3= Upper Jurassic; J2= Middle Jurassic;
J1= Lower Jurassic; T = Triassic; Pz = Paleozoic; s.l. = sea level; S = Silurian; D = Devonian; C = Carboniferous; S. = Southern;
ant. = anticline. 226 Wang et al.
The structure of profile in Figure 9 has been inter-preted to be composed of three imbricate thrust faults and duplex wedges near the southern Tianshan defor-mation front. The thrust faults slip southward along the gypsum and shale of the Paleogene Kumgeliem for-mation and cut upward through the Tertiary strata. The Kumgeliem and Kasangtuokai anticlines, developed on the ramps of the thrust faults, are interpreted as fault-propagation folds. The salt wall is interpreted to have developed in the footwall of the shallow thrust faults. The imbricate system beneath the salt wall was formed by break-forward propagation of thrust sheets that are suggested to terminate in the salt wall. Several deeper folds have been interpreted to develop in the Mesozoic strata. A pop-up structure is expressed as an anticline bounded by forward and back thrust underlying the
Kasangtuokai anticline (Figure 9). A huge natural gas field (Kela gas field) with more than 200 billion m3(7.06 tcf) of natural gas was discovered in this structure in 1998. The south Quilitage anticline is a salt-cored detachment fold with a high-angle reverse fault on the crest. The fold is interpreted to be cored by the autochthonous Paleogene Kumgeliem salt. Thickened salt was pene-trated by the XQ2 well, with the thickness of salt un-der the fold crest estimated at 3000 – 4000 m (10,000 – 13,000 ft) (Figure 9). The crest of the fold has been cut by a northern vergent bedding-parallel reverse fault, similar to other sections through the central Quilitage anticline (Figure 8a) (also see Hubert-Ferrari et al., 2007, their figures 14, 16). Growth strata (yellow dashed lines on Figure 9) are interpreted to be deposited on both flanks of fold, which shows the salt-cored detachment Figure 6. (cont.).
fold and associated reverse faults of the south Quilitage anticline developed principally during the Pliocene and Quaternary.
Western Part of the Kuqa Fold Belt
The dominant structure north of the western Kuqa fold belt is a south-dipping monocline that overlies the north-dipping reverse faults in the Paleozoic basement (Figures 10, 11). The southern part of the western Kuqa fold belt is interpreted to have developed massive salt structures. Salt can be seen at the surface along the thrust faults that cut the backlimb (north limb) of the Miskantag anticline and adjacent to the eastern Awate and Tuzimaza anticlines (Figure 5). The massive salt has been drilled in the cores of these anticlines by exploration wells
(Figures 11, 12). An east-west– striking compressed salt wall involving the Paleogene Kumgeliem formation is interpreted to develop underlying the Tuzimaza anti-cline. Diapiric ridges are exposed along the Tuzimaza anticline and between the Tuzimaza anticline and the south Tianshan mountain front (Figures 5, 10). Several north-dipping reverse faults are interpreted to develop beneath the diapirs. The Dawanqi, southern Quilitage, northern Quilitage, and Miskantag anticlines are in-terpreted to be cored by Paleogene Kumgeliem salt (Figures 10, 11). The Dawanqi anticline is a symmetric salt-cored fold. However, the north limb of the fold is interpreted to be uplifted by an underlying structure in the Paleozoic basement. The imbricate system beneath the fold was formed by break-forward propagation of the thrust sheets consisting of Mesozoic strata. The growth Figure 7. (a) Uninterpreted and (b) interpreted depth-converted 2-D seismic profile across the Jidike, eastern Quilitage, and Yaken anticlines. Interpretation is based on Hubert-Ferrari and Suppe (He and Suppe, 2005, p. 12) and Hubert-Ferrari et al. (2007). Horizontal scale equals vertical scale. The profile is located on Figure 2. N2k = Pliocene – Pleistocene Kuqa formation;
N1k = Miocene Kanchung formation; N1j = Miocene Jidike formation; Nks = Oligocene – Miocene Kumgeliem and Suweiyi
formations; K = Cretaceous; J = Jurassic; s.l. = sea level; T = Triassic; Pz = Paleozoic; Ord = Ordovician; E. = Eastern. 228 Wang et al.
strata (shown by dashed lines) thin onto the fold crest fanning out on both flanks of the fold (Figure 10). The characteristics of the growth strata imply that the Da-wanqi anticline was formed by limb rotation (Poblet et al., 1997). Growth strata, consisting of Pliocene and Quaternary strata, constrain the timing of formation of the Dawanqi anticline. Exploration wells discovered oil and gas in the shallow beds of the Dawanqi anticline (DW1 well) and the thrust sheets underlying the salt bed at the bottom of Tertiary strata (DB2 well).
The southern and northern Quilitage anticlines are two adjacent tight folds at surface. Seismic lines show that the two anticlines are linked at depth by a broad, salt-cored fold consisting of Paleogene Kumgeliem salt (Figure 10). The anticline has a narrow steep forelimb dipping 70 to 808 and a long planar backlimb consisting of Neogene and Quaternary strata dipping 40 to 208. The crest of the anticline has been cut by a south-vergent high-angle reverse fault zone. Syntectonic growth strata (yellow dashed lines on Figure 10) have deposited on
both flanks of the fold in the upper Pliocene and Pleis-tocene section. The deeper growth strata are thinned and deformed on the forelimb.
The structural profile of Figure 11 is located at the west end of the Kuqa fold belt, showing the Miskantag anticline and a major thrust fault that cuts the backlimb of the Miskantag anticline. These structures are part of the Quilitage anticline belt (Figure 2). The Miskantag anticline, consisting of the Tertiary strata, is a broad, salt-cored asymmetric fold with a long, gentle back-limb and a steeper, faulted foreback-limb. The continuous relatively flat basement that underlies the fold and the lack of an obvious thrust ramp beneath the fold indi-cate that the structure is a detachment fold dominated by ductile thickening of the Paleogene Kumgeliem salt in the core of the fold, with withdrawal from the adja-cent syncline to the north. The growth strata (yellow dashed lines on Figure 11) deposited and deformed on the forelimb of the fold. The thrust fault that cut the backlimb of the Miskantag anticline is a north-dipping Figure 7. (cont.).
Figure 8.(a) Interpreted depth-converted 2-D seismic profile across the Bashijiqike, Kasangtuokai, Tukelaketan, and Kuqadawu anticlines. Horizontal scale equals vertical scale. The profile is located on Figure 2. (b) Seismic profile shows unconformities and growth strata developed in syncline (from Suppe in He and Suppe, 2005, p. 12). Q1x = Pleistocene Xiyu formation; N2k =
Pliocene–Pleistocene Kuqa formation; N1k = Miocene Kanchung formation; N1j = Miocene Jidike formation; Nks = Oligocene–
Miocene Kumgeliem and Suweiyi formations; K = Cretaceous; J = Jurassic; T = Triassic; s.l. = sea level; Pz = Paleozoic; F1–F3 = faults. 230 Wang et al.
fault with at least a displacement of 22 km (14 mi) (aa0, Figure 11). The fault is detached above a Paleo-gene Kumgeliem allochthonous salt nappe. Massive salt crops out along the fault (Figures 5, 11).
TIMING OF STRUCTURAL EVENTS
A late Oligocene or Miocene age of initiation of Ceno-zoic structuring in the southern Tianshan and Kuqa fold belt has been proposed previously based on several indirect indications (e.g., Hendrix et al., 1994; Lu et al.,
1994; Sobel and Dumitru, 1997; Yin et al., 1998; Charreau et al., 2006, 2008; Huang et al., 2006, 2008; Sobel et al., 2006). These indications include the appearance of de-tritus that record the uplifting and eroding basement of the high Tianshan, including fission track and mag-netic susceptibility anisotropy data and stratigraphic facies transitions. Here we report on observations of syn-tectonic growth unconformities and growth strata that allow us to determine ages of specific early structural events north of Kuqa, making use of magnetostrati-graphic data discussed previously to constrain the ages of syntectonic growth strata. Later structural timing in Figure 9.(a) Uninterpreted and (b) interpreted depth-converted 2-D seismic profile across the Bashijiqike, Kasangtuokai, and south Quilitage anticlines. Horizontal scale equals vertical scale. The profile is located on Figure 2. Yellow dashed lines show growth strata. N2k = Pliocene – Pleistocene Kuqa formation; N1k = Miocene Kanchung formation; N1j = Miocene Jidike
formation; Nks = Oligocene – Miocene Kumgeliem and Suweiyi formations; K = Cretaceous; J = Jurassic; T = Triassic; Mz = Mesozoic; Pz = Paleozoic.
the Quilitage and Yaken anticlines is documented by Hubert-Ferrari et al. (2007). Elsewhere in the Kuqa fold belt, structural timing is constrained by growth strata imaged in the regional profiles (Figures 6 – 11).
In the northern Kuqa River area, time-transgressive growth angular unconformities have been found in as-sociation with growth strata in a fold limb south of the southern Tianshan front. Such unconformities have fold axial surfaces terminating at the two ends of an uncon-formity, indicating deposition during kink-band migra-tion at a low sedimentamigra-tion rate relative to uplift rate. At higher sedimentation rates, growth axial surfaces appear as shown in Figure 12. The general principles of such growth structures are given by Suppe et al. (1991, 1997). The growth structures are shown in a progressively deformed syncline shown in Figure 8b. The thickness
of the strata decreases northward, as indicated by the thickness variation of the late Paleogene and Neogene sequence, which is 3– 4 km (1.9– 2.5 mi) in the southern limb of the syncline and only several hundred meters on the northern limb (Figure 8b). The oldest unconfor-mity observed to date in the Kuqa thrust belt records growth during deposition of the late Oligocene –early Miocene Suweiyi formation (Figure 8b). A hiatus in de-formation during the Jidike (20–21 Ma to!15 Ma) with-in this structure above this unconformity is observed, as shown by the constant thickness of the Jidike strata across the structure (Figure 9b). Growth resumed and was continuous during deposition of the Kanchung and lower Kuqa formations (!15 to <6 Ma) as shown by the development of a synclinal growth axial surface across which a large change in thickness is observed (Figure 8b). Figure 9. (cont.).
Within this growth sequence, a time-transgressive growth angular unconformity that offsets two segments of the synclinal growth axial surface is observed (Figure 8b). This unconformity indicates a period of lower sedimen-tation rate relative to deformation rate, followed by a relatively higher sedimentation rate. This increased relative sedimentation rate that terminates the uncon-formity may correlate with the increase in sedimenta-tion rate in the east Kuqa Basin at 10–11 Ma (Charreau et al., 2006, 2008). The uppermost stratigraphy records a hiatus or near-hiatus in deformation as evidenced by the nearly constant stratal thicknesses. These youngest
strata are folded, recording a more recent resumption of deformation in this structural trend. The synclinal axial surface to the south deforms terrace gravels and is there-fore presently active. Thus, we see a very long history of deformation recorded in this single complex synclinal structure, extending from the Oligocene to the present with two pronounced hiatuses in deformation that are at least local.
Growth strata containing a synclinal growth axial surface have been imaged in the front limb of the Kasangtuokai anticline 30 km (19 mi) to the southwest (Figures 9, 12). The boundary between growth and pre-Figure 10. (a) Uninterpreted and (b) interpreted depth-converted 2-D seismic profile across the Tuzimaza, Dawanqi, and southern and northern Quilitage anticlines. Horizontal scale equals vertical scale. The profile is located on Figure 2. N2k =
Pliocene –Pleistocene Kuqa formation; N1k = Miocene Kanchung formation; N1j = Miocene Jidike formation; Nks = Oligocene–
Miocene Kumgeliem and Suweiyi formations; K = Cretaceous; J = Jurassic; Mz = Mesozoic; Pz = Paleozoic; T = Triassic; S. = Southern; N. = Northern. Yellow dashed lines show the fan-dipping growth strata in the Kuqa formation.
growth strata is located within the Miocene Kanchung formation and extends well up into the Kuqa formation (Figure 12), which implies that the Kasangtuokai anti-cline grew from approximately 8– 10 to less than 3 Ma. The anticlinal growth may correlate with the upper un-conformity in the northern syncline (Figure 8b). Growth strata developing in the northern and southern limbs of the Dawanqi anticline imply that the Dawanqi anticline developed during the post approximately 3-Ma depo-sition of the upper Kuqa formation (Figure 10b).
Growth strata of the eastern Quilitage anticline and the Yaken anticline are within the Pliocene–Pleistocene Kuqa formation with an age of about 5.5 Ma for the boundary between the pregrowth and growth strata, corresponding to the time of propagation and initiation of slip on the thrust system that underlies both the Yaken
and Quilitage anticlines (Hubert-Ferrari et al., 2007) (Figure 7). The present topographic emergence of the Quilitage and Yaken anticlines is quite recent (!0.2 – 0.3 Ma) associated with a large acceleration of shorten-ing rate in this system, as documented by Hubert-Ferrari et al. (2007). The growth history of the Yaken anticline is also discussed by Gonzalez-Mieres and Suppe (2011). We demonstrate that the emplacement of the thrusts and fault-related folds propagated southward in the Kuqa fold belt. Near the mountain front, Mesozoic and Paleogene strata were involved in deformation related to thrusting and folding since approximately 25 Ma. To-ward the southern edge of the Kuqa fold belt, strata in the Quilitage and Yaken anticlines began folding above a newly propagated thrust system about 5.5 Ma. The river network and alluvial fans are also deformed in this area. Figure 10.(cont.).
TECTONIC MODEL OF THE KUQA FOLD BELT
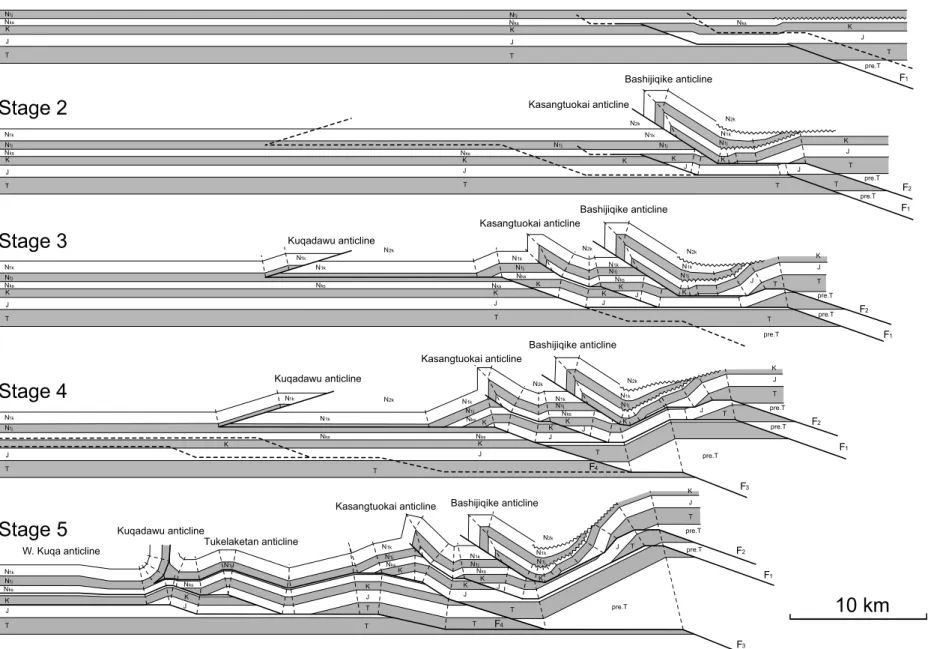
A forward kinematic model shows the interpreted evo-lution of the Cenozoic structure in the Kuqa river area of the central Kuqa fold belt (Figure 13). This model represents a simplified approximation to the structure in the seismic profile in Figure 8.
Stage 1
Fault 1 forms, and slip produces the kink band that defines the early Suweiyi growth in Figure 8b below a time-transgressive growth unconformity of the sort de-scribed by Suppe et al. (1991, 1997). Fault 1 is a
multi-bend fault with two north-dipping ramps and two de-collement zones; the upper dede-collement zone is the Oligocene Kumgeliem formation, and the lower zone is near the top of the Jurassic mudstone and coal se-quence. Based on the width of the kink bands, dis-placement on fault 1 is less than 1 km (0.6 mi) at this stage. A hiatus in growth during Jidike deposition, prior to stage 2, is observed.
Stage 2
Following a hiatus in slip on fault 1 during Jidike de-position, fault 2 developed above fault 1 to form two ramp folds, the incipient anticline of the southern Figure 11.(a) Uninterpreted and (b) interpreted depth-converted 2-D seismic profile across the northern Kuqa fold belt and the Miskantag anticline. Horizontal scale equals vertical scale. The profile is located on Figure 2. N2k = Pliocene – Pleistocene
Kuqa formation; N1k = Miocene Kanchung formation; N1j = Miocene Jidike formation; Nks = Oligocene – Miocene Kumgeliem
and Suweiyi formations; J = Jurassic; T = Triassic; K = Cretaceous; Mz = Mesozoic; Pz = Paleozoic. Yellow dashed lines show the growth strata in the Kuqa formation.
Tianshan front and the Bashijiqike anticline in the hang-ing wall. The thinnhang-ing of Miocene and Pliocene rocks northward in the syncline between these anticlines shows that the structural growth of the southern Tianshan front was synchronous with Kangchung and Kuqa depo-sition. We find two time-transgressive angular unconfor-mities (shown by wavy lines) in the growth strata wedge, an older one forming during the Suweiyi growth and a younger one during a period of lower sedimentation-to-uplift rate within a continuous growth interval during Kanchung and Kuqa deposition (see Suppe et al., 1991, 1997, for an explanation of such growth structures). Displacement on fault 2 is about 4 km (2.5 mi) (Figure 8a).
Stage 3
Fault 1 was reactivated in the late Miocene. Displace-ment on the lower fault 1 refolded the shallower fault 2
and the beds in its hanging wall. The Kasangtuokai anticline and the unnamed anticline, underlying the Bashijiqike anticline, develop in the hanging wall of fault 1. Part of the slip in the fault 1 system exits to the surface in the back thrust within the Kuqadawu anti-cline to the south. Displacement on fault 1 is about 5 km (3.1 mi) (Figure 8a).
Stage 4
In the Pliocene, slip on the fault 3 ramp generated a large uplift composed of Paleozoic and Triassic rocks, which refolded and uplifted the shallower early faults and anticlines. Fault 3 joins the fault 1 system updip at this stage, stepping up to a shallower detachment in the Jidike formation and amplifying a previous fault-bend fold in the hanging wall. Displacement on fault 3 is about 4 km (2.5 mi) (Figure 8a).
Stage 5
At this stage, slip on the deep fault 3 transfers to a newly propagated fault 4 system and slip produces the lower fault-bend folds in the hanging wall that also refold shallow fault 1. The Tukelaketan anticline is an imbri-cate fault-bend fold north of a deep fault-bend fold be-low the Kuqadawu anticline. Slip on these two fault-bend folds terminates southward within the frontal west Kuqa anticline. Displacement on fault 4 is about 6 km (3.7 mi) (Figure 8a).
SHORTENING RATE OF THE KUQA FOLD BELT
The minimum shortening across the Kuqa fold belt es-timated along our six regional sections (Figure 2) ranges from about 12 km (7.4 mi) in the east to 26 km (16 mi) in the west (Figures 6 – 11). We assume that deformation regionally began in the late Oligocene near the begin-ning of Suweiyi deposition (25–26 Ma), as locally doc-umented by the growth strata in Figure 8b. This yields an average minimum long-term shortening rate of about 0.5 mm/yr (0.019 in./yr) in the east, 0.6 mm/yr (0.023 in./yr) near Kuqa, and 1.0 mm/yr (0.039 in./yr) in the westernmost Kuqa fold belt. Available data in the east Kuqa fold belt and from regional geodetic con-straints indicate that the shortening rate has accelerated substantially toward the present, as outlined below. We find that the average shortening rate of 0.5–1.0 mm/yr (0.019 – 0.039 in./yr) since 25 – 26 Ma represents the
sum of a much slower early average minimum shorten-ing rate and a much faster recent rate.
The basal thrust system that underlies the Quilitage and Yaken anticlines, with a total slip of 6 km (3.7 mi), propagated about 5.5 Ma as shown by analysis of growth strata (Hubert-Ferrari et al., 2005b, 2007; Gonzalez-Mieres and Suppe, 2011), yielding an average slip rate of 1.1 mm/yr (0.043 in./yr). However, from 5.5 and 0.16–0.21 Ma, the shortening rate in the Yaken anticline was close to constant at 0.16 mm/yr (0.006 in./yr), which is about an order of magnitude slower than the average rate. During this period, the Yaken anticline was continuously buried by deposition. The shortening rate accelerated by about an order of magnitude to 1.2– 1.6 mm/yr (0.047– 0.062 in./yr) about 0.16–0.21 Ma, leading to topographic emergence. The Quilitage anti-cline underwent a similar acceleration and topographic emergence as shown by geomorphic analysis (Hubert-Ferrari et al., 2007). The total shortening rate of the Yaken-Quilitage system was about 0.6 mm/yr (0.023 in./yr) prior to acceleration and about 4 – 5 mm/yr (0.157 – 0.196 in./yr) since emergence. Thus, about half of the shortening has occurred in the late Quaternary since emergence.
Shortening of the western Kuqa fold belt is less con-strained because of the flow of salt that contributes sig-nificantly to structural relief in this part of the Kuqa fold belt. It is likely that the evaporite deformation cannot be correctly restorable by 2-D analysis and is less clearly related to horizontal shortening. However, the thrust fault imaged on the backlimb of the Miskantag anti-cline shows that the minimum slip of the fault must be Figure 12. (a) Uninterpreted and (b) interpreted seismic profile showing growth strata developed in the front limb of the Kasangtuokai anticline. The boundary between pregrowth and growth strata at the middle of the Miocene Kanchung formation. The location of the profile is shown in Figure 2. N2k = Pliocene – Pleistocene Kuqa formation; N1k = Miocene Kanchung
formation; N1j = Miocene Jidike formation; Nks = Oligocene – Miocene Kumgeliem and Suweiyi formations. s = seconds.
Figure 13.Simplified sequential model of the Kuqa profile (Figure 8) showing the progressive development of Cenozoic structures in the Kuqa fold belt (see Figure 2 for the location of the profile. N2k = Pliocene – Pleistocene Kuqa formation; N1k = Miocene Kanchung formation; N1j = Miocene Jidike formation; Nks = Oligocene –
Miocene Kumgeliem and Suweiyi formations; K = Cretaceous; J = Jurassic; T = Triassic; pre.T = pre-Triassic; ant. = anticline; W. = Western; F1 – F4 = faults. See the text for discussion. Structure and Tectonic Evolution of the Kuqa Fold Belt, Southern Tianshan, China 239
greater than the preserved length of the hanging-wall sheet, at least 22 km (14 mi) (aa0, Figure 11b). The growth strata, as indicated by the systematic decrease in dip angle as the strata become younger, were deposited during thrusting on the northern limb of the syncline that developed in the hanging wall of this thrust fault (Figure 11b). The oldest age of the growth is within the Kuqa formation (starting 7 Ma ago) placing constraints on the age of this thrust faulting. The minimum short-ening rate of this fault, which is the principal structure of the southern part of the western Kuqa fold belt, is estimated to be approximately 3 mm/yr.
The observations from the eastern Kuqa fold belt, as discussed above, of a late Quaternary acceleration short-ening rate to about 5 mm/yr (0.196 in./yr) in the frontal structures are in agreement with more regional geodetic measurements of shortening across the southern Tian-shan. Wang et al. (2001, their appendix) presented data that indicate a present shortening rate of about 10 mm/yr (0.393 in./yr) between four stations in the Aksu region and two stations in the upper Yili River Basin near Yining (Figure 1), of which approximately 9 mm/yr (0.354 in./yr) is the north– south component and 2–3 mm/yr (0.078–0.118 in./yr) is the eastward component. This present geodetic rate, which corresponds to about 10 km/ Ma (6.2 mi/Ma), contrasts strongly with the approxi-mately 25 Ma beginning of deformation in the southern Tianshan and a long-term shortening rate of about 1 km/ Ma (0.6 mi/Ma) until the late Quaternary. The present geodetic rate could not have been sustained for 25 Ma because the implied shortening would be excessive.
STRUCTURAL ASPECTS OF PETROLEUM POTENTIAL
Numerous gas fields have been discovered in Kuqa fold belt anticlines, including the Kela gas field, which is a relatively deep pop-up structure developed under-lying the Kasangtuokai anticline in the central Kuqa fold belt; the Dabei gas field, which is a deeper structure be-neath the Tuzimaza anticline in the western Kuqa fold belt; and the Dina gas field, which is a relatively deep fold un-derlying the shallow fold of the eastern Quilitage anticline. Based in part on the interpretations presented here, the Tuzimaza, Kasangtuokai, and eastern Quilitage area is considered to possess the most hydrocarbon potential, with relatively deep anticlines underlying shallow thrust sheets being the primary targets for future exploration. In the Tuzimaza, Kasangtuokai, and eastern Quili-tage area, the deeper structure exhibits imbricate thrust sheets beneath the salt wall (diapir). Such complex struc-tures offer substantial and difficult challenges to deter-mine the geometry and kinematics of thrust faults and
folds. Some difficult questions such as the effect of the ductile deformation of salt layers in an imbricate system, multiple deformations of thrust faulting and folding, cross sections balancing, and three-dimensional model restoration of complex imbricate thrust and fold with salt cores require further investigation. Different mod-els of the deeper folds would influence any petroleum prospects in the Kuqa fold belt.
DISCUSSION AND CONCLUSIONS
In this chapter, we describe the Cenozoic deformation and structural evolution of the Kuqa fold belt based on 20,000 km (12,000 mi) of 2-D seismic reflection profiles, detailed field measurements, and well data for several tens of exploration wells, which provide a more accurate quantitative picture of the geometry and kinematics of thrusts and folds along the southern piedmont of Tianshan than was available before. We defined the timing and rate of deformation of Miocene, Pliocene, and Pleistocene structures and discussed the tectonic evolution of the Kuqa fold belt.
The Kuqa fold belt is overridden from the north by a thrust system of Paleozoic rocks of the southern Tianshan that developed in the form of the basement thrust sheets and wedges that telescoped and thrust southward along the north-dipping reverse faults. Triassic cover rocks are extensively exposed in the hanging walls of these struc-tures. Mesozoic and Paleogene strata are involved in the southward-dipping monocline that marks the southern limit of the basement duplication in the subsurface.
The Kuqa fold belt is characterized by a series of east-west–striking thrust faults and folds of Mesozoic– Cenozoic rocks. The thrusts are localized at two major decollement horizons with the shallow one located at salt-gypsum layers of the Oligocene Kumgeliem for-mations in the western part of the Kuqa fold belt and early Miocene Jidike formations in the eastern part of the Kuqa fold belt and the lower decollement in the Middle Jurassic mudstone and coal beds. Break-forward thrusts and duplex structure developed in the northern Kuqa fold belt, just in front of the southern Tianshan. At the surface, fault-propagation folds are exposed and Meso-zoic and Tertiary are involved in deformation. Deeper blind thrust faults, formed by break-forward propaga-tion of the thrust sheets consisting of Mesozoic strata, develop underlying the shallow thrust faults. Salt had apparently flowed into the core of the folds. Syntectonic growth strata have been deposited in the late Oligocene (25–26 Ma) and Neogene section.
The 230-km (140-mi)-long Quilitage anticline is a complex structure. The eastern Quilitage anticline shows
an imbricate system consisting of a shallow box fold with a wedging core, and a fault-bend fold developed on a deeper thrust ramp. Westward, the Quilitage anticline developed to be cored by the autochthonous Paleogene Kumgeliem salt. Growth strata on the two limbs of the Quilitage anticline have deposited in the Pliocene and Quaternary sections. The Yaken anticline, 10 km (6 mi) south of the Quilitage anticline, is an active fold that began growth at about 5.5 Ma, with beds dipping only a few degrees on both sides of the Holocene surface.
The emplacement of the thrusts and fault-related folds propagated southward gradually and episodically in the Kuqa fold belt. Near the mountain front, Meso-zoic and Paleogene strata are involved in the deforma-tion starting at 25–26 Ma. Toward the south, Miocene and Pliocene strata are folded in the Quilitage and Yaken anticlines starting at about 5.5 Ma.
Restoration of balanced cross section suggests that the minimum shortening across the central Kuqa fold belt was more than 16 – 19 km (10 –12 mi). Shortening began locally at approximately 25 –26 Ma, yielding a long-term minimum average shortening rate of about 0.6 mm/yr (0.023 in./yr). The starting time of growth of the Quilitage and Yaken anticlines is about 5.5 Ma with a total shortening of about 6 km (3.7 mi), which yields an average shortening rate of about 1.2 – 1.6 mm/yr (0.047–0.062 in./yr). Studies of growth strata and land-scape folding show that slip on the Quilitage-Yaken thrust system accelerated in the late Quaternary to about 4–5 mm/yr (0.157–0.196 in./yr) (Hubert-Ferrari et al., 2007). Calculated shortening rates indicate that the de-formation became faster and that the crust underwent massive shortening since the late Pliocene in the Kuqa area. This acceleration is in agreement with more re-gional present-day geodetic shortening of approximate-ly 10 mm/yr (0.393 in./yr) across the southern Tianshan just west of the Kuche basin, which could not have been sustained for long given the approximately 25–26 Ma beginning of deformation.
ACKNOWLEDGMENTS
This research was funded by the Tarim Oilfield Com-pany of PetroChina, the China National Science Fund (grants 49972077 and 40372090), the U.S. National Sci-ence Foundation (grant EAR-0073759), Princeton Uni-versity 3-D Structure Project, and the Swiss National Science Foundation (grant SNSF20020-101781). This re-search would have been impossible without the coop-eration of the Tarim Oilfield Company that provided seismic and well data and supported our field work. We are particularly grateful to Lu Huafu of Nanjing
Uni-versity and Wang Zhaoming, Pi Xuejun, Li Qiming, Xie Huiwen, Pen Genxin, and Lei Ganlin of Tarim Oilfield Company for their hospitality and support of this work. Suppe is grateful for the hospitality of the Ludwigs-Maximillian University Munich and support of the Alexander Von Humboldt Foundation during the prep-aration of this manuscript.
REFERENCES CITED
Allen, M. B., B. F. Windley, C. Zhang, Z. Y. Zhao, and G. R. Wang, 1991, Basin evolution within and adjacent to the Tien Shan range, NW China: Journal of the Geological Society (London), v. 148, p. 369– 378, doi:10.1144/gsjgs.148 .2.0369.
Allen, M. B., S. J. Vincents, and P. J. Wheeler, 1999, Late Cenozoic tectonics of the Kepingtoge thrust zone: Interac-tion between the Tian Shan and the Tarim Basin, north-west China: Tectonics, v. 18, p. 639 – 654, doi:10.1029 /1999TC900019.
Avouac, J. P., P. Tapponnier, and M. Bai, 1993, Active thrust-ing and foldthrust-ing along the northern Tien Shan and late Cenozoic rotation of the Tarim relative to Dzungaria and Kazakhstan: Journal of Geophysical Research, v. 98, p. 6755– 6804, doi:10.1029/92JB01963.
Brown, E. T., et al., 1998, Estimation of slip rates in the south-ern Tian Shan using cosmic ray exposure dates of aban-doned alluvial fans: Geological Society of America Bul-letin, v. 110, p. 377 –386, doi:10.1130/0016-7606(1998)110 <0377:EOSRIT>2.3.CO;2.
Burchfiel, B. C., E. T. Brown, Q. Deng, F. Xianyue, L. Jun, P. Molnar, S. Jianbang, W. Zhangming, and Y. Huichuan, 1999, Crustal shortening on the margins of the Tienshan, China, Xinjiang: International Geology Review, v. 41, p. 665– 700.
Charreau, J., S. Gilder, Y. Chen, S. Dominguez, J.-P. Avouac, S. Sen, M. Jolivet, Y. Li, and W. Wang, 2006, Magneto-stratigraphy of the Yaha section, Tarim Basin (China): 11 Ma acceleration in erosion and uplift of the Tian Shan mountains: Geology, v. 34, p. 181 – 184, doi:10.1130 /G22106.1.
Charreau, J., Y. Chen, S. Gilder, and L. Barier, 2008, Comment on ‘‘Magnetostratigraphic study of the Kuche depression, Tarim Basin, and Cenozoic uplift of the Tian Shan Range, western China’’ by B. Huang, J. D. A. Piper, S. Peng, T. Liu, Z. Li, Q. Wang, and R. Zhu, [Earth and Planetary Science Letters, 2006, doi:10.1016/j.espl.2006.09.020]: Earth and Planetary Science Letters, v. 268, p. 325 – 329. Gonzalez-Mieres, R., and J. Suppe, 2006, Relief and
shorten-ing in detachment folds: Journal of Structural Geology, v. 28, p. 1785 – 1807, doi:10.1016/j.jsg.2006.07.001. Gonzalez-Mieres, R., and J. Suppe, 2011, Shortening histories
in active detachment folds based on area-of-relief meth-ods, in K. McClay, J. H. Shaw, and J. Suppe, eds., Thrust fault-related folding: AAPG Memoir 94, p. 39–67.
of the Tarim Basin, Xinjiang and their geological signifi-cance: Bulletin of the Chinese Academy of Geological Science, v. 4, p. 69 – 79.
He, D., and J. Suppe, 2005, Guidebook for fieldtrip in south and north Tianshan foreland basin, Xinjiang Uygur Auto-nimous Region, China: International Conference on Theory and Application of Fault-Related Folding in Foreland Ba-sins: Beijing, PetroChina, 78 p.
Heermance, R. V., J. Chen, D. W. Burbank, and C. Wang, 2007, Chronology and tectonic controls of late Tertiary deposition in the southwestern Tian Shan foreland, NW China: Basin Research, v. 19, p. 599–632, doi:10.1111/j.1365 -2117.2007.00339.x.
Hendrix, M. S., S. A. Graham, A. R. Carroll, E. R. Sobel, C. L. McKnight, B. J. Schulein, and Z. Wang, 1992, Sedimentary record and climatic implications of recurrent deformation in the Tianshan: Evidence from Mesozoic strata of the north Tarim, south Junggar, and Turpan basins, northwest China: Geological Society of America Bulletin, v. 104, p. 53 – 79, doi:10.1130/0016-7606(1992)104<0053:SRACIO>2.3 .CO;2.
Hendrix, M. S., T. A. Dumitru, and S. A. Graham, 1994, Late Oligocene – early Miocene unroofing in the Chinese Tian Shan: An early effect of the India-Asia collision: Geol-ogy, v. 22, p. 487 – 490, doi:10.1130/0091-7613(1994)022 <0487:LOEMUI>2.3.CO;2.
Huang, B., J. D. A. Piper, S. Peng, T. Liu, Z. Li, Q. Wang, and R. Zhu, 2006, Magnetostratigraphic study of the Kuche depression, Tarim Basin, and Cenozoic uplift of the Tian Shan Range, western China: Earth and Planetary Science Letters, v. 251, p. 346 – 364.
Huang, B., J. D. A. Piper, and R. Zhu, 2008, Reply to com-ment by J. Charreau et al. on ‘‘Magnetostratigraphic study of the Kuche depression, Tarim Basin, and Cenozoic up-lift of the Tian Shan Range, western China’’ [Earth and Planetary Science Letters, doi:10.1016/j.epsl.2008.01.025]: Earth and Planetary Science Letters, v. 275, p. 404 – 406, doi:10.1016/j.epsl.2008.06.053.
Hubert-Ferrari, A., J. Suppe, J. Van Der Woerd, X. Wang, and H. Lu, 2005a, Irregular earthquake cycle along the south-ern Tianshan front, Aksu area, China: Journal of Geo-physical Research, v. 108, 18 p., B06402, doi:10.1029 /2003JB002603.
Hubert-Ferrari, A., J. Suppe, X. Wang, and C. Jia, 2005b, The Yaken detachment fold, China, in J. Shaw, C. Connors, and J. Suppe, eds., Seismic interpretation of contractional fault-related folds: AAPG Studies in Geology 53, p. 110– 113.
Hubert-Ferrari, A., J. Suppe, R. Gonzalez-Mieres, and W. Wang, 2007, Mechanisms of active folding of the land-scape (southern Tian Shan, China): Journal of Geo-physical Research, v. 112, 39 p., B03S09, doi:10.1029 /2006JB004362.
Jia, C., 1997, The features of structure and petroleum geol-ogy on Tarim Basin of China: Beijing, Petroleum Industry Press, 438 p.
Lu, H., and Q. Luo, 1990, Fossil charophytes from the Tarim
Basin, Xinjiang: Beijing, Science and Technology Litera-ture Publishing House, 113 p.
Lu, H., D. Howell, D. Jia, D. Cai, S. Wu, C. Chen, Y. Shi, and Z. C. Valin, 1994, Rejuvenation of the Kuqa foreland ba-sin, northern flank of the Tarim Baba-sin, northwestern China: International Geology Review, v. 36, p. 1151– 1158, doi:10 .1080/00206819409465509.
Molnar, P., and P. Tapponnier, 1975, Cenozoic tectonics of Asia: Effects on a continental collision: Science, v. 189, p. 419 – 426, doi:10.1126/science.189.4201.419.
Meng, Z. F., 1999, The Cenozoic magnetic-strata of Kuqa river area, China (in Chinese): Research report of Tarim Oilfield Company, Xinjiang, 120 p.
Peng, S., Z. Li, B. Huang, T. Liu, and Wang, 2006, Magneto-stratigraphic study of Cretaceous depositional succes-sion in the northern Kuqa depressucces-sion, northwest China: Journal Chinese Science Bulletin, v. 51, p. 97–107, doi:10 .1007/s11434-005-0340-5.
Poblet, J., K. McClay, F. Storti, and J. A. Munoz, 1997, Ge-ometries of syntectonic sediment associated with single layer detachment fold: Journal of Structural Geology, v. 19, p. 369 – 381, doi:10.1016/S0191-8141(96)00113-7. Sobel, R. E., 1995, Basin analysis of the Jurassic – lower
Cretaceous southwest Tarim Basin, northwest China: Geological Society of America Bulletin, v. 111, p. 709 – 724, doi:10.1130/0016-7606(1999)111<0709:BAOTJL> 2.3.CO;2.
Sobel, R. E., and T. A. Dumitru, 1997, Thrusting and exhumation around the margins of the western Tarim Basin during the India-Asia collision: Journal of Geophysical Research, v. 102, p. 5043– 5063.
Sobel, E. R., J. Chen, and R. V. Heermance, 2006, Late Oligocene – early Miocene initiation of shortening in the southwestern Chinese Tian Shan: Implications for Neo-gene shortening rate variations: Earth and Planetary Sci-ence Letters, v. 247, p. 70–81.
Suppe, J., G. T. Chou, and S. P. Hook, 1991, Rates of fold-ing and faultfold-ing determined from growth strata, in K. R. McClay, ed., Thrust tectonics: London, Chapman & Hall, p. 105 –121.
Suppe, J., F. Sabat, J. A. Mun˜os, J. Poblet, E. Roca, and J. Verges, 1997, Bed-by-bed fold growth by kink-band mi-gration: Sant Llorenc¸ de Morunys, eastern Pyrenees: Jour-nal of Structural Geology, v. 19, p. 443 – 461, doi:10.1016 /S0191-8141(96)00103-4.
Suss, M. P., and J. H. Shaw, 2003, P wave seismic velocity structure derived from sonic logs and industry reflec-tion data in the Los Angeles Basin, California: Journal of Geophysical Research, v. 108, p. 2170, doi:10.1029 /2001JB001628.
Tapponnier, P., and P. Molnar, 1979, Active faulting and Ce-nozoic tectonics of the Tien Shan, Mongolia and Baykal regions: Journal of Geophysical Research, v. 84, p. 3425– 3459, doi:10.1029/JB084iB07p03425.
Wang, Q., P. Z. Zhang, J. T. Bilham, R. Larson, K. M. Lai, X. Wu, J. Y. Li, J. Liu, Z. Yang, and Q. Chen, 2001, Present-day crustal deformation in Chana constrained 242 Wang et al.
by global positioning system measurements: Science, v. 294, p. 571 – 577, doi:10.1126/science.1063647. Ye, C. H., and R. J. Huang, 1990, Tertiary stratigraphy of the
Tarim Basin, in Z. Zhou and P. Chen, eds., Stratigraphy of the Tarim Basin: Beijing, Sciences Press, p. 308– 363. Yin, A., S. Nie, P. Craig, T. M. Harrison, F. J. Ryerson, X. L.
Qian, and G. Yang, 1998, Late Cenozoic tectonic evolution of the southern Chinese Tian Shan: Tectonics, v. 17, p. 1 – 27, doi:10.1029/97TC03140.
Zhong, D., and W. S. Xia, 1998a, The investigation report of
Mesozoic – Cenozoic strata, structure, sedimentary faces, and petroleum potential of Kuche foreland basin outcrop area (with 1:100,000 Kuche foreland basin geologic map) (in Chinese with English abstract): Research report of Tarim Oilfield Company, Xinjiang, 462 p.
Zhong, D., and W. S. Xia, 1998b, The investigation report of Mesozoic – Cenozoic strata, structure, sedimentary faces, and petroleum potential of Kuche foreland basin outcrop area (in Chinese): Research report of Tarim Oilfield Com-pany, Xinjiang, supplemental plates, 156 p.