9–12 October 2018
Edited by Zoran Sodnik, Nikos Karafolas, and Bruno Cugny
Development of a space-based nulling interferometer to detect
and characterize exoplanets
L. Schifano
D. Defrère
O. Absil
J. Loicq
International Conference on Space Optics — ICSO 2018, edited by Zoran Sodnik, Nikos Karafolas, Bruno Cugny, Proc. of SPIE Vol. 11180, 111802X · © 2018 ESA
and CNES · CCC code: 0277-786X/18/$18 · doi: 10.1117/12.2536024 Proc. of SPIE Vol. 11180 111802X-1
Downloaded From: https://www.spiedigitallibrary.org/conference-proceedings-of-spie on 17 Sep 2019 Terms of Use: https://www.spiedigitallibrary.org/terms-of-use
Development of a space-based nulling interferometer to detect and
characterize exoplanets
L. Schifano, D. Defrère, O. Absil, J. Loicq.
Space sciences, Technologies & Astrophysics Research (STAR) Institute, Université de Liège, 19c
Allée du Six Août, bâtiment B5c, B-4000 Liège, Belgium
ABSTRACT
The development of small space-based platforms for nulling interferometric observations could be the pathfinder of a new era in exoplanetology. While planetary transit and radial velocity are the most productive ways to detect exoplanets, such techniques are indirect detections. For deeper characterization of exoplanets, direct detection techniques should be developed. By injecting direct light coming from exoplanets into spectrometers, we could study their chemical composition, search for biosignatures, and possibly infer the presence of life.
The low number of photons to be gathered from the planets, high contrast with the star and small angular resolution are the major difficulties for a direct detection. However, nulling interferometry seems to be a solution to tackle these challenges. By combining the light of two or more telescopes, we would considerably increase the angular resolution, and thus could potentially lead to the detection of Earth-size rocky exoplanets around Solar-type stars. Moreover, with a π-phase shift between the two interferometer arms, the starlight is reduced which allows the detection of much fainter objects around the star. In this paper it will be presented the development of a new mission based on nulling interferometry and dedicated to the Alpha Centauri system. As our nearest stellar system, it is a prime target to investigate for the research of new worlds. Monte-Carlo simulations about potential exoplanet yield of such an interferometer will be described, for different assumptions such as the detection wavelength and telescope size. Single-mode fibers and integrated optics will also be investigated for this mission. This could lead to low-cost type missions with a high potential of scientific return.
Keywords: Exoplanet, nulling, interferometry, Alpha Cen, Proxima Cen, Proxima b, optical design, Monte-Carlo
simulations, Kepler’s statistics.
1. INTRODUCTION
Since 90's, various detection techniques have emerged over the years, and we have now detected nearly 3800 exoplanets1.
Although indirect detection techniques like transit method or radial velocity are the most successful today, a major advance in the characterization of habitable exoplanets might only be achieved optimally with direct detection techniques. Nevertheless, strong contrast of luminosity between an exoplanet and its host star, the very short angular separation between these two objects, and finally, the atmospheric turbulence which blurs the images taken from the ground, are the main issues to deal with when direct detection techniques are used. In response to these difficulties, nulling interferometry is a powerful tool to handle direct detection. Interferometry increases the angular resolution of an optical system by increasing the baseline between telescopes. Indeed, the angular resolution of an interferometer is equal to the angular resolution of a telescope with a diameter equal to the distance between these telescopes. Then, observation from space frees us from the atmosphere and the associated turbulence. Moreover, nulling interferometry "extinguishes" the star's light, revealing the exoplanet orbiting the star. This increases the contrast between the exoplanet and its host star. In this paper, we present a concept of space-based interferometer to detect exoplanets around nearby stars, such as the Alpha Centauri system. This system is a very good opportunity to demonstrate such technology. In addition, the Alpha Centauri system presents different types of stars, such as main-sequence stars like Alpha Centauri A, or red dwarfs like Proxima Centauri. In order to minimize the cost of such a mission, the goal is to fit the mission on a small spacecraft with sizes close to the PROBA plateforms2. PROBA term refers to missions of the European Space Agency (ESA) like
Proba-1, Proba-2 and Proba-V, already in operation. The next PROBA mission will be Proba-3, a mission that aims to reproduce
Proc. of SPIE Vol. 11180 111802X-2 Downloaded From: https://www.spiedigitallibrary.org/conference-proceedings-of-spie on 17 Sep 2019
the solar eclipse phenomenon through formation flight. The mission concept presented in this paper should therefore become the pathfinder for future low-cost interferometric space missions. A first study3 has been performed, where we
conclude that the observations should be more favorable in the visible domain than in the infrared domain (near- and mid-infrared). We thus only present the results for the visible case (see section 3).
2. METHODOLOGY
Monte-Carlo simulations on radii and orbital periods for fictive exoplanets around stars of the Alpha Centauri system. These simulations consist in a random choice on radius and orbital period using statistical weights4. These statistical
weights are based on the observations performed by the NASA’s Kepler satellite and are thus computed with an empirical method. Due to the lack of data for orbital periods exceeding 85 days, we simply assume that the probability is 0 for them, but our simulations will easily be adapted when more data will be accessible.
Astrophysical parameters, such as fluxes of the exoplanets and angular separations between these exoplanets and their host star, are simulated. Angular separations are computed based on the orbital period and the distance of the interferometer to the target, and fluxes are calculated by summing the thermal flux of the exoplanet with the flux of the star which is reflected by the exoplanet. For these simulations, exoplanets and stars are considered as black bodies, and circular obits are assumed. Fluxes of these exoplanets depend of the one of the host star, the wavelength of observation, the distance of the exoplanet to the star and the size of the exoplanet.
All the angular separations and fluxes of exoplanets are then stored in sorted lists. These lists are then used in order to know the minimum baseline and the minimum diameter of entrance pupils required to detect those exoplanets. The baseline of an interferometer is the distance between its two telescopes (in the case of a Bracewell interferometer) and is computed according to the equation θ = λ/(2𝐵) where 𝜆 is the wavelength of observation and B is the baseline of the interferometer. The diameters of entrance pupils are computed according to a radiometric budget.
2.1 The radiometric budget
The SNR (signal-to-noise ratio) is given by
SNR =
Signal Noise=
OPF√Ti √Ns2+Nd2
(1)
where we made the hypothesis that only the shot noise and the detector noise contribute to the noise sources. The output planet flux (OPF) is basically the signal of the planet converted in electrons per second. It involves the collected area, the bandwidth, the instrumental transmission and the quantum efficiency of the detector. The shot noise is calculated by adding the output planet flux (OPF) with the output stellar flux (OSF), and the output background flux (OBF), which involves noise sources like instrumental brightness, zodiacal dust and exozodiacal dust. Since exozodiacal dust around the Alpha Centauri system has never been detected, we assume that this term is null. Moreover, we assume that OSF is negligible since the interferometer would perform a total nulling of the star. The zodiacal dust is calculated in the way of Kelsall et al. (1988)5. The instrumental transmission will depend on the way that the optical beams are transmitted and combined.
Since the true instrumental transmission is currently unknown, simulations of the evolution of SNR with the percentage of instrumental transmission have been performed. However, we assumed an instrumental transmission of 5% for the rest of our Monte-Carlo simulations. In addition, we did a parametric study for the SNR with a variation of collecting area and integration time, allowing to study several cases of the potential mission.
3. SCIENTIFIC CASE FOR THE ALPHA CENTAURI SYSTEM
The baseline of the interferometer that would be needed to observe 80% of possible exoplanets has been calculated, and a sensitivity calculation has been performed in order to determine the required sizes of the two telescopes of the interferometer. We have made this study for observations in the visible domain (540 nm) and in the infrared (3 and 10 µm). Simulations allowed an instrumental transmission of 5%, a SNR of 5 and an integration time of 1 day. For the visible domain, we choose a bandwidth of 400 nm, and 4 µm for the infrared domain (at 3 and 10 µm). For example, Figure 3.2
Proc. of SPIE Vol. 11180 111802X-3 Downloaded From: https://www.spiedigitallibrary.org/conference-proceedings-of-spie on 17 Sep 2019
shows the results for an observation of exoplanets around Alpha Centauri A, in the visible domain. Table 3.1 presents the other configurations according to the wavelength of observation and the host star.
Table 3.1: Required bases [m] and diameters [m] of the entrance pupils to observe 80% of exoplanets around Alpha Centauri A and Proxima Centauri. These 80% correspond to those that are both among the 90% brightest and among the 90% most angularly
separated. Comparison of observations in the visible, at 3 µm and at 10 µm.
Visible 3 µm 10 µm Alpha Cen A Proxima Cen Baseline Diameter 1.3 0.06 2.7 2 Baseline Diameter 7 0.09 15 1.1 Baseline Diameter 25 0.06 50 1.3
This study has shown that the visible domain is more favorable than the infrared domain for this interferometric mission. Indeed, at 10 µm, the required baseline of the interferometer is too long for a PROBA-type satellite. We calculate a base of 25 meters to be able to detect 90% of all the fluxes of the simulated exoplanets around Alpha Centauri A, and a baseline of 50 meters if the host star is Proxima Centauri. This case is therefore to be rejected. Moreover, observations in the visible domain are more favorable than the case of 3 µm, because the latter requires a baseline of 15 meters and telescopes sizes of 1.1 meters, which are way too big for a small platform.
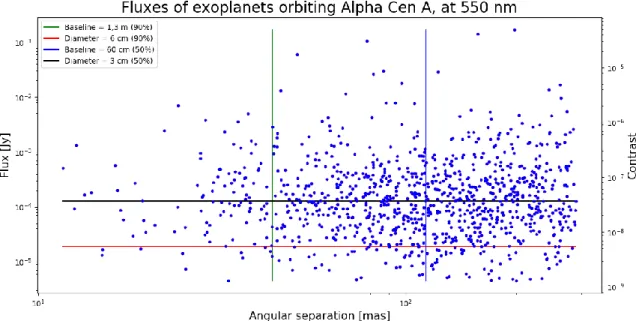
Figure 3.1: Results of Monte-Carlo simulations given as exoplanets fluxes as a function of angular separation. Vertical lines represent limits of resolvable angular separations, according to a given baseline. Horizontal lines represent limits of fluxes according to a given diameter for the two entrance pupils. Exoplanets are detectable if they are both above and horizontal line and at the right of a vertical line in the same time. The configuration of the interferometer is a baseline of 1.3 meters and telescopes of 6 cm of entrance pupils, in the visible domain. 80% of exoplanets are detectable with this configuration. They correspond to those that are both among the 90%
brightest and among the 90% most angularly separated.
Proc. of SPIE Vol. 11180 111802X-4 Downloaded From: https://www.spiedigitallibrary.org/conference-proceedings-of-spie on 17 Sep 2019
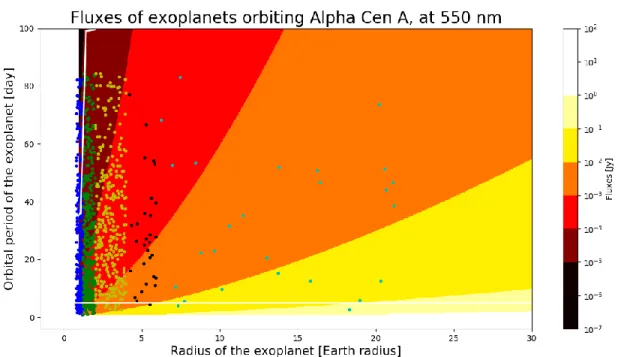
Figure 3.2: Exoplanets fluxes around Alpha Cen A, in the visible. 3D matrix. The colormap illustrates the fluxes, according to the orbital period of the exoplanet (vertical axe) and its radius (horizontal axe). Points of color shows the simulated exoplanet. Dot colors are blue, green, yellow, black and cyan, respectively for Earths, Super-Earths, Small Neptunes, Large Neptunes and Giants exoplanets.
White lines illustrate the limits of detection with a baseline of 1.3 m and entrance pupils of 6 cm-diameter.
4. OPTICAL DESIGN
Figure 4.1: Interferometer diagram (not to scale). The light beams arrive on the telescopes and are reflected by the mirrors to the optical fiber, passing through each arm of the interferometer. The optical fiber (shown as a straight line) transports the
light beams to the core of the satellite where the beam combination takes place, for example by means of an integrated
Proc. of SPIE Vol. 11180 111802X-5 Downloaded From: https://www.spiedigitallibrary.org/conference-proceedings-of-spie on 17 Sep 2019
optical component (shown as a grey plane). A π offset occurs between the two arms of the interferometer to perform nulling interferometry.
The interferometer will consist of two twin telescopes that will each send the collected light in a single mode optical fiber (see Figure 4.1). The latter will serve both as beam transport and modal filtering. We choose a single-mode optical fiber which operates between 400 and 680 nm and with a numerical aperture between 0.12 and 0.14, as well as a core diameter of 10 microns and a cladding of 125 microns6. Once the light is injected into these waveguides, it will
propagate to the beam combiner. This could be done by means of a Y-coupler that would have two inputs for the fibers of each telescope and would output a single fiber that would project its light onto the detector. In case we need
simultaneous photometric information from each telescope, the Y-coupler will be replaced with an integrated optical component.
The telescopes of our interferometer being identical, we will present the design of a single telescope. To realize its design, we used two optical design software: Code V and ASAP. The first enable us to design the telescope as such, particularly with the help of its powerful optimization tool. Then the ASAP software allow us to carry out a more complete analysis, notably through the physical study of the injection of light into the optical fiber.
4.1 Bounding conditions
The design of each telescope will be determined by the choice of a focal ratio F# = f/D. The F# of each telescope must respect several constraints:
- Since the light collected from each telescope has to be injected into a single mode optical fiber, the core diameter of the fiber is a first constraint. In a diffraction-limited case, all the Airy disk (central part) should be injected into the fiber core to limit energy losses. For this, the Airy disk must be smaller than the core diameter of the fiber, driven by the wavelength choice, is limited to 10 microns only for a single mode fiber in the visible. So this first constraint is written as 2.44λf
D≤ 10 µm, where 𝜆 is the maximum wavelength that can be accepted. According to the technical specifications of optical fiber6 (N.A. = [0.12 – 0.14], Δ𝜆 = [400 – 680] nm), we get 𝑓
𝐷≤ 6.027. - To inject the light cone into the optical fiber, it must be smaller than the acceptance cone of the fiber, which is
determined by its numerical aperture. A light beam can only be guided correctly by internal total reflection if it comes from this acceptance cone. If this beam attempts to penetrate the fiber from outside this cone, then the beam will not be guided. The numerical aperture of the fiber is defined as N.A. = √𝑛𝑐2− 𝑛𝑔2 where 𝑛𝑐 defines the refractive index of the core, and 𝑛𝑔 is the refractive index of the cladding. Let 𝛼𝑚𝑎𝑥 the fiber acceptance angle, which defines the maximum angle that defines the fiber acceptance cone, we can also express the fiber numerical aperture as N.A. = 𝑛out𝑠𝑖𝑛(𝛼𝑚𝑎𝑥) where 𝑛out is the refractive index of the environment outside the fiber. The value of the numerical aperture N.A. of the fiber we have chosen is between 0.12 and 0.14; we must take the minimum value so as to be certain that all the rays will be guided in the optical fiber. For the light cone to be smaller than the fiber acceptance cone, the focal ratio of the telescope must be larger than 1
2N.A.. So our condition is written as 𝑓
𝐷≥ 4.167
- The last condition relates directly to the focal length. As the instrument has a certain field of view, the rays at zero and non-zero fields of view will focus at different places on the focal plane. The maximum field of view 𝜃 give a maximum distance between Airy disks equal to 𝑓 tan(𝜃). Since we want to inject the collected light into the optical fiber, the envelope of these two Airy disks must be able to enter the fiber. The distance between these two diffraction disks must therefore be smaller than the core diameter of the fiber, which is written 𝑓 tan(𝜃) ≤ 10 µm. Since our target system being the Alpha Centauri system located at about 1.3 pc, the field of view 𝜃 = 𝑥 UA
1.3 pc where x is the number of astronomical units. The condition then rewrites itself as equation 𝑥. 𝑓 ≤ 2.7 m.
Proc. of SPIE Vol. 11180 111802X-6 Downloaded From: https://www.spiedigitallibrary.org/conference-proceedings-of-spie on 17 Sep 2019
In conclusion, there are several possibilities for focal length and focal ratio. The focal length is limited by the equation 𝑥. 𝑓 ≤ 2.7 m, where x is the number of astronomical units of the field of view. A smaller focal ratio will be more favorable to ensure that the Airy disk will enter the fiber core, but a larger focal ratio will be more favorable for the light rays to be located in the fiber acceptance cone. Finally, another trade-off to be made is related to the telescopes entrance pupil diameters. These must be large enough to gather enough flux from exoplanets. In order to obtain the largest possible entrance pupils, a focal ratio of 6 should be chosen. But the size of the telescopes will limit the maximum field of view that could be allowed. For example, if D = 50 cm with f/D = 6, then f = 3 m and the maximum observable physical separation, between the exoplanet and its star is only 0.9 AU. On the contrary, if we want to get a larger field of view, we must take the shortest possible focal length because of the third and last condition. Since the second condition limits our focal ratio to at least 4.167, the desire to obtain a larger field of view limits the size of the telescopes, and therefore the collected flux. We know that a compromise must be made on the focal ratio. For now, the best focal ratio is known to be between 4.167 and 6.027. We have only studied the extremes here, but more in-depth studies should be able to refine these limits.
4.2 Design of each telescope
According to our study, the best optical performances while keeping a compact optical design can be achieved by telescopes made by 2 or 3 mirrors. The configuration with 3 aspherical mirrors can improve the compactness of the design, while using only 2 conical mirrors is cheaper, lighter and easier to manufacture. Good optical performances are obtained for these two optical designs (e.g., see Figure 4.2 for the design with 2 mirrors with F#= 6, and Figure 4.3 for F# = 4.167), and the two of them can be used with a single-mode optical fiber.
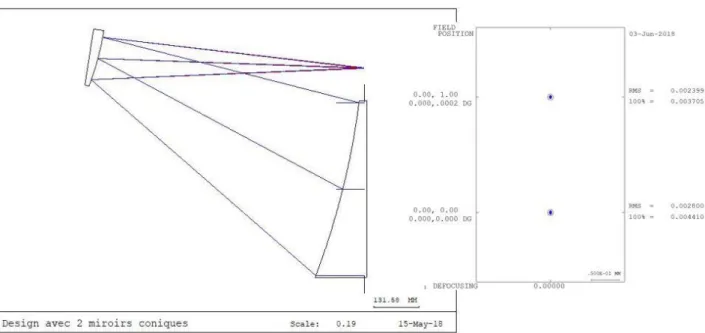
With F# = 6
Figure 4.2: Design with 2 conical mirrors. The rays come from the left, are reflected by the first mirror to the second, which will focus the light in a future optical fiber.
Proc. of SPIE Vol. 11180 111802X-7 Downloaded From: https://www.spiedigitallibrary.org/conference-proceedings-of-spie on 17 Sep 2019
With F# = 4.167
Figure 4.3: Designs with 2 and 3 mirrors. Spot diagram analysis shows that geometrical aberrations are not bigger than the Airy disk, which ensures the optimal performances of these optical designs.
Proc. of SPIE Vol. 11180 111802X-8 Downloaded From: https://www.spiedigitallibrary.org/conference-proceedings-of-spie on 17 Sep 2019
4.3 Fiber injection
This section will focus on the results of the modelling carried out with f/D = 4.167. This case is indeed the most interesting to present because it is the one which will be limited at the level of the fiber injection. We start by modeling in ASAP the same designs as those made with Code V.
In the design illustrated in Figure 4.4, all the rays arrive on the center of the fiber core. Since the rays are all in the fiber acceptance cone, almost all the rays are correctly transmitted. For the 3 Mirrors telescope (see Figure 4.5), the design is more complex than the previous one, but was mostly done with the Code V optimization tool. Mirrors and optical fiber are thus correctly rotated, and the fiber was chosen for its large numerical aperture, in such a way that it maximizes light injection into the optical fiber.
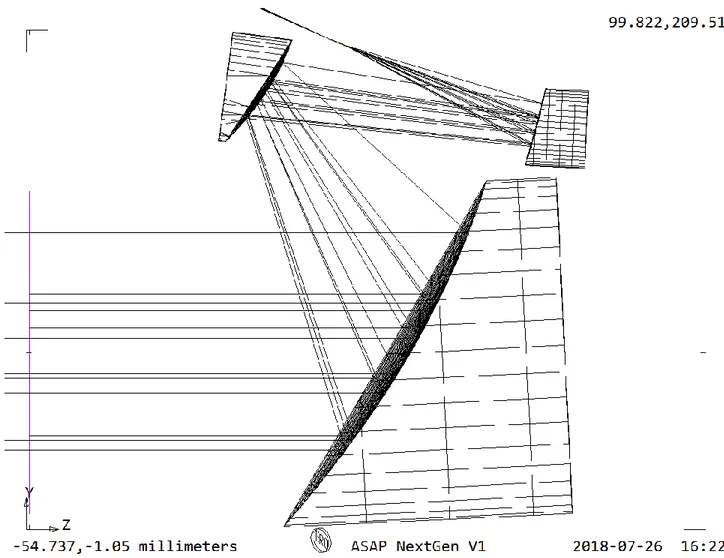
Figure 4.4: Optical design of the 2 Mirrors Telescope. A simple design, but with an off-axis parabola in order to do a compact design. 2 conical mirrors, easy to manufacture. This design, while very simple, presents the best optical performances. In the upper right corner is presented a zoom on the optical fiber for the 2 Mirrors Telescope. The rays are correctly guided through the core of the fiber.
Proc. of SPIE Vol. 11180 111802X-9 Downloaded From: https://www.spiedigitallibrary.org/conference-proceedings-of-spie on 17 Sep 2019
Figure 4.5: Optical design of the 3 Mirrors Telescope. This design is more compact than the case of 2 Mirrors, but aspherical terms and complex geometry made this design more difficult to manufacture.
For now, the propagation of the light in the fiber is simulated with ASAP, according to the laws of geometrical optics. But in the future, we should use another optical engineering software to simulate the propagation of the light in the fiber. Polarizations aspects should also be investigated.
4.4 Beam transport and combination
In addition to the design of the fibered telescopes, we propose some perspectives about the transport of the beams and their combination. To transport the light beams, we use a single mode optical fiber. In addition to facilitating transport, the optical fiber also serves as a filter before the combination step. A single mode fiber is often used for precision interferometry and could not be achieved with a multimode fiber, because of the focal ratio degradation, which is a change in the distribution of energy between the modes that takes place within the fiber. A single mode fiber avoids this problem since it propagates only one mode.
To perform nulling interferometry, we must combine the light beams from the two telescopes with a π phase shift between the two beams in order to produce destructive interference. This way, we get dark and bright fringes (a
transmission map) that give us information about which photons are collected and which are blocked. By placing the star on the central dark fringe, and by making sure to place the exoplanet on a light fringe, the star is "extinguished" and the exoplanet is directly detected. The combination of the beams can be done via a Mach Zehnder device, as it is the case on several interferometers on the ground, but the use of a fiber allows to simplify the design. With single mode fiber, it will
Proc. of SPIE Vol. 11180 111802X-10 Downloaded From: https://www.spiedigitallibrary.org/conference-proceedings-of-spie on 17 Sep 2019
be possible to recombine the light beams of the two telescopes in three ways: either on the head of the fiber, with a Y-coupler, or by means of integrated optics. The latter has many advantages for space interferometry and should therefore be further investigated in the future. Being very small, of the order of a few centimeters, integrated optics make it possible to avoid the construction of large structures on satellites, and thus to reduce the risks associated with mechanical and thermal stress7. They also introduce additional correction of phase errors associated with the incident wavefront8, 9, in
addition to that already performed by single-mode optical fiber.
5.
DISCUSSION
With an interferometer baseline equals to 1.3 m and telescopes of 8 cm in diameter, it would be possible to observe 90% of the exoplanets generated by our Monte Carlo simulations around Alpha Centauri A. In comparison to the configuration illustrated in Figure 3.1, an increase of 2 cm per entrance pupil allows to detect 10% more exoplanets than before. The optical fiber operating between 400 and 680 nm wavelength, the observation would be in the visible domain at a wavelength centered in 540 nm. A mission like this could be built on a small platform or a CubeSat.
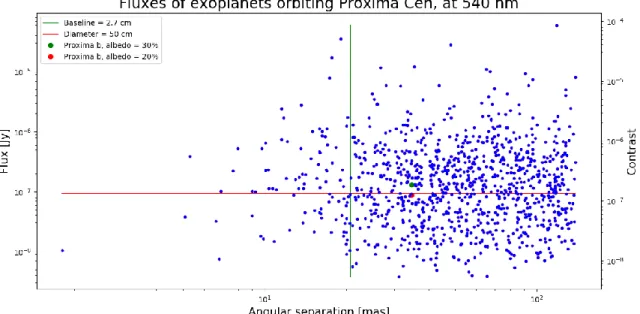
In the case of Proxima Centauri, exoplanets have a lower flux in the visible domain, and are closer to their host star. This other mission concept uses an interferometer with larger entrance pupils and a longer base than the first mission. The base is 2.7 m and the entrance pupils are 50 cm in diameter. We couldn't afford to use larger telescopes with a PROBA platform. With this configuration, we would be able to detect 50% of the exoplanets around Proxima Centauri, in a zone of 0.19 AU (corresponding to an orbital period of 85 days) around the star (see Figure 5.1). The exoplanet Proxima b is approximately 0.0485 AU from its star, so it is in this zone. But in the visible regime, the flux that reaches us from this planet is at the limit of detection. More favorable assumptions on the instrument (e.g. throughput) and/or the exoplanet would take Proxima b detectable (e.g. temperature, albedo, …). Like Defrère et al. (2018)10, it would then be more favorable to
consider infrared to observe Proxima b, as shown in Figure 5.2.
Figure 5.1: Monte-Carlo simulations for the mission B, showing exoplanet flux around Proxima Cen, for an observation at 540 nm. The base of the interferometer is 2.7 m and the entrance pupils are each 50 cm in diameter. The configuration is such that 50% of the exoplanets generated by simulations are detected. Proxima b will be detectable if his albedo is 30%, but not if his albedo is 20%.
Proc. of SPIE Vol. 11180 111802X-11 Downloaded From: https://www.spiedigitallibrary.org/conference-proceedings-of-spie on 17 Sep 2019
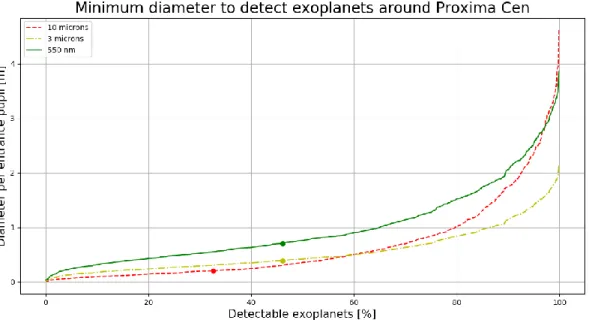
Figure 5.2: Minimum diameter to detect exoplanets around Proxima Centauri. Dots represents the case of Proxima b. The required diameter per entrance pupil is shorter for observations in the infrared regime than in the visible. Because Proxima b is a limit case of detection in the visible, a space mission would be more favorable in the infrared.
6. CONCLUSION
This work focuses mainly on the development of an interferometer for the direct detection of exoplanets. We simulated exoplanets around the stars of the Alpha Centauri system. This system, composed of the 3 stars Alpha Centauri A, Alpha Centauri B and Proxima Centauri, is the closest to our Solar system. This makes it a prime target for opening the path to exoplanet detection by nulling interferometry. After simulating different interferometer configurations, including wavelength, instrumental transmission, integration time, telescope entrance pupil diameters and the baseline of the interferometer, we chose an observation in the visible domain, which allowed us to develop a design with relatively small entrance pupils and baseline. Our constraint being to develop an interferometer on a small platform, these parameters of size and volume are very important. This is what interested us during the second part of this work, which is the optical modeling of the telescope. These telescopes must have good optical performance (the design must be limited by diffraction) while presenting a very compact design to enter a small platform. Trade-offs were discussed on the focal ratio and the maximum field of view of our telescopes. The focal ratio should be between 4.127 and 6.
These telescopes were modeled with Code V software. Then, using ASAP software, we modeled the single mode optical fiber, whose characteristics were chosen in adequacy with our previous constraints: an optical fiber operating in the visible domain, whose numerical aperture equals 0.12. Additional studies will have to be carried out with other optical software to study the propagation of light within the optical fiber in order to take into account the wave properties of light. Finally, we discussed perspectives for transport and beam combination for interferometry. The integrated approach seems to be well suited to our objective.
In summary, we propose two concepts of space missions:
• Mission A, feasible with a small platform or a CubeSat: an interferometer with a baseline of 1.3 meters, with 8-cm telescopes, that could observe 90% of possible exoplanets around Alpha Centauri A, in a 0.39 AU zone around the star. The observation would be in the visible range, at a wavelength centered at 540 nm
• Mission B, feasible with a PROBA-type platform: in the visible range (540 nm) too, Mission B uses a 2.7 m baseline with 50 cm telescopes. Such a configuration would be capable of observing 50% of the exoplanets around
Proc. of SPIE Vol. 11180 111802X-12 Downloaded From: https://www.spiedigitallibrary.org/conference-proceedings-of-spie on 17 Sep 2019
Proxima Centauri, in an area of 0.19 AU (corresponding to an orbital period of 85 days) around the star. The exoplanet Proxima b, approximately 0.0485 AU from its star, would be at the limit of detection in the visible.
REFERENCES
[1] NASA Exoplanet Archive, https://exoplanetarchive.ipac.caltech.edu/ (14 August 2018).
[2] ESA’s PROBA missions, https://www.esa.int/Our_Activities/Space_Engineering_Technology/Proba_Missions (14 August 2018).
[3] L. Schifano, "Développement d’un interféromètre spatial pour la détection et la caractérisation d’exoplanètes," Master thesis, Université de Liège, Belgium (2018).
[4] F. Fressin, G. Torres, D. Charbonneau, S. T. Bryson, J. Christiansen, C. D. Dressing, J. M. Jenkins, L. M. Walkowicz and N. M. Batalha: "The False Positive Rate of Kepler and the Occurrence of Planets," Astrophysical Journal, 766:81 (2013).
[5] T. Kelsall, J. L. Weiland, B. A. Franz, W. T. Reach, R. G. Arendt, E. Dwek, H. T. Freudenreich, M. G. Hauser, S. H. Moseley, N. P. Odegard, R. F. Silverberg and E. L. Wright: The COBE Di use Infrared Background
Experiment Search for the Cosmic Infrared Background. II. Model of the Interplanetary Dust Cloud. Astrophysical Journal, 508:44 (1988).
[6] Thorlabs, Inc., Single Mode Fiber, https://www.thorlabs.com/newgrouppage9.cfm?objectgroup_id=949 (14 August 2018).
[7] D. Defrère, A. Léger, O. Absil, C. Beichman, B. Biller, W.C. Danchi, K. Ergenzinger, C. Eiroa, S. Ertel, M. Fridlund, A. Garcia Munoz, M. Gillon, A. Glasse, M. Godolt, J.L. Grenfell, S. Kraus, L. Labadie, S. Lacour, R. Liseau, G. Martin, B. Mennesson, G. Micela, S. Minardi, S.P. Quanz, H. Rauer, S. Rinehart, N.C. Santos, F. Selsis, J. Surdej, F. Tian, E. Villaver, P.J. Wheatley and M. Wyatt, "Space-based infrared interferometry to study
exoplanetary atmospheres, " ArXiv e-prints (2018).
[8] O. Wallner, W.-R. Leeb, and P.-J. Winzer, "Minimum length of a single-mode fiber spatial filter, " Journal of the Optical Society of America A (2002).
[9] B. Mennesson, M. Ollivier, and C. Ruilier, "Use of single-mode waveguides to correct the optical defects of a nulling interferometer, " Journal of the Optical Society of America A (2002).
[10] D. Defrère, A. Léger, O. Absil, A. Garcia Munoz, J. L. Grenfell, M. Godolt, J. Loicq, J. Kammerer, S. Quanz, H. Rauer, L. Schifano, and F. Tian, "Characterizing the atmosphere of Proxima b with a space-based mid-infrared nulling interferometer," Proc. SPIE 10701, Optical and Infrared Interferometry and Imaging VI, 107011H (2018).
Proc. of SPIE Vol. 11180 111802X-13 Downloaded From: https://www.spiedigitallibrary.org/conference-proceedings-of-spie on 17 Sep 2019