Ann Rheum Dis 2011;70:1144–1152. doi:10.1136/ard.2010.135541
1144
ABSTRACT
Objective Knee osteoarthritis (OA) is a heterogeneous, complex joint pathology of unknown aetiology. Biomarkers have been widely used to investigate OA but currently available biomarkers lack specifi city and sensitivity. Therefore, novel biomarkers are needed to better understand the pathophysiological processes of OA initiation and progression.
Methods Surface enhanced laser desorption/ionisation-time of fl ight-mass spectrometry proteomic technique was used to analyse protein expression levels in 284 serum samples from patients with knee OA classifi ed according to Kellgren and Lawrence (K&L) score (0–4). OA serum samples were also compared to serum samples provided by healthy individuals (negative control subjects; NC; n=36) and rheumatoid arthritis (RA) patients (n=25). Proteins that gave similar signal in all K&L groups of OA patients were ignored, whereas proteins with increased or decreased levels of expression were selected for further studies.
Results Two proteins were found to be expressed at higher levels in sera of OA patients at all four K&L scores compared to NC and RA, and were identifi ed as V65 vitronectin fragment and C3f peptide. Of the two remaining proteins, one showed increased expression (unknown protein at m/z of 3762) and the other (identifi ed as connective tissue-activating peptide III protein) was decreased in K&L scores >2 subsets compared to NC, RA and K&L scores 0 or 1 subsets.
Conclusion The authors detected four unexpected biomarkers (V65 vitronectin fragment, C3f peptide, CTAP-III and m/z 3762 protein) that could be relevant in the pathophysiological process of OA as having signifi cant correlation with parameters refl ecting local infl ammation and bone remodelling, as well as decrease in cartilage turnover.
INTRODUCTION
Osteoarthritis (OA) is one of the most common chronic joint diseases causing substantial health defi cits1 and it is becoming increasingly more prev-alent as a result of population ageing. Obesity is a major risk factor for developing OA and recent data suggest that there will be an epidemic of obe-sity-related OA in the general population.2 Current diagnosis of OA depends on patient-reported pain and disability and is confi rmed by plain radiogra-phy of affected joints. The pathoradiogra-physiology of OA is characterised by dysregulation of normal joint homeostasis that leads to intra-articular tissue deg-radation, with attempted repair and infl ammation mediated by cytokines and growth factors. Serum
levels of macromolecules (biomarkers) can provide a way of measuring these processes,3–8 whereas others are putative markers of radiographic dis-ease outcome in knee OA or have some diagnostic value.9–12 However, these biomarkers (singly or in combination) often lack the specifi city and sensitiv-ity to discriminate individual patients from control subjects or to suggest possible disease progression for patients over time. Therefore, there is an urgent need to seek novel and more specifi c-biomarkers for investigation of OA and other joint diseases.
To that end, new proteomics studies related to discovery of biomarkers specifi c to OA pathol-ogy have been performed by two-dimensional electrophoresis or liquid chromatography-mass spectrometry on serum,1314 synovial fl uid1516 or cartilage and chondrocyte secretomes,1 17–21 and these studies were recently reviewed.2223 In the present study, the surface enhanced laser desorp-tion/ionisation-time of fl ight-mass spectrometry (SELDI-TOF-MS) proteomics approach was used to investigate large serum sample cohorts. SELDI-TOF-MS is a powerful ProteinChip technology that differentially investigates levels of low molecular weight proteins (<20 kDa) in biological fl uids.24–28 In this type of study, unusually high or low protein signals are the main interest and these are consid-ered as potential biomarkers of the disease pro-cess. SELDI ProteinChip includes chromatographic chemistry for capturing proteins according to their physicochemical properties and displaying various protein profi les from the same studied biological sample, thus considerably increasing chances of identifying specifi c biomarkers.
In the present study, serum samples from well-characterised groups of OA patients, healthy con-trol subjects and disease concon-trol subjects (patients with rheumatoid arthritis (RA)) were analysed using SELDI-TOF-MS to search for novel and spe-cifi c biomarkers for OA.
PATIENTS AND METHODS Patients
Two-hundred and eighty-four patients with knee OA recruited through community questionnaires, consultations and hospital outpatient clinics,10 11 and classifi ed according to their Kellgren and Lawrence (K&L) score,29 were used for the study. Of the 284 OA patients, 130 were included in the serum analysis study from Bristol OA 500 cohort, which has been described fully in previous publi-cations810 and been shown to be appropriate for biomarker studies. The 154 OA patients used in ▶ Additional data
(supplementary tables and fi gures) are published online only. To view these fi les please visit the journal online (http://ard.bmj.com). 1GIGA Research, Laboratory of Rheumatology, University of Liège, CHU Liège, Belgium 2Department of Anatomy, University of Bristol, Bristol, UK 3GIGA Research, Laboratory of Clinical Chemistry, University of Liège, CHU Liège, Belgium 4GIGA Proteomics and Bioinformatics Platform, University of Liège, CHU Liège, Belgium
5GIGA Research, Bioinformatics and Modeling Unit, Department of Electrical Engineering & Computer Science, University of Liège, CHU Liège, Belgium 6Laboratory of Hepato-Gastroenterology, University of Liège, CHU Liège, Belgium 7Rheumatology Unit, University of Bristol, Bristol, UK Correspondence to Dominique de Seny, Department of Rheumatology, Tour GIGA +2, CHU, 4000 Liège, Belgium; [email protected] DdS and MS contributed equally to this work.
Accepted 23 January 2011 Published Online First 28 February 2011
Discovery and biochemical characterisation of four
novel biomarkers for osteoarthritis
Dominique de Seny,
1Mohammed Sharif,
2Marianne Fillet,
3Gaël Cobraiville,
1Marie-Alice Meuwis,
4Raphaël Marée,
4Jean-Philippe Hauzeur,
1Louis Wehenkel,
5Edouard Louis,
6Marie-Paule Merville,
3John Kirwan,
7Clio Ribbens,
1Michel Malaise
145_annrheumdis135541.indd 1144
Ann Rheum Dis 2011;70:1144–1152. doi:10.1136/ard.2010.135541 1145
corticosteroid injection or NSAID use. Nineteen paired serum/ synovial fl uid samples (12 OA and seven RA patients) were used for correlation between both fl uids.
The study protocol was approved by the institutional review boards (Research Ethics Committee) of the United Bristol Healthcare NHS trust, Bristol, UK, and the University Hospital, CHU Liège, Belgium.
Serum samples and synovial fl uids
Blood samples were allowed to coagulate in plain glass tubes. Serum was obtained by centrifugation at 2800 rpm for 10 min. Synovial fl uids were processed using the same experimental conditions. Supernatants were aliquoted and immediately fro-zen at −80°C until required for SELDI-TOF-MS analysis. ProteinChip array preparation and data preprocessing
The choice of ProteinChip arrays, subsets of samples and the overall strategy for the OA proteomic study is summarised in fi g-ure 1. ProteinChip array preparation and data preprocessing are described in the supplementary data and in previous studies.3233
Protein purifi cation for biomarkers identifi cation
The proteomic study detected four proteins at different m/z ratios as putative biomarkers and a range of biochemical meth-ods were used to characterise and identify these markers as described in the supplementary data.
the Validation study are from a more recent Bristol cohort. The demographic, clinical and radiographic data of these patients have also been published91112 and demonstrated to be a suit-able cohort for biomarker studies. The demographic and epi-demiologic data of these patients are summarised in table 1. None of the OA patients were on intra-articular steroids or any potential disease-modifying drugs, the majority were on analge-sics or non-steroidal anti-infl ammatory drugs (NSAIDs) that are unlikely to affect serum or synovial fl uid levels of the markers investigated.
Twenty-fi ve RA patients fulfi lling the 1987 American College of Rheumatology criteria30 and 36 healthy individuals (referred to as negative control subjects (NC)) were included in the study as control subjects. Of the 25 RA patients, 84%, 80% and 71% presented an elevated erythrocyte sedimentation rate (>40 mm/h), rheumatoid factor (>20 IU/ml) and anti-CCP2 antibody (>5 IU/ml) score respectively. The median disease activity score using 28 joint counts (DAS28) was 7 (range 5.5–8.4), with 100% of the scores >5.1 (high disease activity).31 The mean numbers of tender and swollen joints were 15 (range 6–28) and 12 (range 6–27) respectively. Concomitant treatments included metho-trexate at a mean dosage of 14.5 mg/week (range 7.5–20 mg/ week) in six (24%) of 25 patients, and prednisolone at a mean dosage of 2.7 mg/day in eight (32%) of 25 patients.
NC qualifi ed for entry into the proteomics study consider-ing the followconsider-ing exclusion criteria: any prior history of knee trauma, joint pain, chronic infl ammatory or autoimmune disease,
Table 1 Demographic and clinical characteristics of the patients and control subjects used in the study OA (n=130)
Analysis set (n=150) NC K&L0 K&L1 K&L2 K&L3 K&L4
Number of patients 20 44 17 20 23 26
Female (%) 60 75 71 70 65 35
Age at entry 57.5 (47–63) 57 (34–79) 59 (51–71) 60.5 (50–81) 60 (30–83) 62.5 (51–78)
Age at onset / 44 (25–74) 50 (16–67) 47 (23–66) 51 (17–68) 41.5 (13–75)
Disease duration / 6 (1–44) 8 (1–44) 11 (1–49) 10 (1–42) 20 (3–64)
Body mass index (kg/m2) 25 (19–31) 25 (19–40) 26 (18.5–39) 23.5 (19–34) 27 (21–37) 28 (22.5–45)
Number of joints
Early morning stiffness / 3 (0–180) 30 (0–120) 5 (0–120) 5 (0–360) 10 (0–120)
% With elevated CRP (>6 mg/l) 5 10 8 16 18 5
Validation set (n=195) NC
OA (n=154)
RA
K&L0 K&L1 K&L2 K&L3 K&L4
Number of patients 16 24 22 32 61 15 25 Female (%) 50 58 77 75 48 46 64 Age at entry 56 (49–64) 61 (43–79) 60 (38–78) 64 (45–92) 68 (43–81) 68 (52–76) 55 (25–77) WOMAC pain / 6 (2–20) 7 (0–20) 8 (2–15) 7 (1–14) 11 (5–17) / WOMAC stiffness / 4 (0–8) 4 (1–6) 4 (1–7) 4 (0–6) 4 (2–7) / WOMAC function / 21 (2–68) 27 (0–45) 27 (6–53) 24 (1–49) 34 (18–44) /
Body mass index (kg/m2) 23 (20–30) 28 (21–44) 31 (23–48) 29 (19–42) 28 (22–41) 31 (23–39) /
% With elevated CRP (>6 mg/l) / 21 18 22 10 14 78
Paired serum and synovial fl uids
(n=19) NC
OA (n=12)
RA
K&L0 K&L1 K&L2 K&L3 K&L4
Number of patients / / 2 3 3 4 7
Female (%) / / 0 67 100 100 57
Age at entry / / 70 (64–77) 67 (67–68) 69 (65–83) 77 (62–81) 58 (44–68)
Age at onset / / 65 (62–68) 67 (62–67) 68 (60–79) 75 (61–77) 44 (24–58)
disease duration / / 5 (1–10) 1 (0.5–1) 3.5 (1–5) 3 (1–24) 10 (1.5–20)
Body mass index (kg/m2) / / 28 (24–33) 29 (24–35) 32 (28–34) 25 (25–36) /
% With elevated CRP (>6 mg/l) / / 0 0 0 0 71
Except where indicated otherwise, values are the median (range).
CRP, C reactive protein; K&L, Kellgren and Lawrence score; NC, negative control subjects; OA, osteoarthritis; RA, rheumatoid arthritis; WOMAC, Western Ontario and McMaster Universities Osteoarthritis Index.
45_annrheumdis135541.indd 1145
Ann Rheum Dis 2011;70:1144–1152. doi:10.1136/ard.2010.135541
1146
(CM10) and nickel affi nity (IMAC-Ni) ProteinChip arrays. Biomarker Wizard software resolved 156 and 134 peaks on CM10 and IMAC-Ni respectively. Ranking of biomarkers in the top 13 is summarised in the Analysis section of table 2, and is made according to the Imp(%) given by the multivariate analy-sis. A p value for each biomarker was also calculated.
Serum validation studies
A new proteomic study (Validation 1) was designed with an independent set of samples (see table 1 and fi gure 1) to con-fi rm the robustness of biomarkers detected after analysis study. The same statistical approaches were used for peak ranking as employed for the Analysis set (table 2, Validation 1 section).
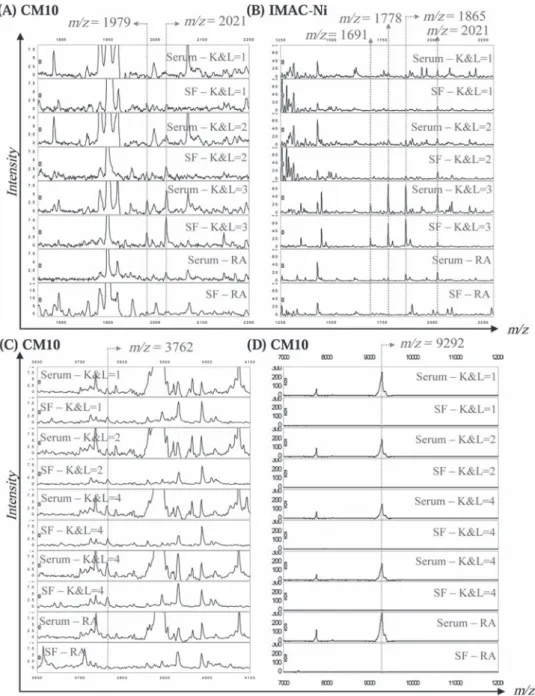
Comparison of the Analysis and Validation studies allowed detection of four potential novel biomarkers at 1979, 2021, 3762 and 9292 m/z values (fi gure 2). Peak intensity distributions in the NC, OA (K&L0 to 4) and RA groups are shown in fi gure 2A–D.
Peak intensities at 1979 and 2021 m/z values were found to be signifi cantly (p<0.001, table 3) increased in all OA samples compared to NC and RA samples, and further increased with increasing K&L scores (fi gure 2A,B).
Intensities at 3762 and 9292 m/z values were signifi cantly higher (m/z=3762) or lower (m/z=9292) (table 3) in OA patients than in control groups, and the former (fi gure 2C) increased with increasing K&L scores of OA patients whereas the lat-ter (fi gure 2D) decreased with increasing K&L scores. Figure 2E–G shows the four biomarkers in gel view spectra from 10 OA patients with K&L0 and 10 with K&L4. The fi gure shows that the biomarkers with m/z values at 1979, 2021 and 3762 are barely detectable in K&L0 but they are present at much higher concentrations in serum samples from patients with Correlation with currently available biomarker assays
In order to further characterise the four putative biomarkers, biomarker peak intensities were correlated at 1979, 2021, 3762 and 9292 m/z values with 20 different biochemical markers associated with cartilage, bone and synovial tissue metabolism (supplementary table 1). These markers had been previously measured by ELISA-based assays9 in 93 of the 154 OA serum samples used in the Validation 1 set, and were equally distrib-uted among the K&L scores.
Statistical analyses
SELDI proteomics data were analysed by two statistical approaches: a non-parametric Mann–Whitney U test and a machine-learning algorithm called Extra-Trees N. The latter approach is a decision-tree multivariate analysis used to build classifi cation models and to rank peaks according to their rela-tive contribution, quantifi ed by a percentage of importance (Imp(%)), in the classifi cation of two groups.34 In this model, m/z peak values were ranked in relation to their Imp(%) for differ-entiating K&L0 from K&L4 groups. First values represent poten-tial biomarkers involved in the development of OA. p Values are associated to this ranking and are considered signifi cant if ≤0.05. For determining the association with currently available biomarkers, ranked data were used to calculate Spearman cor-relation coeffi cients. p Values <0.05 were considered statistically signifi cant.
RESULTS
Serum analysis study
From the 130 OA and 20 NC serum samples (Analysis set, table 1 and fi gure 1), 300 spectra were obtained on cation exchange
Table 2 The m/z values, high percentage of importance (Imp(%)) and corresponding p values of the proteins with concentrations that differed signifi cantly between K&L0 and K&L4 groups
CM10 Analysis Validation 1 Validation 2
ID
m/z Imp(%) Rank p Value Rank Imp(%) Rank p Value Rank p Value Rank
3762 5.68 1 1.9×10⁻⁷ 1 13.62 1 1.1×10⁻⁶ 3 4.4×10⁻³ 27 NI 2021 4.48 2 2.8×10⁻⁵ 9 1.30 19 2.4×10⁻⁴ 17 1.5×10⁻⁴ 14 C3f 3364 3.98 3 1.4×10⁻⁶ 2 NS NS NS NS NS NS NI 4530 3.96 4 2.1×10⁻⁵ 7 NS NS NS NS NS NS CTAPIII variant* (2H+) 8862 3.80 5 2.0×10⁻⁶ 4 NS NS NS NS NS NS β-TG 9292 3.46 6 3.3×10⁻⁵ 10 NS NS 3.4×10⁻⁴ 27 0.01 NS CTAPIII 9060 2.70 7 2.3×10⁻⁵ 8 NS NS NS NS NS NS CTAPIII variant 11 238 2.68 8 1.8×10⁻³ 22 NS NS NS NS NS NS NI 7766 2.59 9 3.7×10⁻⁵ 11 NS NS NS NS NS NS PF4 4430 2.18 10 5.6×10⁻⁶ 5 NS NS NS NS NS NS β-TG* (2H+) 3157 1.99 11 7.5×10⁻⁵ 13 NS NS NS NS NS NS NI 4644 1.98 12 4.7×10⁻⁵ 12 NS NS 3.8×10⁻² 64 NS NS CTAPIII* (2H+) 1979 1.21 13 1.7×10⁻³ 21 2.27 8 3.8×10⁻⁶ 6 1.0×10⁻³ 23 V65 Vitronectin fragment
IMAC Analysis Validation 2
ID
m/z Imp(%) Rank p Value Rank p Value Rank
4286 5.64 1 3.9×10⁻⁴ 3 NS NS NI 11 683 4.45 2 8.8×10⁻⁵ 1 NS NS SAA 2021 4.22 3 3.2×10⁻⁴ 4 2.0×10⁻⁶ 11 C3f 1691 ND ND ND ND 1.6×10⁻⁷ 6 C3f 1778 ND ND ND ND 2.2×10⁻⁷ 8 C3f 1865 ND ND ND ND 1.2×10⁻⁶ 9 C3f
Two statistical analyses, a machine-learning algorithm called Extra-Trees N (Imp%) and a non-parametric Mann–Whitney U test (p values), were used for ranking m/z values according to their relative contribution for differentiating K&L0 and K&L4 groups in the Analysis, Validation 1 and Validation 2 surface enhanced laser desorption/ionisation-time of fl ight-mass spectrometry studies. Ranking of m/z values by both approaches is mentioned in the ‘Rank’ section.
*Doubly charged form (2H+).
β-TG, β-thromboglobulin; CTAPIII, connective tissue-activating peptide III; ND, not detected due to the use of SPA matrix allowing peak detection only from 2000 m/z value; NI, not identifi ed; NS, not statistically signifi cant.
45_annrheumdis135541.indd 1146
Ann Rheum Dis 2011;70:1144–1152. doi:10.1136/ard.2010.135541 1147
m/z values on IMAC-Ni. These new biomarkers are illustrated in fi gure 2H–K and were found to be variants of the 2021 m/z peak as further discussed below. The 2021 m/z biomarker can also be visualised in gel view K&L4 spectra (IMAC-Ni arrays) (fi gure 2K).
Synovial fl uid analysis study
Peaks at 1979, 2021 and 3762 m/z values were simultaneously identifi ed in serum and synovial fl uid samples of OA patients at different K&L scores (fi gure 3). Peaks at 9292 m/z value were only detected in serum, not synovial fl uids, of all OA and RA K&L scores of 4, whereas the opposite is true for the biomarker
at m/z value of 9292.
Validation 2 was performed in a single day with K&L0 (n=24) and K&L4 (n=15) patients from Validation 1, to ensure that these four biomarkers were not artefacts due to the time spent during the Validation 1 study performed over 6 days. It allowed for dis-carding any technical ambiguities and strengthening the validity of the four biomarkers still showing p values below 0.05 (table 2 – Validation 2). Moreover, using α-cyano-4-hydroxycinnamic acid (CHCA), which allows for better visualisation of small pep-tides, new biomarkers were detected at 1691, 1778 and 1865
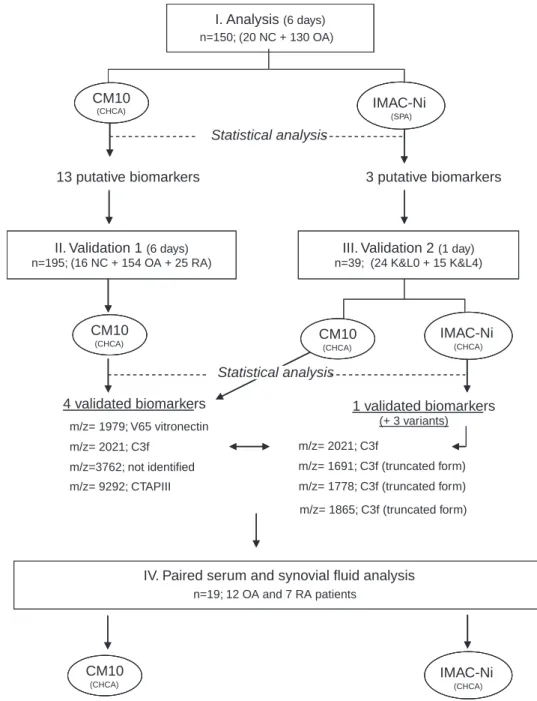
Figure 1 Strategy – 150 serum samples used for analysis were loaded on CM10 and IMAC-Ni ProteinChip arrays. Statistical analysis revealed 13 and three putative biomarkers on CM10 and IMAC-Ni respectively. Therefore, a fi rst validation study (Validation 1) was performed using an independent set of 195 serum samples. These samples were loaded on CM10 but not on IMAC-Ni arrays as only three putative biomarkers were previously detected using this kind of array. Four biomarkers were validated at m/z values of 1979, 2021, 3762 and 9292. A second validation study (Validation 2) was performed using a subset of 39 serum samples, including the K&L0 and K&L4 grades used for Validation 1. Validation 2 was performed on CM10 and IMAC-Ni arrays in a day to minimise variability across the time. CHCA instead of SPA matrix was used for IMAC arrays to better visualise small peptides below 2000 Da such as truncated variants of C3f (m/z=2021). Finally, paired serum and synovial fl uid samples from 12 osteoarthritis (K&L1 to 4) and seven rheumatoid arthritis patients were loaded on CM10 and IMAC-Ni arrays, and analysed to check for the new biomarkers’ presence in both fl uids.
I. Analysis (6 days) n=150; (20 NC + 130 OA)
Statistical analysis
13 putative biomarkers 3 putative biomarkers
II. Validation 1 (6 days) n=195; (16 NC + 154 OA + 25 RA)
III. Validation 2 (1 day) n=39; (24 K&L0 + 15 K&L4) 4 validated biomarkers m/z= 1979; V65 vitronectin m/z= 2021; C3f m/z=3762; not identified m/z= 9292; CTAPIII m/z= 2021; C3f 1 validated biomarkers m/z= 1691; C3f (truncated form) m/z= 1778; C3f (truncated form) m/z= 1865; C3f (truncated form) (+ 3 variants)
IV. Paired serum and synovial fluid analysis
n=19; 12 OA and 7 RA patients
CM10 IMAC-Ni
(SPA) (CHCA)
CM10
(CHCA) CM10(CHCA) IMAC-Ni(CHCA)
CM10 (CHCA) IMAC-Ni (CHCA) Statistical analysis 45_annrheumdis135541.indd 1147 45_annrheumdis135541.indd 1147 4/26/2011 5:24:53 PM4/26/2011 5:24:53 PM
Ann Rheum Dis 2011;70:1144–1152. doi:10.1136/ard.2010.135541
1148
end of CTAPIII and is better known as β-thromboglobulin (β-TG) protein.
Correlation with currently available biomarker assays
Peak intensities corresponding to 1979 (V65 vitronectin frag-ment), 2021 (C3f), 3762 (unknown) and 9292 (CTAPIII) m/z values and detected in spectra generated by 93 OA serum sam-ples, were correlated to a wide range of currently available bio-markers (supplementary table 1). The V65 vitronectin fragment was positively correlated with C-telopeptide of type II collagen (CTXII) and negatively with aggrecan and pro-matrix metallo-protein 1 (pro-MMP-1) (supplementary table 2). The C3f peptide was negatively correlated with aggrecan and pyridinoline (pyd). The protein fragment at 3762 m/z value showed positive corre-lation with cartilage glycoprotein 39 (YKL-40), MMP-3, pyd and patients (fi gure 3). Finally, peaks corresponding to variants of the
2021 m/z biomarker (m/z=1691 and 1778) were also detected in both fl uids.
Biomarkers identifi cation
Proteins at 1979, 2021 and 9292 m/z values were purifi ed using classical chromatography approaches and identifi ed as the C-terminal end product of the V65 vitronectin subunit, the C3f peptide and the connective tissue-activating peptide III (CTAPIII), respectively, as further described in the supplemen-tary data. Peaks at 1691, 1778, 1865 and 2021 m/z values were found clustered on spectra provided by IMAC-Ni arrays, and therefore are variants (truncated form at the C-terminal end by 3, 2 and 1 amino acid respectively) of C3f peptides. The 8862 m/z value is a four amino acid truncated form at the N-terminal
Figure 2 (A–D) Peak intensity distribution of serum biomarkers detected after Validation 1 study on CM10 (m/z=1979, 2021, 3762 and 9292) through the seven groups of patients (negative control subjects, K&L0 1, 2, 3, 4 and rheumatoid arthritis). (E–G) Gel view spectra provided by 20 patients with osteoarthritis (OA) (10 with K&L0 and 10 with K&L4) representing 1979 and 2021, 3762 and 9292 m/z markers respectively. (H–J) Variants (m/z=1691, 1778 and 1865) from m/z 2021 on IMAC-Ni through K&L0 and K&L4 groups after Validation 2 on serum. (K) Gel view spectra provided by 20 patients with OA (10 with K&L0 and 10 with K&L4) representing 1691, 1778, 1865 and 2021 m/z markers after Validation 2 on serum.
45_annrheumdis135541.indd 1148
Ann Rheum Dis 2011;70:1144–1152. doi:10.1136/ard.2010.135541 1149
both fl uids. Accordingly, the serum V65 vitronectin fragment may be derived from joint fl uid/tissues and appeared to be an interesting marker of OA. Clearly, further studies are required to confi rm its diagnostic value.
Vitronectin is a cell adhesion and spreading factor found in serum and in many tissues including cartilage and synovium.35 It is recognised by αVβ3 integrin receptor. Interaction of vitronec-tin through its RGD motif36 has been well described.37–39 Highly expressed αVβ3 integrins have been detected on bone-resorbing osteoclasts and were shown to play an essential role in mediat-ing osteoclast attachment to bone matrix allowmediat-ing active bone resorption.374041 A weak expression of αVβ3 integrin receptor has also been observed on chondrocytes,42 and this has been described as a major player in the regulation of infl ammatory mediators (interleukin 1β, nitric oxide and prostaglandin E2) in OA-affected cartilage,43 but is not thought to be involved in the adhesion of chondrocytes to cartilage44 or transmission for chon-drocyte dedifferentiation.45 The αVβ3 integrin is also found in other joint tissues such as fi broblast-like synoviocytes.46
As cartilage loss and mild to moderate synovial infl ammation are recognised features of OA, especially at advanced stages (K&L3 and 4) of the disease, the V65 vitronectin fragment could play an impor-tant role in the pathogenesis of OA. Moreover, in the present study, OA progression is characterised by elevated serum levels of V65 vitronectin fragments and CTX-II, and low serum levels of aggre-can and pro-MMP-1, a typical pattern of progressive OA when the cell number declines,47 therefore the V65 vitronectin fragment may also be an important marker of disease outcome in OA.
The exact signifi cation of elevated levels of V65 vitronectin in OA remains unknown. Does it act as an agonist of αVβ3 integrins or is it just a consequence of matrix degradation with deoxypyridinoline (dpd), and negatively correlated with
kera-tan sulphate epitope 5D4 (KS). Finally, CTAPIII was positively correlated with MMP-3, tumour necrosis factor α (TNFα) and aggrecan.
DISCUSSION
Using the SELDI-TOF-MS approach, four novel biomarkers for OA were detected, and all appeared to discriminate OA patients from control subjects (NC and RA), RA patients presenting a high DAS28 (>5.1). Two of the biomarkers have been identifi ed as the C-terminal end product of the V65 vitronectin subunit and C3f peptide. A third one at 3762 m/z value remains unidentifi ed due to its high hydrophobicity. These three biomarkers were found with increased levels of expression in sera of patients with severe OA and were also detected in synovial fl uids from the same patients. The fourth novel biomarker was identifi ed as a platelet-specifi c protein, CTAPIII, and was found to have a decreased level of expression in serum from patients with severe OA patients compared to patients with early stage disease. V65 vitronectin fragment
The 1979 m/z peak identifi ed as a C-terminal end product of the V65 vitronectin subunit in the heparin binding domain, was pre-dominantly detected in CM10 spectra of OA patients with the worst disease (K&L3 and 4) in Analysis and Validation studies. However, peak intensities were signifi cantly higher in all OA subsets, including K&L0, compared to control subjects (NC and RA) and further increased with increasing K&L scores. A prelim-inary proteomics study on paired serum samples and synovial fl uids of OA patients revealed the presence of this fragment in
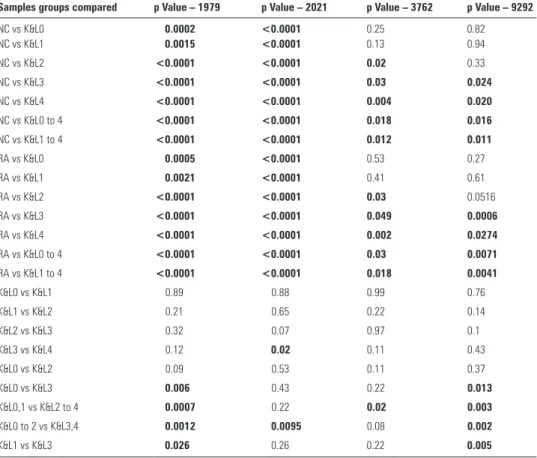
Table 3 p Values illustrating peak intensities differences at m/z values 1979, 2021, 3762 and 9292 between the four K&L subsets and compared to control subjects using data of Validation 1
Samples groups compared p Value – 1979 p Value – 2021 p Value – 3762 p Value – 9292
NC vs K&L0 0.0002 <0.0001 0.25 0.82 NC vs K&L1 0.0015 <0.0001 0.13 0.94 NC vs K&L2 <0.0001 <0.0001 0.02 0.33 NC vs K&L3 <0.0001 <0.0001 0.03 0.024 NC vs K&L4 <0.0001 <0.0001 0.004 0.020 NC vs K&L0 to 4 <0.0001 <0.0001 0.018 0.016 NC vs K&L1 to 4 <0.0001 <0.0001 0.012 0.011 RA vs K&L0 0.0005 <0.0001 0.53 0.27 RA vs K&L1 0.0021 <0.0001 0.41 0.61 RA vs K&L2 <0.0001 <0.0001 0.03 0.0516 RA vs K&L3 <0.0001 <0.0001 0.049 0.0006 RA vs K&L4 <0.0001 <0.0001 0.002 0.0274 RA vs K&L0 to 4 <0.0001 <0.0001 0.03 0.0071 RA vs K&L1 to 4 <0.0001 <0.0001 0.018 0.0041 K&L0 vs K&L1 0.89 0.88 0.99 0.76 K&L1 vs K&L2 0.21 0.65 0.22 0.14 K&L2 vs K&L3 0.32 0.07 0.97 0.1 K&L3 vs K&L4 0.12 0.02 0.11 0.43 K&L0 vs K&L2 0.09 0.53 0.11 0.37 K&L0 vs K&L3 0.006 0.43 0.22 0.013 K&L0,1 vs K&L2 to 4 0.0007 0.22 0.02 0.003 K&L0 to 2 vs K&L3,4 0.0012 0.0095 0.08 0.002 K&L1 vs K&L3 0.026 0.26 0.22 0.005
Statistically signifi cant comparisons are in bold. NC, negative control subjects; RA, rheumatoid arthritis.
45_annrheumdis135541.indd 1149
Ann Rheum Dis 2011;70:1144–1152. doi:10.1136/ard.2010.135541
1150
However, CHCA was used instead of sinapinic acid (SPA) matrix in Validation 2 to better visualise small peptides below 2000 Da. Three peaks, at 1691, 1778 and 1865 m/z values were therefore detected with a high discriminatory power when comparing OA patients with the worst radiographic OA (K&L score 4) to patients with no radiographic OA (K&L score 0). These peaks were clustered on spectra and their m/z values correspond to truncated variants of C3f. C3f peptide is a fragment released during the catabolic degradation of C3b by Factor H after C3 activation.50 C3f is further degraded to form C3f-des-Arg (pep-tide mass of 1865 Da) and variants by carboxypeptidase N. A preliminary proteomics study on serum samples and synovial fl uids of OA patients revealed the presence of C3f peptides in both fl uids. Furthermore, C3f peptide serum levels were signifi -cantly (and positively) correlated with V65 vitronectin serum levels in OA patients tested. Interestingly, vitronectin is also involved in the complement cascade, inhibiting the assembly extracellular matrix (ECM) protein release due to MMP
activa-tion? Indeed, it has been shown that vitronectin is a potential substrate of MMP family members, especially MMP-2, -3, -7 and -9, suggesting that MMPs may participate in the turnover of vitronectin in tissues.48
C3f peptide and variants
The 2021 m/z peak identifi ed as C3f peptide was predominantly detected in IMAC-Ni2+ spectra from OA patients with the worst disease (K&L3 and 4) in both Analysis and Validation studies. Moreover, C3f peptide serum levels were signifi cantly higher in all OA subsets, including K&L0, compared to control subjects (NC and RA) and further increased with increasing K&L scores. A second validation study (Validation 2) was performed in a single day to circumvent false-positive biomarker detection due to extensive sample handling procedures as described by West-Nørager et al,49 and was considered as a quality control study.
Figure 3 Proteomic study on paired serum and synovial fl uid (SF) spectra provided from osteoarthritis (K&L1 to K&L4) and rheumatoid arthritis patients, illustrating presence or absence of peaks at m/z values of 1979 (A), 2021 (A and B), 1691 (B), 1778 (B), 1865 (B), 3762 (C) and 9292 (D) in both fl uids.
45_annrheumdis135541.indd 1150
Ann Rheum Dis 2011;70:1144–1152. doi:10.1136/ard.2010.135541 1151
of knee OA are characterised by low serum levels of CTAPIII, TNFα and MMP-3, also a typical pattern of progressive OA, when cell number declines.
CONCLUSION
The proteomic study detected four novel OA biomarkers. At least two, the V65 vitronectin fragment and C3f, can discrimi-nate OA patients from healthy control subjects (NC) and disease control subjects (RA), and are therefore likely to be potential diagnostic markers for OA. V65 and C3f, as well as the remain-ing unidentifi ed protein at m/z 3762, increased with increasremain-ing radiographic severity of OA and therefore are potential markers of disease stage. The levels of the fourth novel marker, CTAPIII protein, were lower in more severe stages of OA (K&L grades 3 and 4) but higher in both sets of control subjects, and were cor-related to markers of infl ammation suggesting that this marker might refl ect a proinfl ammatory pathway. The proteomics study reported here is based on samples obtained from a cross-sec-tional prospective study, the limitations of which are described in the supplementary data.
There is a need for further studies using serum samples from new cohorts, a wider range of disease control subjects, as well as longitudinal studies to establish the usefulness of the four novel biomarkers identifi ed.
Acknowledgements DdS and MS contributed equally to this work. The authors thank Aline Desoroux, Biserka Relic and GIGA bioinformatics and proteomics platforms (Ulg) for their expert technical assistance.
Funding This study was supported by the National Fund for Scientifi c Research (FNRS, Belgium) and the ‘Fond d’Investissement pour la Recherche Scientifi que’ (FIRS), CHU Liège, Belgium. MF is Research Associate and M-PM and EL are Senior Research Associates at FNRS (National Fund for Scientifi c Research).
Patient consent Obtained. Competing interests None.
Ethics approval This study was conducted with the approval of the institutional review boards (Research Ethics Committee) of both the United Bristol Healthcare NHS trust, Bristol, UK, and the University Hospital, CHU Liège, Belgium. Provenance and peer review Not commissioned; externally peer reviewed.
REFERENCES
1. Guccione AA, Felson DT, Anderson JJ, et al. The effects of specifi c medical conditions on the functional limitations of elders in the Framingham Study.
Am J Public Health 1994;84:351–8.
2. Allman-Farinelli MA, Aitken RJ, King LA, et al. Osteoarthritis – the forgotten obesity-related epidemic with worse to come. Med J Aust 2008;188:317. 3. Garnero P, Ayral X, Rousseau JC, et al. Uncoupling of type II collagen synthesis and
degradation predicts progression of joint damage in patients with knee osteoarthritis.
Arthritis Rheum 2002;46:2613–24.
4. Petersson IF, Boegård T, Dahlström J, et al. Bone scan and serum markers of bone and cartilage in patients with knee pain and osteoarthritis. Osteoarthr Cartil 1998;6:33–9.
5. Petersson IF, Boegård T, Svensson B, et al. Changes in cartilage and bone metabolism identifi ed by serum markers in early osteoarthritis of the knee joint.
Br J Rheumatol 1998;37:46–50.
6. Poole AR, Ionescu M, Swan A, et al. Changes in cartilage metabolism in arthritis are refl ected by altered serum and synovial fl uid levels of the cartilage proteoglycan aggrecan. Implications for pathogenesis. J Clin Invest 1994;94:25–33.
7. Saxne T, Heinegård D. Cartilage oligomeric matrix protein: a novel marker of cartilage turnover detectable in synovial fl uid and blood. Br J Rheumatol 1992;31:583–91. 8. Sharif M, Saxne T, Shepstone L, et al. Relationship between serum cartilage
oligomeric matrix protein levels and disease progression in osteoarthritis of the knee joint. Br J Rheumatol 1995;34:306–10.
9. Davis CR, Karl J, Granell R, et al. Can biochemical markers serve as surrogates for imaging in knee osteoarthritis? Arthritis Rheum 2007;56:4038–47.
10. Sharif M, George E, Shepstone L, et al. Serum hyaluronic acid level as a predictor of disease progression in osteoarthritis of the knee. Arthritis Rheum 1995;38:760–7. 11. Sharif M, Granell R, Johansen J, et al. Serum cartilage oligomeric matrix protein and
other biomarker profi les in tibiofemoral and patellofemoral osteoarthritis of the knee.
Rheumatology (Oxford) 2006;45:522–6.
of the membrane attack complex. Finally, C3f biomarker also showed signifi cant negative correlations with serum levels of aggrecan and pyd.
Signifi cant pathophysiological roles could be played by C3f in cartilage and other joint tissue metabolism. Indeed, comple-ment components can be found in healthy cartilage as they are expressed by chondrocytes. However, their production may be increased in the presence of pathological mediators. Cartilage mainly consists of ECM made with the highly negatively charged proteoglycan (aggrecan). ECM is found settled in net-works of collagen fi bres, which contain many other bound mol-ecules such as small leucine-rich repeat proteins (SLRPs). Some of these SLRPs, such as fi bromodulin (FMOD) and osteoadherin (OSAD), interact with the globular head domain of C1q to further activate the classical and alternative pathways of complement factors.5152 FMOD and OSAD, as well as chondroadherin also interact with Factor H. In OA pathology, where the integrity of the ECM is compromised by proteolytic degradation, SLRPs are released into synovial fl uid becoming exposed to complement factors promoting activation and, hence, further opsonisation of self-tissues, anaphylaxis and general infl ammation. In more severe cases (K&L grades 3 and 4) serum C3f fragments were higher, whereas the levels of circulating aggrecan and pyd were lower. This observation is consistent with the sharp decline of proteoglycan synthesis and the promotion of bone remodelling normally seen in OA patients with progressive disease. Further studies will aim to determine whether there is a direct correlation between these SLRPs and C3f peptides. C3f peptides had been detected in another recent proteomics study53 using purifi cation of short peptides with C18-bound magnetic beads, in sera of patients with systemic sclerosis (SSc). The authors described a predominance of the C3f-des-Arg form in sera of SSc patients. m/z=3762
Peak intensities at 3762 m/z value were signifi cantly increased in OA patients as compared to NC and/or RA patients, and also increased with increasing K&L scores. It has not been possible to identify this protein of interest because of its high hydropho-bicity and diffi culty being ionised. However, it was signifi cantly and positively correlated with serum YKL-40, MMP-3, pyd and dpd levels, and negatively with KS. Therefore, measurement of this biomarker in serum may refl ect overall changes in major joint tissues as it has been associated with cartilage damage (YKL-40, KS), synovial infl ammation (MMP-3) and bone remod-elling (pyd, dpd).54–56
CTAPIII and variants
CTAPIII peak intensities (9292 m/z value) were signifi cantly lower in the OA patient population compared to control sub-jects, and among OA subsets, CTAPIII remained signifi cantly reduced in OA patients with the worst radiographic diseases (K&L score 3 or 4). Variants (β-TG (8862 m/z value), truncated form at 9060 m/z value, doubly charged forms (2H+) at 4644, 4430 and 4530 m/z value) were also detected as discriminatory biomarkers in the Analysis study. However, CTAPIII was the only biomarker having a statistically discriminant p value in the Analysis and Validation studies. CTAPIII and variants were detected in serum samples only, not synovial fl uids, suggesting that these peptides are not locally produced in joints and, there-fore, cannot be joint tissue-specifi c. On the other hand, CTAPIII and variants could be markers of systemic infl ammation, a notion that would be supported by positive correlations with serum levels of TNFα and MMP-3. In other words, severe stages
45_annrheumdis135541.indd 1151
Ann Rheum Dis 2011;70:1144–1152. doi:10.1136/ard.2010.135541
1152
35. Rosenblum G, Carsons S. Quantitation and distribution of vitronectin in synovial fl uid and tissue of patients with rheumatic disease. Clin Exp Rheumatol 1996;14:31–6.
36. Xiong JP, Stehle T, Diefenbach B, et al. Crystal structure of the extracellular segment of integrin alpha Vbeta3. Science 2001;294:339–45.
37. Horton MA. The alpha v beta 3 integrin ‘vitronectin receptor’. Int J Biochem Cell Biol 1997;29:721–5.
38. Nakamura I, Duong le T, Rodan SB, et al. Involvement of alpha(v)beta3 integrins in osteoclast function. J Bone Miner Metab 2007;25:337–44.
39. Rinaldi N, Weis D, Brado B, et al. Differential expression and functional behaviour of the alpha v and beta 3 integrin subunits in cytokine stimulated fi broblast-like cells derived from synovial tissue of rheumatoid arthritis and osteoarthritis in vitro.
Ann Rheum Dis 1997;56:729–36.
40. Nesbitt S, Nesbit A, Helfrich M, et al. Biochemical characterization of human osteoclast integrins. Osteoclasts express alpha v beta 3, alpha 2 beta 1, and alpha v beta 1 integrins. J Biol Chem 1993;268:16737–45.
41. Shinar DM, Schmidt A, Halperin D, et al. Expression of alpha v and beta 3 integrin subunits in rat osteoclasts in situ. J Bone Miner Res 1993;8:403–14.
42. Loeser RF. Integrin-mediated attachment of articular chondrocytes to extracellular matrix proteins. Arthritis Rheum 1993;36:1103–10.
43. Attur MG, Dave MN, Clancy RM, et al. Functional genomic analysis in arthritis-affected cartilage: yin-yang regulation of infl ammatory mediators by alpha 5 beta 1 and alpha V beta 3 integrins. J Immunol 2000;164:2684–91.
44. Kurtis MS, Schmidt TA, Bugbee WD, et al. Integrin-mediated adhesion of human articular chondrocytes to cartilage. Arthritis Rheum 2003;48:110–18.
45. Goessler UR, Bugert P, Bieback K, et al. In vitro analysis of differential expression of collagens, integrins, and growth factors in cultured human chondrocytes. Otolaryngol
Head Neck Surg 2006;134:510–15.
46. Nam EJ, Sa KH, You DW, et al. Up-regulated transforming growth factor beta-inducible gene h3 in rheumatoid arthritis mediates adhesion and migration of synoviocytes through alpha v beta3 integrin: regulation by cytokines. Arthritis Rheum 2006;54:2734–44.
47. Di Cesare PE. Pathogenesis of osteoarthritis. In: Firestein GS, Budd RC, Harris ED Jr, McInnes IB, Ruddy S, Sergent JS, eds. Kelley’s Textbook of Rheumatology. 8th edition. Philadelphia, PA: Saunders 2008:1525–46.
48. Imai K, Shikata H, Okada Y. Degradation of vitronectin by matrix metalloproteinases-1, -2, -3, -7 and -9. FEBS Lett 1995;369:249–51.
49. West-Nørager M, Kelstrup CD, Schou C, et al. Unravelling in vitro variables of major importance for the outcome of mass spectrometry-based serum proteomics.
J Chromatogr B Analyt Technol Biomed Life Sci 2007;847:30–7.
50. Ganu VS, Müller-Eberhard HJ, Hugli TE. Factor C3f is a spasmogenic fragment released from C3b by factors I and H: the heptadeca-peptide C3f was synthesized and characterized. Mol Immunol 1989;26:939–48.
51. Sjöberg A, Onnerfjord P, Mörgelin M, et al. The extracellular matrix and infl ammation: fi bromodulin activates the classical pathway of complement by directly binding C1q.
J Biol Chem 2005;280:32301–8.
52. Sjöberg AP, Manderson GA, Mörgelin M, et al. Short leucine-rich glycoproteins of the extracellular matrix display diverse patterns of complement interaction and activation.
Mol Immunol 2009;46:830–9.
53. Xiang Y, Matsui T, Matsuo K, et al. Comprehensive investigation of disease-specifi c short peptides in sera from patients with systemic sclerosis: complement C3f-des-arginine, detected predominantly in systemic sclerosis sera, enhances proliferation of vascular endothelial cells. Arthritis Rheum 2007;56:2018–30.
54. Johansen JS, Hvolris J, Hansen M, et al. Serum YKL-40 levels in healthy children and adults. Comparison with serum and synovial fl uid levels of YKL-40 in patients with osteoarthritis or trauma of the knee joint. Br J Rheumatol 1996;35:553–9. 55. Manicourt DH, Fujimoto N, Obata K, et al. Serum levels of collagenase,
stromelysin-1, and TIMP-1. Age- and sex-related differences in normal subjects and relationship to the extent of joint involvement and serum levels of antigenic keratan sulfate in patients with osteoarthritis. Arthritis Rheum 1994;37:1774–83.
56. Mora S, Pitukcheewanont P, Kaufman FR, et al. Biochemical markers of bone turnover and the volume and the density of bone in children at different stages of sexual development. J Bone Miner Res 1999;14:1664–71.
12. Sharif M, Kirwan JR, Elson CJ, et al. Suggestion of nonlinear or phasic progression of knee osteoarthritis based on measurements of serum cartilage oligomeric matrix protein levels over fi ve years. Arthritis Rheum 2004;50:2479–88.
13. Xiang Y, Sekine T, Nakamura H, et al. Proteomic surveillance of autoimmunity in osteoarthritis: identifi cation of triosephosphate isomerase as an autoantigen in patients with osteoarthritis. Arthritis Rheum 2004;50:1511–21.
14. Xiang Y, Sekine T, Nakamura H, et al. Fibulin-4 is a target of autoimmunity predominantly in patients with osteoarthritis. J Immunol 2006;176:3196–204. 15. Kamphorst JJ, van der Heijden R, DeGroot J, et al. Profi ling of endogenous peptides
in human synovial fl uid by NanoLC-MS: method validation and peptide identifi cation.
J Proteome Res 2007;6:4388–96.
16. Gobezie R, Kho A, Krastins B, et al. High abundance synovial fl uid proteome: distinct profi les in health and osteoarthritis. Arthritis Res Ther 2007;9:R36.
17. Vincourt JB, Vignaud JM, Lionneton F, et al. Increased expression of matrilin-3 not only in osteoarthritic articular cartilage but also in cartilage-forming tumors, and down-regulation of SOX9 via epidermal growth factor domain 1-dependent signaling.
Arthritis Rheum 2008;58:2798–808.
18. Haglund L, Bernier SM, Onnerfjord P, et al. Proteomic analysis of the LPS-induced stress response in rat chondrocytes reveals induction of innate immune response components in articular cartilage. Matrix Biol 2008;27:107–18.
19. Wu J, Liu W, Bemis A, et al. Comparative proteomic characterization of articular cartilage tissue from normal donors and patients with osteoarthritis. Arthritis Rheum 2007;56:3675–84.
20. Catterall JB, Rowan AD, Sarsfi eld S, et al. Development of a novel 2D proteomics approach for the identifi cation of proteins secreted by primary chondrocytes after stimulation by IL-1 and oncostatin M. Rheumatology (Oxford) 2006;45:1101–9. 21. De Ceuninck F, Marcheteau E, Berger S, et al. Assessment of some tools for the
characterization of the human osteoarthritic cartilage proteome. J Biomol Tech 2005;16:256–65.
22. Ruiz-Romero C, Blanco FJ. Proteomics role in the search for improved diagnosis, prognosis and treatment of osteoarthritis. Osteoarthr Cartil 2010;18:500–9. 23. De Ceuninck F, Berenbaum F. Proteomics: addressing the challenges of
osteoarthritis. Drug Discov Today 2009;14:661–7.
24. Baillet A, Trocmé C, Berthier S, et al. Synovial fl uid proteomic fi ngerprint: S100A8, S100A9 and S100A12 proteins discriminate rheumatoid arthritis from other infl ammatory joint diseases. Rheumatology (Oxford) 2010;49:671–82. 25. De Bock M, de Seny D, Meuwis MA, et al. Challenges for biomarker discovery in
body fl uids using SELDI-TOF-MS. J Biomed Biotechnol 2010;2010:906082. 26. Tang N, Tornatore P, Weinberger SR. Current developments in SELDI affi nity
technology. Mass Spectrom Rev 2004;23:34–44.
27. Trocmé C, Marotte H, Baillet A, et al. Apolipoprotein A-I and platelet factor 4 are biomarkers for infl iximab response in rheumatoid arthritis. Ann Rheum Dis 2009;68:1328–33.
28. Weinberger SR, Boschetti E, Santambien P, et al. Surface-enhanced laser desorption-ionization retentate chromatography mass spectrometry (SELDI-RC-MS): a new method for rapid development of process chromatography conditions.
J Chromatogr B Analyt Technol Biomed Life Sci 2002;782:307–16.
29. Kellgren JH, Lawrence JS. Radiological assessment of osteo-arthrosis.
Ann Rheum Dis 1957;16:494–502.
30. Arnett FC, Edworthy SM, Bloch DA, et al. The American Rheumatism Association 1987 revised criteria for the classifi cation of rheumatoid arthritis. Arthritis Rheum 1988;31:315–24.
31. Prevoo ML, van ‘t Hof MA, Kuper HH, et al. Modifi ed disease activity scores that include twenty-eight-joint counts. Development and validation in a prospective longitudinal study of patients with rheumatoid arthritis. Arthritis Rheum 1995;38:44–8. 32. de Seny D, Fillet M, Meuwis MA, et al. Discovery of new rheumatoid arthritis
biomarkers using the surface-enhanced laser desorption/ionization time-of-fl ight mass spectrometry ProteinChip approach. Arthritis Rheum 2005;52:3801–12.
33. de Seny D, Fillet M, Ribbens C, et al. Monomeric calgranulins measured by SELDI-TOF mass spectrometry and calprotectin measured by ELISA as biomarkers in arthritis.
Clin Chem 2008;54:1066–75.
34. Geurts P, Fillet M, de Seny D, et al. Proteomic mass spectra classifi cation using decision tree based ensemble methods. Bioinformatics 2005;21:3138–45.
45_annrheumdis135541.indd 1152
doi: 10.1136/ard.2010.135541
February 28, 2011
2011 70: 1144-1152 originally published online
Ann Rheum Dis
Dominique de Seny, Mohammed Sharif, Marianne Fillet, et al.
of four novel biomarkers for osteoarthritis
Discovery and biochemical characterisation
http://ard.bmj.com/content/70/6/1144.full.html
Updated information and services can be found at:
These include:
Data Supplement
http://ard.bmj.com/content/suppl/2011/01/27/ard.2010.135541.DC1.html
"Web Only Data"
References
http://ard.bmj.com/content/70/6/1144.full.html#ref-list-1
This article cites 55 articles, 18 of which can be accessed free at:
service
Email alerting
the box at the top right corner of the online article.
Receive free email alerts when new articles cite this article. Sign up in
Collections
Topic
(1855 articles)
Rheumatoid arthritis
(547 articles)
Inflammation
(2862 articles)
Immunology (including allergy)
(2452 articles)
Connective tissue disease
(594 articles)
Osteoarthritis
(2909 articles)
Musculoskeletal syndromes
(2705 articles)
Degenerative joint disease
Articles on similar topics can be found in the following collections
Notes
http://group.bmj.com/group/rights-licensing/permissions
To request permissions go to:
http://journals.bmj.com/cgi/reprintform
To order reprints go to:
http://group.bmj.com/subscribe/