INTRA-ANNUAL CAMBIAL ACTIVITY AND CHANGES IN CARBON 1
AVAILABILTY IN STEM OF TWO POPLAR CLONES 2
Annie Deslauriers12*, Alessio Giovannelli3, Sergio Rossi1, Gaetano Castro4, Giuseppe 3
Fragnelli4, Laura Traversi3 4
1
Département des Sciences Fondamentales, Université du Québec à Chicoutimi, 555 5
Boulevard de l'Université, Chicoutimi (QC), Canada 6
2
Dipartimento Territorio e Sistemi Agro-Forestali, Università degli Studi di Padova, 7
viale dell’Università 16, 35020 Legnaro (PD), Italy 8
3
Laboratorio Xilogenesi, Istituto Valorizzazione Legno e Specie Arboree, IVaLSA-9
CNR, via Madonna del Piano, 50019 Sesto Fiorentino (FI), Italy 10
4
Unità di Ricerca per le Produzioni Legnose Fuori Foresta, CRA, strada per Frassineto, 11
15033 Casale Monferrato (AL), Italy 12
*Corresponding author: Annie Deslauriers, Département des Sciences Fondamentales, 13
Université du Québec à Chicoutimi, Chicoutimi (Québec), G7H2B1, Canada. Email: 14
annie_deslauriers@uqac.ca 15
Running title: xylogenesis and carbon in poplar 16
SUMMARY 1
Cambium activity is influenced by many environmental and physiological factors and 2
among them, carbon acts as a source of energy for the growing meristems. This work 3
focussed on the intra-annual stem growth of poplar compared with the carbon available 4
for xylogenesis processes in cambium and outer wood. The major stages of xylem 5
production and differentiation in two poplar clones with different growth performances 6
were considered. Monitoring of stem growth and leaf phenology combined with starch, 7
non-structural soluble sugars and water content in the stem was conducted from 8
February to November 2006 in Populus × canadensis Moench ‘I-214’ and P. deltoides 9
‘Dvina’. Anatomical analyses of wood formation were performed by measuring the 10
width of the zones with differentiating and mature xylem. At the end of the growing 11
period, wood density was assessed by microdensity analyses. Xylem differentiation at 12
the top of the tree started at the beginning of April for both clone and proceeded down 13
the stem at about 0.5 m day-1, occurring almost at the same time then leaf opening. The 14
rate of growth and wood density was superior in Dvina but this higher productivity 15
could not be explained by differences in number of cambial initial and durations of 16
xylogenesis. However, the most productive clone showed higher glucose, fructose and 17
sucrose contents in the outer wood. The available non-structural soluble sugars in the 18
cambial zone followed the intra-annual pattern of xylem formation, with higher 19
concentration when growth rate was maximum. The accumulations of non structural 20
soluble sugars at a certain time during stem growth corresponded with higher carbon 21
availability to the actively growing meristems in the stem. 22
Key words: Cambial activity, carbohydrates, cell differentiation, phenology, wood 1
density 2
INTRODUCTION 1
Poplar hybrids present a wide variability in phenology, productivity and growth rate, 2
leading to differences in biomass production and wood properties (Pellis et al. 2004, 3
Monclus et al. 2005, Giovannelli et al. 2007). The different productivities have mainly 4
been explained by intrinsic leaf features (Ceulemans and Deraedt 1999, Pellis et al. 5
2004, Monclus et al. 2005), which correspond to the energy source for growth. In the 6
stem, soluble carbohydrates are the main source of energy for cell production and 7
differentiation. However, few studies are available on intra-annual carbohydrate 8
availability for wood production in broadleaves (Piispanen and Saranpää 2001, 9
Barbaroux and Bréda 2002, Hoch et al. 2003). These studies focused on carbohydrate 10
content in the stem but did not consider the meristem at the origin of wood production, 11
the cambium. In modelling the influence of assimilates availability on plant growth, 12
Thaler and Pagès (1998) found that root growth depends on assimilate allocation. In 13
selected poplars and eucalyptus, the rapid increase in height corresponded to high 14
carbohydrate use in meristems (Kozlowski 1992). However, to our knowledge, no 15
comparative analysis has been done between wood formation and carbon availability at 16
an intra-annual level. 17
Recently, there have been major steps forward in the comprehension of cambial activity 18
and xylogenesis through anatomical analyses (Fonti et al. 2007, Čufar et al. 2008, Rossi 19
et al. 2006b, Deslauriers et al. 2008), but none included the role of available soluble 20
carbohydrates in the seasonal dynamics of wood formation in stem. Like all processes 21
of cell differentiation, the cambial zone during xylogenesis may be considered as a 22
powerful carbon sink. The metabolic processes involved in cambial cell division, as 23
well as differentiation of cambial cell derivatives, require energy. In particular, the 1
conversion of photo-assimilates in the cambium is enhanced during growth in order to 2
support the formation of structural elements like cell walls (Krabel 2000). Even if the 3
involvement of non-structural carbohydrates in xylogenesis has already been reported 4
(as energy, structural carbon supply and chemical signal), some physiological aspects of 5
their role in the different stages of xylem formation remain more or less unexplored. 6
Wood formation is a cyclical and gradual proliferation of xylem cells in which phases of 7
cell production and differentiation are separated in space and time. Differentiation 8
follows cell division occurring in the cambium. As the new derivative cells differentiate, 9
other cells are produced, leading to the typical bell-shaped pattern of variation during 10
the year, in which growth onset, maximum rate and ending are the crucial phenological 11
stages (Rossi et al. 2006b). Some of these critical stages, such as onset and maximum 12
growth rate have been related to environmental factors such as temperature and 13
photoperiod (Rossi et al. 2006c, Čufar et al. 2008, Rossi et al. 2008b), but carbohydrate 14
availability during these phases of growth has rarely been taken into consideration in 15
order to better understand the mechanisms of stem growth in trees. Sugar content in 16
wood has been analysed for some phenological stages, such as dormancy (Yoshioka et 17
al. 1988, Magel et al. 2001, Piispanen and Saranpää 2001) and bud break (Kozlowski 18
1992, Sauter and van Cleve 1994) but has not been directly associated with xylogenesis. 19
This paper focuses on the relationship between stem growth and non-structural soluble 20
carbohydrates. We tested the hypothesis that an enhanced xylogenesis is linked with 21
higher non-structural soluble carbohydrates in the cambial zone and wood. This 22
hypothesis was verified by considering the non-structural soluble carbohydrates related 23
to (i) the different growth performances of two poplar clones and (ii) the different 1
phases of the intra-annual pattern of xylogenesis. Several morpho-physiological factors 2
were assessed (phenology, xylogenesis, stem density and stem water content) as they 3
could also play an important role in the growth performance of the clone and the intra-4
annual pattern of wood formation. 5
MATERIALS AND METHODS 1
Study site 2
The study was conducted at the Poplar Research Institute, in Casale Monferrato (AL), 3
Piedmont, Italy (45°07'52’N, 8°30'17’E, 106 m a.s.l.). The climate of the site is 4
temperate with an equinoctial rainfall distribution. Long-term (1926-2005) average 5
annual temperature is 12.1 °C with total rainfall of 765 mm and annual 6
evapotranspiration rate (ET0-FAO) of 879 mm. The plantation consisted of one-year-7
old coppice of Populus × canadensis Moench ‘I-214’ and P. deltoides ‘Dvina’ arranged 8
in 350-m-long rows with an interrow distance of 2 m and 0.5 m within rows, on an 9
alluvial sandy-loam soil. Along four alternating internal rows (two per clone), 140 stems 10
of average dimensions, one per stool, were selected and numbered. The average stem 11
diameters at 0.3 m were 25.6±8.9 mm for Dvina and 17.9±8.9 mm for I-214. During 12
most of the experiment, the plantation was left with natural rainfall, being irrigated only 13
during a long dry period. 14
Samples collection 15
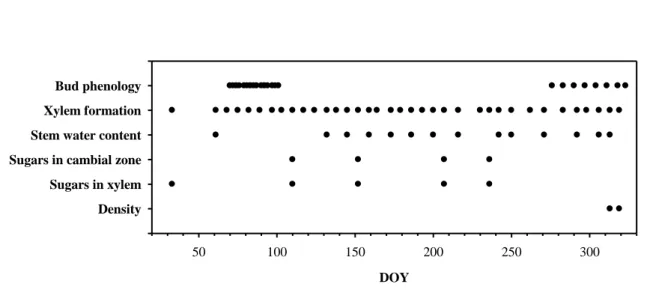
From February to November 2006, tree growth and phenology was monitored, 16
combined with soluble carbohydrates and water content in the stem (figure 1). Three 17
stems were randomly harvested in each row and measured (height and diameter at 0.3 18
m) each week from day of the year (DOY) 61 to 319, except for one set of samples 19
collected on DOY 33. Sampling was done in the early morning to avoid the period of 20
excessive transpiration. Stem discs of 1-2 cm thickness were cut at 0.3 m from the collar 21
and at 1 m from the top for anatomical measurements of wood formation (figure 2). For 22
the stem water content analysis, additional stem portions of 5 cm were cut on 14 1
sampling days (figures 1-2). For soluble carbohydrates content analysis, wood samples 2
of 25 cm in length were collected above the samples of xylem formation (figure 2) on 3
five sampling days (figure 1) corresponding to the main stages of cambial activity: (i) 4
dormancy, (ii) onset of xylem differentiation, (iii) maximum growth rate, (iv) 5
decreasing and (v) ending of xylem differentiation. Microdensity was assessed at the 6
end of the vegetative period (figure 1) on 24 (12 per clone) 2-mm-thick sections 7
collected at 0.3 m from the collar (figure 2). 8
Bud Phenology 9
Bud phenology and leaf abscission were monitored twice per week (figure 1) and bud 10
break stages were divided in five classes according to Castellani et al. (1967): stage 1, 11
buds swelling with slight separation of the scales; stage 2, bud break initiated at the 12
apical part of the bud with leaves visible; stage 3, bud break with leaves open but still 13
joined together and scales still present; stage 4, leaves slightly open with or without 14
scales; stage 5, small leaves completely open but of smaller sizes than mature leaves 15
and shoots elongating. 16
Anatomical measurements of radial growth 17
Stem discs were placed in ethanol (50% in water) and stored at 5 °C. The discs, or slices 18
of them, were embedded in paraffin and transverse sections 8-12 µm thick were cut with 19
a rotary microtome, dried at 50 °C for 1 hour and cleaned of the residual paraffin with 20
successive immersions in D-limonene and ethanol (Rossi et al. 2006a). The sections 21
were stained with a solution of 0.04% safranin, 0.15% astrablue and 2% acetic acid in 22
distilled water (van der Werf et al. 2007) and permanently fixed with histological 1
mounting medium (Eukitt) to observe the developing tissues. The cambial zone and 2
xylem in radial enlargement showed only primary walls, which did not shine under 3
polarized light (figure 3 a-b, d). Xylem in secondary wall thickening phase shone under 4
polarized light with walls changing from blue at the beginning of the process to red at 5
mature state (figure 3a, c). Lignification was characterized by the appearance of red, 6
initiating in the middle lamella and spreading into the secondary walls of the 7
differentiating cells (figure 3a). 8
Two types of measurements were taken on the sample: (i) the width of the zone 9
containing both vessels and fibres in differentiation (µm), including cells in radial 10
enlargement and wall thickening (enl and wt respectively in figure 3a); and (ii) the total 11
width of xylem formed (µm), including differentiating and mature cells (zones of enl, 12
wt and mc, figure 3a). The measuring was done on photographs taken with a Nikon 13
camera fixed on a microscope at magnifications of 2-50×, according to the width of the 14
measured zones. When the total width of xylem formed exceeded 2000 µm, 15
measurements were taken using a binocular to the nearest 10 µm with a semiautomatic 16
measuring system connected to a computer. In spring, when at least one horizontal row 17
of vessels was observed in the enlarging phase (figure 3d), xylem formation was 18
considered to have begun. In late summer, when no further cell was observed in wall 19
thickening and lignification, xylem formation was considered complete. 20
Density measurements 1
Sections were air-dried at 12% moisture content and X-rayed together with a calibration 2
wedge following standard techniques (Polge 1978, Mothe et al. 1998). Radiographs 3
were digitalised using a scanner and the acquired grey scale digital images were treated 4
using semi-automatic procedures (Mothe et al. 1998). Density values (kg m-3) were 5
assigned to each pixel of the wood samples by comparing their grey scales with those of 6
the calibration wedge. Each tree-ring was divided into 20 segments of equal width and 7
the tree-ring density profiles were produced by averaging the values obtained from these 8
segments. For each wood section, mean density determined by X-ray transmission was 9
compared with the density directly determined by measuring the mass per volume unit 10
in order to correct the microdensity measurements. 11
Stem water content 12
Discs for water content analysis were immediately wrapped in plastic film and weighed 13
to determine the fresh mass (g) within 15 minutes after harvest. The fresh volume of 14
samples (cm3) was assessed by water displacement (Borghetti et al. 1991). The dry mass 15
(g) was measured on the sample after it was maintained at 72 °C for 96 hours. Relative 16
stem water content (RWC) was calculated following Domec and Gartner (2001): 17 100 * ) ( f s d f V V M M RWC 18
Where Mf and Md are the fresh and dry mass of the wood (g) respectively and Vf and Vs
19
are the volume of fresh and solid material (cm3) respectively. Vs was estimated by
dividing Md by 1.53 assuming a density of 1.53 g cm-3 for dry cell-wall material (Skaar,
1
1988). 2
Soluble sugars and starch analysis 3
The samples were frozen in liquid nitrogen and freeze-dried for ten days. After 4
removing the bark, a white powder containing tissues of the cambial zone (CZ) was 5
collected by scraping the middle part between bark and xylem with a scalpel, except 6
during dormancy when cambial tissues were not separable (DOY 33). The mature 7
xylem (MX) of the current year (figure 2) was collected and reduced to a fine powder 8
with a rotor mill. During dormancy (DOY 33), MX corresponded to the tree-ring of the 9
previous year of growth (figure 2). The dried powders were kept under vacuum at -20 10
°C until sugar extraction. 11
For both CZ and MX, 40 mg dried powder were repetitively extracted three times in 5 12
ml of 80% EtOH, adjusted to pH 7, at room temperature. The 15 ml solution was 13
evaporated to dryness at room temperature with a Savant Speedvac Plus SC210A 14
system and diluted with 2 ml of distilled water (pH 7). The obtained solution was then 15
fractionated using liquid-solid extractions carried out by eluting samples through (i) a 16
reverse-phase cyclohexyl resin (pre-packed 3 ml Bond Elut CH cartridge, Varian CA, 17
USA) and (ii) a quaternary-amine, strong anion-exchange resin (pre-packed 3ml Bond 18
Elut SAX cartridge, Varian CA, USA). The cartridges were activated by 6 ml MeOH 19
and conditioned by adding 6 ml of distilled water. The elution was performed using an 20
additional 6 ml of distilled water, evaporated to dryness under vacuum and then diluted 21
with 0.5 mm of distilled water. Analyses were conducted using a binary LC pump 250 22
(Perkin Elmer, USA) equipped with an automatic injection system (ISS101, Perkin 1
Elmer). A Water Column Heater Module (Waters Division, Millipore, Milford, MA, 2
USA) controlled by a Temperature Control Module (Waters) maintained the column at 3
80 °C. The column was an 8×300 mm Shodex Sugar SC 1011 (Showa Denko Europe 4
GmbH, Germany) equipped with a Guard Pak Insert Sugar Pak II (Waters). The mobile 5
phase was water, Milli Q grade, at 0.5 ml min-1. 6
Identification and quantification of soluble carbohydrates was performed according to 7
Romani et al. (1994) and the identity of soluble carbohydrates was confirmed using 8
authentic carbohydrate standards (Sigma, USA) and adding an internal standard. The 9
recovery was estimated for each carbohydrate. Thus 0.25, 0.50, 0.75, and 1.0 ml 1mg 10
ml-1 carbohydrate solutions were fractionated and analysed as previously described, 11
with recovery ranging from 92 to 99%. Calibration curves were performed for raffinose, 12
sucrose, glucose, galactose, fructose, mannitol and sorbitol. Total soluble sugar content 13
was obtained as the sum of the detected sugars (>0.1 µmol g-1DW). 14
Starch was measured in the pellet remaining after extraction with 80% ethanol 15
according to Gucci et al. (1991). After incubation at 55°C for 16 h with 16
amyloglucosidase (Flucka), samples were diluted with distilled water to 5 ml and three 17
0.25-ml aliquots and each sample were assayed colorimetrically by using glucose 18
oxidase (Sigma). Absorbance was read at 440 nm. For I-214 clone, the amount of pellet 19
remaining after extraction of soluble sugars form cambium on DOY 207 was not 20
sufficient to perform the starch analysis. 21
Statistical analyses 1
Gompertz functions were fitted by nonlinear regressions (NLIN procedure in SAS) in 2
order to estimate the pattern of radial and height growth (y) against time (t, computed in 3
DOY) (Rossi et al. 2003): 4 ) exp( e( t) A I y 5
Where the parameters A, and κ are the growth asymptote, the time-axis placement and 6
rate of change of the curve, respectively and I represents the initial growth, which is set 7
to zero for radial growth. The estimated tree height at the end of growth is obtained by 8
summing parameters I and A. In the Gompertz function, the inflection point (tp)
9
corresponds to the culmination of growth rate (Rossi et al. 2006c), defined as: 10 p t 11
From the estimated parameters, the weighted mean absolute rate of growth (r) was 12
calculated according to Deslauriers et al. (2003): 13 4 A r 14
The seasonal changes in soluble sugars were compared between clones using analysis of 15
variance (ANOVA by GLM procedure, SAS system). A factorial model was used to test 16
the effects of clone and sampling date. For each sampling date, differences between 17
clones were found using LS-means (Quinn and Keough 2002). 18
RESULTS 1
Leaf phenology and height growth 2
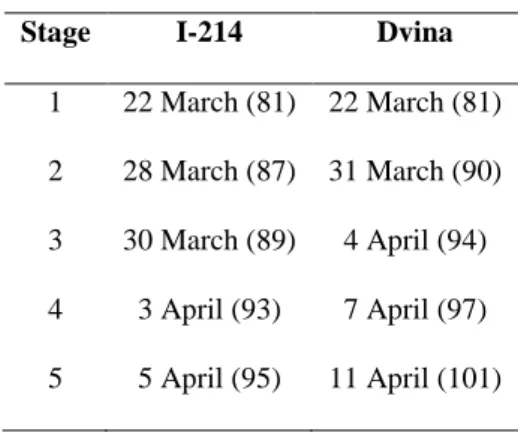
Bud development started in both clones in March (DOY 81) when bud swelling (stage 3
1) was observed (table 1). However, during the next stages, I-214 demonstrated faster 4
bud development with stage 2 and 3 (bud opening but leaves still joined together) 5
realized within 6 days. The completion of leaf opening was observed earlier for I-214, 6
on 5 April (DOY 95), indicating that bud development lasted 14 days (table 1). For 7
Dvina, stage 5 was reached one week later with a bud development of 21 days. Leaf 8
abscission began on 10 October (DOY 283) for both clones and lasted about 35 days. 9
Lignification of apical buds ended earlier for I-214 than Dvina. Overall, leaves were 10
present for about 200 days. 11
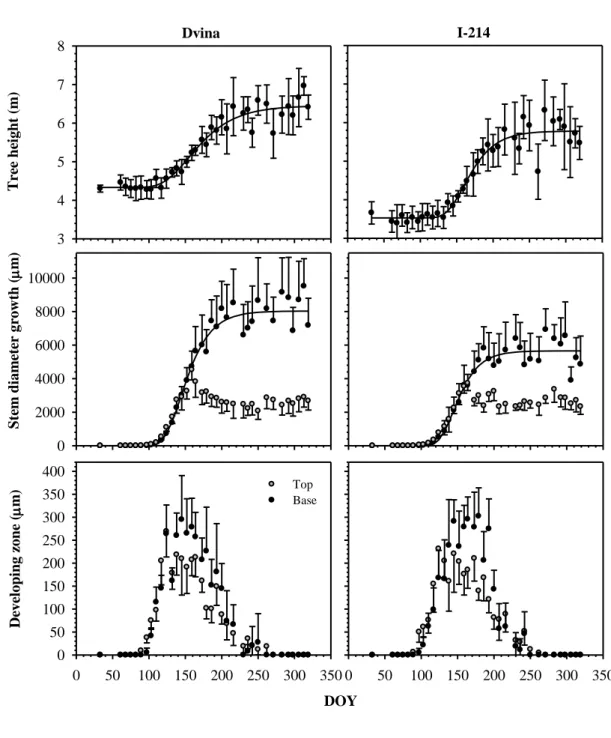
Despite differences in the initial height of the plants (4.33 m for Dvina versus 3.52 m 12
for I-214), both clones had similar height growth during 2006 (table 2, figure 4), 13
estimated at ca. 2 m. Compared with Dvina, I-214 had a higher rate of apical growth 14
(0.036 m day-1), earlier height culmination (about 10-20 days), but reached maximum 15
growth rate later (DOY 159). Dvina concluded apical growth at a total height of 6.45 m, 16
compared with 5.77 m for I-214 (figure 4). 17
Xylem phenology, radial growth and density 18
Similar seasonal dynamics of cambial activity were observed in the two clones. In 19
winter, the dormant cambium was composed of two-four rows of cells close together. 20
During exponential radial growth, the number of rows of cambial cells increased to 21
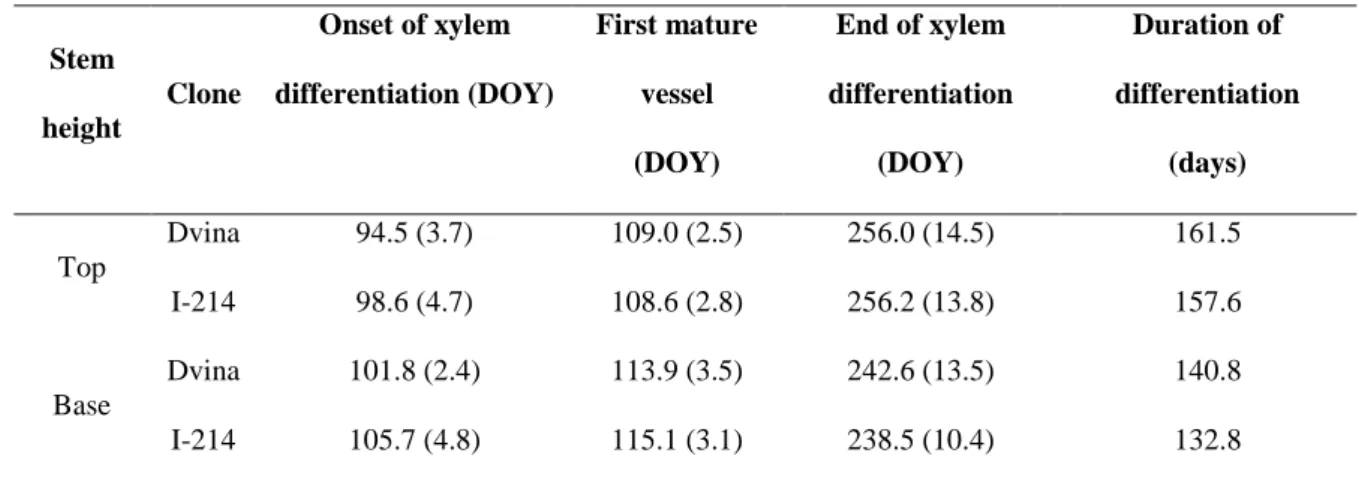
eight (data not shown). At the top, xylem differentiation started on 5 April (DOY 95) 1
and 9 April (DOY 99) for Dvina and I-214, respectively (table 3). At the base, xylem 2
differentiation started one week later in both clones. At both sampling heights, the first 3
vessels were mature 10-14 days after the onset of xylem differentiation and were 4
therefore observed earlier at the top of the stem. 5
In April, the width of differentiating xylem increased rapidly, reaching a maximum of 6
300 and 220 µm at the base and at the top of the stem respectively at the beginning of 7
June. Similar amplitudes of differentiating xylem were observed between the clones 8
(figure 4). In July-August, the width of the differentiating xylem decreased with a first 9
minimum achieved on DOY 230. From DOY 230, a new resumption of cambial cells 10
division and differentiation was observed, which appeared as a small false ring in 11
several stems and led to higher variations in the end of xylem differentiation. At the top, 12
xylem formation ended on DOY 256 for both clones, two weeks later than the base 13
(Table 3). Xylogenesis duration at the top was about 160 days, three weeks longer than 14
at the base, with no marked differences between clones (table 3). 15
The seasonal trend of xylem production at the base was characterized by a sharp 16
increase, followed by a plateau indicating the end of radial growth (figure 4). Dvina had 17
higher rates of radial growth and produced wider tree rings, of 8030 µm, compared with 18
5656 µm for I-214 (table 2). Both clones reached their maximum growth rates at the end 19
of May, on DOY 144. Stem radial growth at the top decreased slightly from DOY 165 20
and remained constant. On that date, height growth had exceeded 1 m and the collected 21
discs were located in the 1-year-old stem, at a constant distance from the growing buds 22
(figure 4). 23
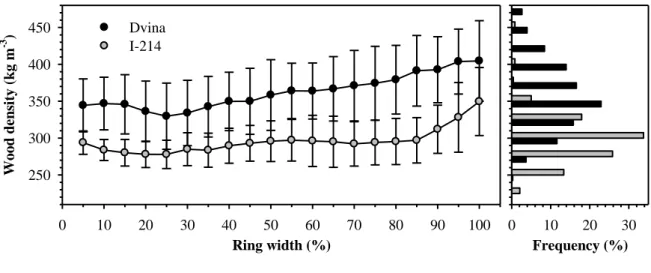
The density profiles were similar in the two clones, but with lower values for I-214 1
(figure 5). In Dvina, wood density gradually increased from 350 to 400 kg m-3 along the 2
tree ring. In I-214, the density remained at values between 275 and 300 kg m-3 except 3
for the last 10% of the ring width, showing an abrupt increase in density. 4
Stem water status 5
Similar trends of relative stem water content were observed in the clones, with values 6
more or less following the distribution of precipitations (figure 6). During dormancy, I-7
214 had lower relative stem water content than Dvina (63% versus 80%). After cambial 8
reactivation, relative stem water content decreased around DOY 150, when the width of 9
the zones containing cells in enlargement and wall thickening was at its maximum. 10
Relative stem water content reached its minimum values (40-50%) at the end of ring 11
width formation. 12
Soluble sugars and starch analysis 13
The major soluble sugars detected were glucose and fructose, together representing 70 14
and 90% of the total soluble sugars during dormancy and the growing period, 15
respectively (figure 7). Sucrose represented 12% in MX and 6% in CZ of the total 16
soluble sugars while raffinose, galactose and mannitol were only detected in small 17
quantities in MX (<8 µmol g-1 DW, table 4). In CZ, the total soluble sugars were about 18
ten-fold higher than in MX. For all major soluble sugars, Dvina showed higher 19
quantities, except for sucrose in MX (table 5, figure 7). Significant differences were 20
observed also between sampling dates (DOY, table 5), although no interaction 21
clone×DOY was observed (p<0.05, table 5). 22
In MX, the total amounts of soluble sugars were mainly related to glucose and sucrose 1
with high concentrations in winter, a decrease during the onset of xylem differentiation 2
(DOY 110) and a further increase in correspondence to the maximum growth rate (DOY 3
152). Afterwards, a new minimum was reached during decreasing (DOY 207) and 4
ending (DOY 236) of xylem differentiation (figure 7). The same seasonal trend was 5
observed in CZ during xylem differentiation with significant higher concentration in 6
Dvina, especially at maximum growth rate, when glucose and fructose concentration 7
was more than 1.5 times higher than in I-214 (figure 7). In CZ, sucrose showed a 8
different trend with highest amounts recorded at decreasing of xylem differentiation 9
(DOY 207). The glucose-fructose ratio changed during the season in both CZ and MX. 10
For both clones, this ratio in CZ was about 1.2 at the onset of xylem differentiation and 11
at maximum growth rate and decreased to 0.7-0.9 during the successive stage. During 12
cambium dormancy, the glucose-fructose ratio in MX reached ca. 2 in both clones but 13
drastically decreased during maximum growth rate, with values of 0.7 for I-214 and 1.1 14
for Dvina. This decrease was mainly due to a doubling of fructose concentration (from 15
16.5 to 35.1 µmol g-1DW in I-214 and from 24.3 to 49.2 µmol g-1DW in Dvina). 16
In comparison with the other major soluble sugars, no seasonal trend of raffinose, 17
galactose and mannitol was observed in MX, while in CZ, only a small quantity of 18
raffinose was detected (table 4). In MX, these sugars were detected mainly during 19
dormancy (DOY 33), with higher amounts of galactose and mannitol found in I-214. At 20
the onset of xylem differentiation (DOY 110), galactose, raffinose and mannitol 21
disappeared and only galactose was detected during maximum growth rate (ca. 1 µmol 22
g-1 DW). Traces of raffinose were recorded during both decreasing and ending of xylem 23
differentiation in MX. 24
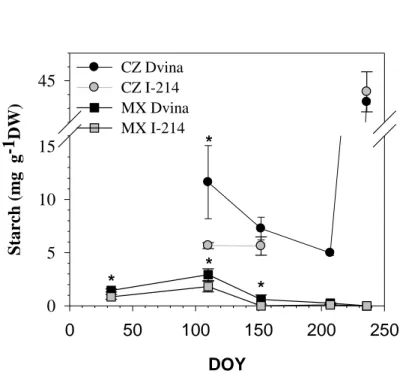
During dormancy, starch concentration ranged between 1 and 1.5 mg g-1 DW in MX, 1
with higher concentration found in DVINA (figure 8 and table 5). In both MX and CZ, 2
starch decreased after bud break (DOY 107-152) and in MX remained at low 3
concentrations for the rest of wood formation. In CZ, high concentrations of starch were 4
observed during the ending of xylem differentiation (DOY 236) (from 43 to 45 mg g-1 5
DW) with no significant difference between clones. 6
DISCUSSION 1
The clone with the greater radial growth and density showed the higher concentration of 2
non-structural soluble sugars in both cambial zone and xylem. Moreover, during the 3
growing season, the non-structural soluble sugars varied according to xylem growth 4
with much higher concentrations (5 to 10 times higher) found in the cambial zone than 5
in the wood. Sucrose transport from source leaves to sink organs is controlled by sink 6
strength, the ability of a sink to attract sucrose. The translocation and use of sugar is not 7
fixed in time and depends directly on the state of the meristem (Thaler and Pagès 1998), 8
represented in this work by cambial division and cell differentiation, which varied 9
greatly during the growing period. In this work, we demonstrated that the accumulations 10
of non structural soluble sugars at a certain time during growth corresponded with 11
higher carbon availability to an actively growing meristem. Moreover, as cell division 12
activity is crucial in attracting assimilate (Ho 1988) sugars followed more or less the 13
different stage of wood formation in stem. The observed vigorous xylogenesis, both 14
between clones and within the growing period showed a close link between the amount 15
of carbon and the activity of cambium. 16
Growth performance 17
According to our results, the higher productivity of Dvina could not be explained by the 18
different phenology of stem growth or cambial cell development. Cambium of both 19
clones was constituted of two-four cells during dormancy and increased to seven-eight 20
cells in both clones during exponential growth, which may show a similar division 21
potential if rate of division is not accounted for. Although duration of xylogenesis can 22
influence radial growth (Marion et al. 2007, Rossi et al. 2007, 2008a; Deslauriers et al. 1
2008), xylem differentiation at both tree heights lasted only a few days more in Dvina 2
than in I-214. At the observed rates of growth, ca. 50 days more would be required for 3
I-214 to produce the 2300 µm lacking to attain the ring-width of Dvina. The similar 4
width of the differentiating zones associated to different amount and density of xylem 5
produced imply that Dvina was faster in producing and maturating cells. Moreover, 6
similar trends of relative stem water content were observed in both clones, meaning that 7
the developing cells had a comparable water supply for their expansion and maturation. 8
The higher wood production in Dvina was therefore caused by a higher rate of xylem 9
production and differentiation and not by differences in phenology or cells constituting 10
the cambial zone. 11
The higher growth and density of Dvina was linked with higher contents of soluble 12
sugar measured in the outer wood, especially when growth rate was maximum. The 13
higher content of soluble sugars measured in Dvina demonstrated that this clone has a 14
superior flow and availability of carbohydrate to differentiate tissues despite its higher 15
utilisation. Even at the onset of wood formation, growth potential of Dvina was already 16
greater because of the higher soluble sugars content and starch concentration in the 17
cambium and xylem, as a high amount of available carbon influences how trees start 18
growth (Barbaroux and Bréda 2002, Skomarkova et al. 2006). The increased demand 19
for assimilates may also cause more assimilates to be directed to the metabolism 20
(Kuiper 1993), illustrating feedback relationships in the allocation to growth (Lacointe 21
2000). Therefore, the vigorous xylogenesis of Dvina could be linked with higher soluble 22
carbohydrates caused by its higher sink strength. 23
Stages of wood formation 1
Cambial dormancy 2
Dormancy was characterized by high levels of soluble sugars content and low 3
concentration of starch in mature xylem, confirming the results from other broadleaved 4
species (Yoshioka et al. 1988, Piispanen and Saranpää 2001) and was due to winter 5
starch-to-sugar conversion in woody tissues driven by low temperatures (Sauter 1988, 6
Schrader and Sauter 2002). This conversion increases the concentration of soluble 7
carbohydrates, which act as effective cryoprotectants (Magel et al. 1994, Sauter et al. 8
1996) and could be used as energy source at the onset of the growing period (Magel et 9
al. 2001). In this study, glucose, fructose and sucrose were major soluble sugars while 10
small amounts of galactose, raffinose and mannitol were detected. Mannitol, the only 11
soluble sugar that does not derive from the starch-to-sugar conversion, has never been 12
reported in poplar. It is a direct product of the photosynthetic carbon fixation and may 13
participate in a wide range of physiological processes (Noiraud et al. 2001) as a winter 14
cryoprotectant. 15
Onset of growth 16
Differences in the onset of vessel enlargement were found between clones and tree 17
heights. At the top, onset of cell differentiation occurred at the same time as, in I-214, or 18
a week earlier than, in Dvina, complete leaf opening. In both clones, wood formation 19
started about one week later at the base than at the top, indicating that the onset of 20
vessel enlargement proceeded down the stem at about 0.5 m day-1. In Fagus sylvatica, 21
leaf unfolding and cambium reactivation at the stem base occurred almost at the same 22
time (Čufar et al. 2008), corresponding with our results in Dvina but not in I-214. 1
Therefore, carbohydrate needs for wood formation could not be entirely supplied by 2
newly produced assimilates. This contrasts with the classical view that onset of stem 3
radial growth does not depend on carbon reserve in diffuse-porous species (Kozlowski 4
1992, Barbaroux and Bréda 2002, Barbaroux et al. 2003). 5
According to Hoch et al. (2003), newly formed leaves of deciduous trees become 6
autonomous from C-reserves at an early stage of their development. For stem radial 7
growth however, C-reserves were probably used for the beginning of wood formation as 8
the total soluble sugars in mature xylem halved in respect to dormancy. Very shortly 9
after bud break (less than two weeks), the differentiating zones of both clones had 10
already achieved about half of their maximum amplitude, rapidly becoming a 11
considerable sink and explaining the abrupt decrease in soluble sugars in xylem. In 12
Populus × canadensis, the amount of total soluble sugars in wood of 3-year-old 13
branches was at its minimum during bud break in late April-early May (Sauter and van 14
Cleve 1994), corresponding with our results. 15
Maximum growth rate 16
High rates of stem radial growth were observed between mid-May and mid-June, with a 17
maximum growth rate (tp) estimated for both clones on May 24 (DOY 144), about
10-18
15 days later than that of height growth. The major soluble sugars in the cambial zone 19
also peaked in correspondence to maximum growth rate except for sucrose that peaked 20
later, when cambial activity was decreasing. These high concentrations of sugars were 21
probably linked with sucrose metabolism in the actively growing tissues in order to 22
respond to the high demand of cell wall material. During growth, sucrose is the major 1
form of translocated carbon (cf. Krabel 2000), which is cleaved near sink tissues to form 2
fructose and glucose by either enzymes (such as sucrose synthase) or invertase 3
(Johansson 2003). Detailed studies in outer wood of Robinia pseudoacacia and Populus 4
× canadensis confirmed the increasing activities of sucrose synthase and invertase from 5
April to July, with a peak in May-June for sucrose synthase, in correspondence with cell 6
differentiation (Hauch and Magel 1998, Schrader and Sauter 2002). 7
Recent assessments in Acer platanoides (Marion et al. 2007) and Fagus sylvatica (Čufar 8
et al. 2008) growing in temperate regions positioned the maximum growth rate around 9
the end of May, in agreement with our results. Maximum growth rate in conifers of cold 10
climates occurs around the culmination of day length, in order to safely complete 11
secondary cell wall lignification before winter (Rossi et al. 2006c). However, conifers 12
have sapwood covering tens of tree rings, whereas xylem of broadleaves stops 13
conducting one (ring-porous) or a few years (diffuse-porous) after its production. Plants 14
therefore have to produce and activate the conducting elements rapidly in spring to 15
sustain the water transport and high transpiration of the developing leaves, which could 16
be a reason to anticipate maximum growth rate. Moreover, fibre completed 17
differentiation in less than two weeks (data not shown) ending cell differentiation faster 18
than that in conifers (Rossi et al. 2006b). 19
Decreasing of cambial activity and end of cell differentiation 20
Reduction in growth rate and total soluble sugars both occurred at the end of July. The 21
reduction in glucose and fructose could be linked to sucrose metabolism, as sucrose 22
synthase and invertase activity decline in August (Hauch and Magel 1998). At the 1
decreasing of xylem differentiation, the total non-structural soluble sugar was still 2
higher in the cambium of Dvina while similar contents were observed between clones 3
when xylogenesis was concluded. Cell differentiation was completed one month later, at 4
the end of August, indicating that soluble sugar concentration in xylem and cambium 5
decreases before the end of xylogenesis. In total, xylogenesis lasted about 160 days at 6
the top and between 133 and 141 days at the base, depending of the clone. As leafs were 7
present about 200 days until October 10 (DOY 283), cambium phenology in the stem 8
ended much before, about 40 days earlier than leaf phenology, despite a similar onset. 9
At the end of cell differentiation, a pronounced starch accumulation took place in the 10
differentiating xylem confirming previous results on Populus × canadensis Moench 11
‘robusta’ (Witt and Sauter 1994). In this specie, authors estimated the summer starch 12
deposition rate in poplar wood of 0.24 mg starch g-1 DW per day. Moreover, wood 13
density increased in the last 15% of the ring width during August, representing a carbon 14
demand at the end of the growing season, at a time when carbon availability in cambium 15
is decreasing. The asynchronous reduction of both xylem production and sugars leads to 16
the unresolved question of whether the conclusion of wood formation is cause or effect 17
of the reduction in sugar availability. 18
ACKNOWLEDGEMENTS 1
This work was funded by the projects Idrocambio of the Ministero delle Politiche 2
Agricole e Forestali, and MIUR-PRIN 2005072877. The authors wish to thank P. 3
Zambusi and P. Gelhaye for technical support and T. Anfodillo for his suggestions on 4
the manuscript. We thank the Laboratory of Forest and Wood Resource Studies 5
(LERFoB, INRA of Nancy, France) for microdensity analysis. 6
REFERENCES 1
Barbaroux, C. and N. Bréda 2002. Contrasting distribution and seasonal dynamics of 2
carbohydrate reserves in stem wood of adult ring-porous sessile oak and diffuse-3
porous beech trees. Tree Physiol. 22:1201-1210. 4
Barbaroux, C., N. Bréda and E. Dufrene 2003. Distribution of above-ground and below-5
ground carbohydrate reserves in adult trees of two contrasting broad-leaved species 6
(Quercus petraea and Fagus sylvatica). New Phytol. 157:605-615. 7
Borghetti, M., W.R.N. Edwards, J. Grace, P.J. Jarvis and A. Raschi 1991. The refilling 8
of embolised xylem in Pinus sylvestris L. Plant Cell Environ. 14:357-369. 9
Castellani, E., V. Freccero and G.F. Lapietra 1967. Proposta di una scala di 10
differenziazione delle gemme fogliari del pioppo utile per gli interventi 11
antiparassitari. Giornale Botanico Italiano. 101:355-360. 12
Ceulemans, R. and W. Deraedt 1999. Production physiology and growth potential of 13
poplars under short-rotation forestry culture. Forest Ecol. Manage. 121:9-23. 14
Čufar, K., P. Prislan, M. de Luis and J. Gričar 2008. Tree-ring variation, wood 15
formation and phenology of beech (Fagus sylvatica) from a representative site in 16
Slovenia, SE Central Europe. Trees:DOI 10.1007/s00468-008-0235-6. 17
Deslauriers, A., H. Morin and Y. Bégin 2003. Cellular phenology of annual ring 18
formation of Abies balsamea in the Québec boreal forest (Canada). Can. J. For. Res. 19
33:190-200. 20
Deslauriers, A., S. Rossi, T. Anfodillo and A. Saracino 2008. Cambial phenology, wood 21
formation and temperature thresholds in two contrasting years at high altitude in 22
southern Italy. Tree Physiol. 28:863-871. 1
Domec, J.-C. and B.L. Gartner 2001. Cavitation and water storage capacity in bole 2
xylem segments of mature and young Douglas-fir trees. Trees. 15:204-214. 3
Fonti, P. and I. García-González 2007. Earlywood vessels of Castanea sativa record 4
temperature before their formation. New Phytol. 173:562-570. 5
Giovannelli, A., A. Deslauriers, G. Fragnelli, L. Scaletti, G. Castro, S. Rossi and A. 6
Crivellaro 2007. Evaluation of drought response of two poplar clones (Populus x 7
canadensis Mönch 'I-214' and P. destoides Marsh. 'Dvina') through high resolution 8
analysis of stem growth. J. Exp. Bot. 58:2673-2683. 9
Gucci, R., C. Xiloyannis and J.A. Flore 1991. Gas exchange parameters, water relations 10
and carbohydrate partitioning in leaves of field-grown Prunus domestica following 11
fruit removal. Physiol. Plantarum. 83:497-505. 12
Hauch, S. and E. Magel 1998. Extractable activities and protein content of sucrose-13
phosphate synthase, sucrose synthase and neutrasl invertase in trunk tissues of 14
Robinia pseudoacacia L. are related to cambial wood production and heartwood 15
formation. Planta. 207:266-274. 16
Ho, L.C. 1988. Metabolism and compartmentation of imported sugars in sink organs in 17
relation to sink strengh. Annu. Rev. Plant Physiol. 39:355-378. 18
Hoch, G., A. Richter and C. Körner 2003. Non-structural carbon compounds in 19
temperate forest trees. Plant Cell Environ. 26:1067-1081. 20
Johansson, H. 2003. Gene regulation of UDP-glucose synthesis and metabolism in 21
plants. Department of Plant Physiology, Umea University, Umea, Sweden. 22
Kozlowski, T.T. 1992. Carbohydrate sources and sinks in woody plants. Bot. Rev. 1
58:109-222. 2
Krabel, D. 2000. Influence of sucrose on cambial activity. In Cell and molecular 3
biology of wood formation Eds. R.A. Savidge, J.R. Barnett and R. Napier. BIOS 4
Scientific Publishers Ltd, Oxford, pp. 113-125. 5
Kuiper, D. 1993. Sink strength: Established and regulated by plant growth regulators. 6
Plant Cell Environ. 16:1025-1026. 7
Lacointe, A. 2000. Carbon allocation among tree organs: A review of basic processes 8
and representation in functional-structural tree models. Ann. For. Sci. 57:521-533. 9
Magel, E., A. Abdel-Latif and R. Hampp 2001. Non-structural carbohydrates and 10
catalytic activities of sucrose metabolizing enzymes in trunks of two Juglans species 11
and their role in heartwood formation. Holzforschung. 55 12
Magel, E., C. Jay-Allemand and H. Ziegler 1994. Formation of heartwood substances in 13
the stemwood of Robinia pseudoacacia L. II. Distribution of nonstructural 14
carbohydrates and wood extractives across the trunk. Trees. 8:165-171. 15
Marion, L., J. Gricar and P. Oven 2007. Wood formation in urban Norway maple trees 16
studied by the micro-coring method. Dendrochronologia. 25:97-102. 17
Monclus, R., E. Dreyer, F.M. Delmotte, M. Villar, D. Delay, E. Boudouresque, J.M. 18
Petit, N. Marron, C. Bréchet and F. Brignolas 2005. Productivity, leaf traits and 19
carbon isotope discrimination in 29 Populus destoides × P. nigra clones. New 20
Phytol. 167:53-62. 21
Mothe, F., G. Duchanois, B. Zannier and J.M. Leban 1998. Microdensitometric analysis 22
Ann. For. Sci. 55:301-313. 1
Noiraud, N., L. Maurousset and R. Lemoine 2001. Transport of polyols in higher plants. 2
Plant Physiol. Bioch. 39:717-728. 3
Pellis, A., I. Laureysens and R. Ceulemans 2004. Genetic variation of the bud and leaf 4
phenology of seventeen poplar clones in a short rotation coppice culture. Plant Biol. 5
6:38-46. 6
Piispanen, R. and P. Saranpää 2001. Variation of non-structural carbohydrates in silver 7
birch (Betula pendula Roth) wood. Trees. 15:444-451. 8
Polge, H. 1978. Fifteen years of wood radiation densitometry. Wood Sci. Technol. 9
12:187-196. 10
Quinn, G.P. and M.J. Keough 2002. Experimental design and data analysis for 11
biologists. Cambridge University Press, Cambridge. 12
Romani, A., A. Baldi, M. Tattini and F.F. Vincieri 1994. Extraction, purification 13
procedures and HPLC-RI analysis of carbohydrates in olive (Olea europaea L.) 14
plants. Chromatographia. 2:35-39. 15
Rossi, S., T. Anfodillo and R. Menardi 2006a. Trephor: A new tool for sampling 16
microcores from tree stems. IAWA J. 27:89-97. 17
Rossi, S., A. Deslauriers and T. Anfodillo 2006b. Assessment of cambial activity and 18
xylogenesis by microsampling tree species: an example at the Alpine timberline. 19
IAWA J. 27:383-394. 20
Rossi, S., A. Deslauriers, T. Anfodillo and V. Carraro 2007. Evidence of threshold 21
temperatures for xylogenesis in conifers at high altitudes. Oecologia. 152:1-12. 22
Rossi, S., A. Deslauriers, T. Anfodillo and M. Carrer 2008a. Age-dependent 1
xylogenesis in timberline conifers. New Phytol. 177:199-208. 2
Rossi, S., A. Deslauriers, T. Anfodillo, H. Morin, A. Saracino, R. Motta and M. 3
Borghetti 2006c. Conifers in cold environments synchronize maximum growth rate 4
of tree-ring formation with day length. New Phytol. 170:301-310. 5
Rossi, S., A. Deslauriers, J. Gričar, J.-W. Seo, C.B.K. Rathgeber, T. Anfodillo, H. 6
Morin, T. Levanic, P. Oven and R. Jalkanen 2008b. Critical temperatures for 7
xylogenesis in conifers of cold climates. Global Ecol. Biogeogr. 17:696-707. 8
Rossi, S., A. Deslauriers and H. Morin 2003. Application of the Gompertz equation for 9
the study of xylem cell development. Dendrochronologia. 21:33-39. 10
Sauter, J.J. 1988. Temperature-induced changes in starch and sugars in the stem of 11
Populus × canadensis 'robusta'. J. Plant Physiol. 132:608-612. 12
Sauter, J.J. and B. van Cleve 1994. Storage, mobilization and interrelations of starch, 13
sugars, protein and fat in the ray storage tissue of poplar trees. Trees. 8:297-304. 14
Sauter, J.J., M. Wisniewski and W. Witt 1996. Interrelationships between ultrastructure, 15
sugar levels, and frost hardiness of ray parenchyma cells during frost acclimation 16
and deacclimation in poplar (Populus x canadensis Moench 'robusta') wood. J. Plant 17
Physiol. 149:451-461. 18
Schrader, S. and J.J. Sauter 2002. Seasonal changes of sucrose-phosphate synthase and 19
sucrose synthase acrivitise in poplar wood (Populus × canadensis Moench 'robusta') 20
and their possible role in carbohydrate metabolism. J. Plant Physiol. 159:833-843. 21
Skaar, C. 1988. Wood-water relations. Springer-Verlag, Berlin-Heidelberg-New York. 22
Skomarkova, M.V., E.A. Vaganov, M. Mund, A. Knohl, P. Linke, A. Boerner and E.-D. 1
Schulze 2006. Inter-annual and seasonal variability of radial growth, wood density 2
and carbon isotope ratios in tree rings of beech (Fagus sylvatica) growing in 3
Germany and Italy. Trees. 20:571-586. 4
Thaler, P. and L. Pagès 1998. Modelling the influence of assimilate availability on root 5
growth and architecture. Plant Soil. 201:307-320. 6
van der Werf, G.W., U.G.W. Sass-Klaassen and G.M.J. Mohren 2007. The impact of 7
the 2003 summer drougth on the intra-annual growth pattern of beech (Fagus 8
sylvatica L.) and oak (Quercus robur L.) on a dry site in the Netherlands. 9
Dendrochronologia. 25:103-112. 10
Witt, W. and J.J. Sauter 1994. Starch metabolism in polar wood ray cells during spring 11
mobilization and summer deposition. Physiol. Plantarum. 92:9-16. 12
Yoshioka, H., K. Nagai, K. Aoba and M. Fukumoto 1988. Seasonal changes of 13
carbohydrates metabolism in apple trees. Sci. Hortic-Amsterdam. 36:219-227. 14
TABLE 1 1
Stage I-214 Dvina
1 22 March (81) 22 March (81) 2 28 March (87) 31 March (90) 3 30 March (89) 4 April (94) 4 3 April (93) 7 April (97) 5 5 April (95) 11 April (101)
Table 1. Bud phenology of Dvina and I-214 in 2006 reported as date and DOY in 2
parentheses. Stage 1, buds swelling with slight separation of the scales; stage 2; bud 3
break initiated at the apical part of the bud with leaves visible; stage 3, bud break with 4
leaves open but still joined together and scales still present; stage 4, leaves slightly open 5
with or without scales; stage 5, small leaves completely open but of smaller sizes than 6
mature leaves and shoots elongating. 7
TABLE 2 1
Growth Clone I A (10-2) r tp (DOY) R2
Height Dvina 4.33(0.07) 2.12(0.10) 4.41(0.6) 2.85(0.4) 0.031 154 0.81 I-214 3.52(0.07) 2.25(0.11) 6.68(1.1) 4.18(0.7) 0.036 159 0.78 Radial Dvina 0 8030.8(95.9) 6.33(0.4) 4.39(0.3) 88 144 0.95 I-214 0 5656.3(76.0) 7.34(0.5) 5.09(0.3) 83 144 0.94
Table 2. Growth response curves for Dvina and I-214, fitted to the cumulative height 2
growth (m) and stem radial growth (µm) at 0.3 m. Parameter I represents the initial 3
estimated tree height and A, and κ are the parameters of the Gompertz function. 4
Numbers in parenthesis are the standard deviations of the estimated parameters. Rates 5
(r) are expressed in m.day-1 for height growth and in μm.day-1 for radial growth and tp
6
values correspond to the times of the inflection point of the Gompertz function. 7
TABLE 3 1 Stem height Clone Onset of xylem differentiation (DOY) First mature vessel (DOY) End of xylem differentiation (DOY) Duration of differentiation (days) Top Dvina 94.5 (3.7) 109.0 (2.5) 256.0 (14.5) 161.5 I-214 98.6 (4.7) 108.6 (2.8) 256.2 (13.8) 157.6 Base Dvina 101.8 (2.4) 113.9 (3.5) 242.6 (13.5) 140.8 I-214 105.7 (4.8) 115.1 (3.1) 238.5 (10.4) 132.8
Table 3. Timing of xylem formation in Dvina and I-214 expressed at 0.3 m from the 2
collar (base) and 1 m from the top of the stem (top). Numbers in parentheses represent 3
the standard deviations of the mean. 4
TABLE 4 1
Zone DOY
Raffinose (µmol g-1 DW) Galactose (µmol g-1 DW) Mannitol (µmol g-1 DW)
Dvina I-214 Dvina I-214 Dvina I-214
CZ 110 nd 0.77±0.89 nd nd nd nd 152 0.14±0.28 nd nd nd nd nd 207 nd nd nd nd nd nd 236 1.05±0.99 2.06±1.17 nd nd nd nd MX 33 3.44±0.76 2.55±0.60 4.02±1.50 6.52±1.29 0.79±1.59 4.88±1.89 110 nd nd nd nd nd nd 152 nd nd 1.20±0.23 1.03±0.18 nd nd 207 0.22±0.21 0.28±0.05 nd nd nd nd 236 0.18±0.16 0.25±0.11 nd nd nd nd
Table 4. Seasonal changes in raffinose, galactose and mannitol (µmol g-1 DW) reported 2
as average ± standard deviation detected in the cambial zone (CZ) and in mature xylem 3
(MX) of Populus × canadensis ‘I-214’ and P. deltoides ‘Dvina’. The sampling days 4
correspond to the main stages of cambial activity: (i) dormancy, (ii) onset of xylem 5
differentiation, (iii) maximum growth rate, (iv) decreasing and (v) ending of xylem 6
differentiation. Amounts of soluble sugar equal to zero are expressed as not detected 7
(nd). 8
TABLE 5 1
CZ MX
Sugars Source F p-value F p-value
Total Clone 50.6 <0.0001 25.4 <0.0001 DOY 36.9 <0.001 33.5 <0.0001 Clone×DOY 8.93 <0.001 2.3 ns Glucose Clone 30.4 <0.0001 40.4 <0.0001 DOY 41.1 <0.0001 29.6 <0.0001 Clone×DOY 9.1 <0.001 3.9 <0.05 Fructose Clone 25.2 <0.0001 18.1 <0.001 DOY 16.1 <0.0001 29.0 <0.0001 Clone×DOY 4.5 <0.05 0.8 ns Sucrose Clone 20.2 <0.001 1.6 ns DOY 31.6 <0.0001 34.5 <0.0001 Clone×DOY 0.2 ns 0.4 ns Starch Clone 13.2 0.0017 27.2 <0.0001 DOY 9.65 <0.0001 81.4 <0.0001 Clone×DOY 1066 0.0012 3.82 0.0130
Table 5. ANOVA comparisons of contents in soluble sugars and starch detected in the 2
cambial zone (CZ) and in mature xylem (MX) among clones, sampling dates (DOY) 3
and their interaction (clone×DOY). ns, not significant (p>0.05). 4
FIGURE LEGENDS 1
Figure 1. Sampling timetable of Dvina and I-214 during 2006. 2
Figure 2. Sampling design from stems of Dvina and I-214. On all sampling days (see 3
figure 1 for dates), discs of 1 or 2 cm were cut at 0.3 m above the collar and at 1 m from 4
the top for xylem formation analysis (XF). These discs contained primary and mature 5
xylem of the 1st (2005) and current year of study (2006). Additional discs 5 and 20 cm 6
were cut above those of xylem formation on fewer sampling days (figure 1) for the 7
determination of stem water content (WC) and soluble sugars analysis (SS). After the 8
end of the growing period (figure 1), other discs were taken for density measurement (1 9
cm discs). 10
Figure 3. Sections of developing stem tissues collected on DOY 200 (a-c) and 103 (d) 11
from hybrid poplars. a-b: developing xylem under visible (a) and polarized light (b) 12
showing cambial zone (cz), enlarging xylem cells (enl), cell wall thickening (wt) and 13
mature xylem (mx) of I-214 (20×). c: developing xylem of Dvina under phase contrast 14
showing the width of developing xylem (enl and wt) compared with mature xylem (mx) 15
(4×). d: first enlarging vessel at the beginning of xylem formation under visible light 16
(100×). 17
Figure 4. Intra-annual tree growth in Dvina (left) and I-214 (right) in 2006: a, tree 18
height growth (m) and its intra-annual trend (black line); b, stem growth (m) at 1 m 19
from the top of the tree (grey dots) and at 0.3 m from the base (black dots) and its intra-20
annual trend (black lines); c, width of the developing cell zones (µm) at 1 m from the 21
top of the tree (grey dots) and at 0.3 m from the base (black dots). Dots represent 22
average growth and bars standard deviation among 6 individual plants. The intra-annual 1
trends were calculated by the Gompertz function (see table 2). 2
Figure 5. A: Variation in wood density (Kg m-3) along the growth ring for Dvina (black 3
dots) and I-214 (grey dots). Vertical bars show standard deviation. B: Distribution 4
frequency of the density measurements (kg m-3) for Dvina (black bars) and I-214 (grey 5
bars). 6
Figure 6. A: Microclimatic conditions expressed as daily precipitation (mm) and mean 7
temperature (°C). B: Variation of the relative stem water content (%), measured on stem 8
section at 0.3 m from the base, in Dvina (black dots) and I-214 (grey dots). 9
Figure 7. Seasonal changes in total soluble sugars, glucose, fructose and sucrose (µmol 10
g-1 DW) detected in the cambial zone (CZ, dots) and mature xylem (MX, squares) of 11
Populus × canadensis ‘I-214’ (gray) and Populus deltoides ‘Dvina’ (black). Total 12
soluble sugars content was obtained as the sum of the amount of glucose, fructose, 13
sucrose, raffinose, galactose and mannitol. The sampling days corresponded to the main 14
stages of cambial activity: (i) dormancy, (ii) onset of xylem differentiation, (iii) 15
maximum growth rate, (iv) decreasing and (v) ending of xylem differentiation. Vertical 16
bars and asterisks indicate standard deviations among trees and significant differences 17
between clones, respectively. 18
Figure 8. Seasonal changes in starch (mg g-1 DW) detected in the cambial zone (CZ, 19
dots) and mature xylem (MX, squares) of Populus × canadensis ‘I-214’ (gray) and 20
Populus deltoides ‘Dvina’ (black). The sampling days corresponded to the main stages 21
of cambial activity: (i) dormancy, (ii) onset of xylem differentiation, (iii) maximum 22
growth rate, (iv) decreasing and (v) ending of xylem differentiation. Vertical bars and 1
asterisks indicate standard deviations among trees and significant differences between 2
clones, respectively. 3
FIGURE 1 1 DOY 50 100 150 200 250 300 Density Sugars in xylem Sugars in cambial zone Stem water content Xylem formation Bud phenology
FIGURE 2 1 1 m 0 .3 m Cambial zone
Mature xylem, current year Mature xylem, previous year
Primary xylem XF XF WC SS WD 2
FIGURE 3 1
FIGURE 4 1 0 50 100 150 200 250 300 350 D ev el o pi ng z o ne ( m) 0 50 100 150 200 250 300 350 400 Top Base Dvina DOY 0 50 100 150 200 250 300 350 I-214 T re e he ig ht ( m ) 3 4 5 6 7 8 Ste m di a m et er gr o w th ( m) 0 2000 4000 6000 8000 10000 2
FIGURE 5 1 Ring width (%) 0 10 20 30 40 50 60 70 80 90 100 Wo o d d en si ty (kg m -3 ) 250 300 350 400 450 Dvina I-214 Frequency (%) 0 10 20 30 2
FIGURE 6 1 DOY 0 50 100 150 200 250 300 350 R el at ive ste m w at er c on te n t ( % ) 30 40 50 60 70 80 90 100 Dvina I-214 D ai ly te m p er at u re (° C ) 0 10 20 30 P re ci p it at ion ( m m ) 0 10 20 30 40 50 60 70 2
FIGURE 7 1 To ta l s o lub e s ug a rs ( m o l g -1DW ) 0 40 80 120 400 800 1200 G luc o se ( m o l g -1DW ) 0 20 40 60 200 400 600 F ru ct o se ( m o l g -1DW ) 0 20 40 60 200 400 600 DOY 0 50 100 150 200 250 Su cr o se ( m o l g -1DW ) 0 4 8 12 20 40 60 80 100 CZ Dvina CZ I-214 MX Dvina MX I-214 * * * * * * * * * * * * * * * * * * 2
FIGURE 8 1 DOY 0 50 100 150 200 250 St a rch ( m g g -1 DW) 0 5 10 15 45 CZ DvinaCZ I-214 MX Dvina MX I-214 * * * * 2