HAL Id: hal-03245906
https://hal.archives-ouvertes.fr/hal-03245906
Submitted on 2 Jun 2021
HAL is a multi-disciplinary open access
archive for the deposit and dissemination of
sci-entific research documents, whether they are
pub-lished or not. The documents may come from
teaching and research institutions in France or
abroad, or from public or private research centers.
L’archive ouverte pluridisciplinaire HAL, est
destinée au dépôt et à la diffusion de documents
scientifiques de niveau recherche, publiés ou non,
émanant des établissements d’enseignement et de
recherche français ou étrangers, des laboratoires
publics ou privés.
Distributed under a Creative Commons Attribution| 4.0 International License
The noncoding MIR100HG RNA enhances the autocrine
function of transforming growth factor beta signaling
Panagiotis Papoutsoglou, Dorival Mendes Rodrigues-Junior, Anita Moren,
Andrew Bergman, Fredrik Ponten, Cédric Coulouarn, Laia Caja, Carl-Henrik
Heldin, Aristidis Moustakas
To cite this version:
Panagiotis Papoutsoglou, Dorival Mendes Rodrigues-Junior, Anita Moren, Andrew Bergman, Fredrik
Ponten, et al.. The noncoding MIR100HG RNA enhances the autocrine function of transforming
growth factor beta signaling. Oncogene, Nature Publishing Group, 2021, 40 (21), pp.3748-3765.
�10.1038/s41388-021-01803-8�. �hal-03245906�
https://doi.org/10.1038/s41388-021-01803-8 A R T I C L E
The noncoding
MIR100HG RNA enhances the autocrine function of
transforming growth factor
β signaling
Panagiotis Papoutsoglou 1,2●Dorival Mendes Rodrigues-Junior1●Anita Morén1●Andrew Bergman1●
Fredrik Pontén 3●Cédric Coulouarn 2●Laia Caja 1●Carl-Henrik Heldin 1●Aristidis Moustakas 1
Received: 8 July 2019 / Revised: 31 March 2021 / Accepted: 15 April 2021 / Published online: 4 May 2021 © The Author(s) 2021. This article is published with open access
Abstract
Activation of the transforming growth factorβ (TGFβ) pathway modulates the expression of genes involved in cell growth arrest, motility, and embryogenesis. An expression screen for long noncoding RNAs indicated that TGFβ induced mir-100-let-7a-2-mir-125b-1 cluster host gene (MIR100HG) expression in diverse cancer types, thus confirming an earlier demonstration of TGFβ-mediated transcriptional induction of MIR100HG in pancreatic adenocarcinoma. MIR100HG depletion attenuated TGFβ signaling, expression of TGFβ-target genes, and TGFβ-mediated cell cycle arrest. Moreover, MIR100HG silencing inhibited both normal and cancer cell motility and enhanced the cytotoxicity of cytostatic drugs. MIR100HG overexpression had an inverse impact on TGFβ signaling responses. Screening for downstream effectors of MIR100HG identified the ligand TGFβ1. MIR100HG and TGFB1 mRNA formed ribonucleoprotein complexes with the RNA-binding protein HuR, promoting TGFβ1 cytokine secretion. In addition, TGFβ regulated let-7a-2–3p, miR-125b-5p, and miR-125b-1–3p expression, all encoded by MIR100HG intron-3. Certain intron-3 miRNAs may be involved in TGFβ/ SMAD-mediated responses (let-7a-2–3p) and others (miR-100, miR-125b) in resistance to cytotoxic drugs mediated by MIR100HG. In support of a model whereby TGFβ induces MIR100HG, which then enhances TGFβ1 secretion, analysis of human carcinomas showed that MIR100HG expression correlated with expression of TGFB1 and its downstream extracellular target TGFBI. Thus, MIR100HG controls the magnitude of TGFβ signaling via TGFβ1 autoinduction and secretion in carcinomas.
Introduction
Parts of the human genome are transcribed into noncoding RNAs (ncRNAs) that regulate gene expression, and have little or no protein-coding potential, such as microRNAs
(miRNAs) [1] and long ncRNAs (lncRNAs) [2, 3]. Upon cleavage during splicing, either intronic or exonic regions of lncRNAs, called miRNA host genes, can give rise to miR-NAs [2, 3], such as miR-17–92a-1 cluster host gene (MIR17HG) [4], miR-31 host gene (MIR31HG) [5], and miR-100-let-7a-2-miR-125b-1 cluster host gene (MIR100HG) [6]. MiRNAs inhibit translation or induce degradation of mRNAs during development [7], and control proliferation and migration, which explains their deregulated expression in cancer [8]. MiR17–92 favors cell cycle entry by targeting the cell cycle inhibitor p21Cip1 and retinoblastoma family proteins [8]. The let-7 family targets cyclins and cyclin-dependent kinases (CDKs), while diverse cancers down-regulate let-7 expression [8]. MiR-125b targets CDK6 and other cell cycle regulators, acting as an antiproliferative miRNA [8]. MiRNAs may exert context-dependent actions in cancer, when viewed as units of signaling pathways.
One such pathway is transforming growth factor β (TGFβ) that signals via membrane receptors, which acti-vate effector transcription factors (SMADs) and mitogen-* Aristidis Moustakas
1 Department of Medical Biochemistry and Microbiology, Science
for Life Laboratory, Box 582, Biomedical Center, Uppsala University, Uppsala, Sweden
2 InInserm, Univ Rennes, UMR_S 1242, COSS (Chemistry,
Oncogenesis Stress Signaling), Centre de Lutte contre le Cancer Eugène Marquis, Rennes, France
3 Department of Immunology, Genetics and Pathology, Box 256,
Rudbeck Laboratory, Uppsala University, Uppsala, Sweden Supplementary informationThe online version contains supplementary material available at
https://doi.org/10.1038/s41388-021-01803-8.
123456789
0();,:
123456789
activated protein kinases (MAPKs), to regulate target genes that control the cell cycle, migration, extracellular matrix remodeling, and epithelial–mesenchymal transition (EMT) [9]. Such target genes of TGFβ can be protein-coding or nonprotein-coding [10]. In normal or benign hyper-plastic epithelial cells, TGFβ arrests the cell cycle and suppresses tumorigenesis by transcriptionally inducing the CDK inhibitors p15Ink4b, p21Cip1, and p27Kip1, and repressing the proto-oncogene c-MYC [11]. In advanced tumors, TGFβ promotes stemness, invasiveness, and metastasis [9]. For example, TGFβ induces MIR100HG expression in pancreatic tumors, generating miR-100 and miR-125b-1, which act in a protumorigenic manner, and let-7a-2, which acts oppositely [6].
We screened for TGFβ-regulated lncRNAs in human keratinocytes and observed upregulation of MIR100HG [12], which was validated in diverse cell types. We then established a role of MIR100HG in TGFβ autoinduction, a central feature in TGFβ biology, especially in the context of cancer.
Results
TGF
β receptor-SMAD signaling induces MIR100HG
expression in diverse normal and cancer cells
We searched for lncRNAs whose expression is regulated by the TGFβ pathway [12]. Microarray analysis in human HaCaT keratinocytes stimulated with TGFβ1 for early, intermediate, or long time periods, detected several up- or downregulated lncRNA genes (Fig.1a, b). The screen was completed by selecting 23 TGFβ-regulated lncRNAs, silencing their expression by short-interfering (si) RNAs, and by monitoring CAGA12-luciferase activity, thus testing whether these lncRNAs affected TGFβ signaling [12]. The CAGA12-luciferase reporter monitors TGFβ signaling quantitatively by recruiting to its multimeric promoter the SMAD2/SMAD3/SMAD4 complex inducing the synthesis of luciferase transcripts.
MIR100HG lncRNA expression was upregulated by TGFβ stimulation with a peak of induction at 24 h (Fig.1c), whereas its downregulation decreased CAGA12-luciferase reporter responsiveness (see“Results”) [12]. In addition to normal immortalized cells (Fig. 1c), TGFβ induced MIR100HG expression with cell-type-specific kinetics in A549 lung adenocarcinoma, PC3U prostate carcinoma, and HuCCT1 cholangiocarcinoma cells (Fig. 1d–f), and in pancreatic and lung adenocarcinoma cell line cohorts of the transcriptomic datasets GSE23952 [13] and GSE114761 [14] (Supplementary Fig. S1). These data agree with the first report of MIR100HG regulation by TGFβ in pancreatic tumors [6].
MIR100HG spans 4 exons and 3 introns (NR_024430.2 transcript) on chromosome 11q24.1 and generates a 3129-nt-long spliced RNA (Fig.2a). Intron-3 gives rise to MIR-100, a precursor to mature miR-100-5p/-3p, MIRLET7A2, gen-erating let-7a-5p/let-7a-2-3p, MIR125B1, a precursor to mature miR-125b-5p/miR-125b-1-3p, and the BLID (BH3-like motif-containing cell death inducer) protein (Fig. 2a). Chemical inhibition of TGFβ receptor I (TGFβRI) kinase activity (TβRi: GW6604) in HaCaT cells, normalized TGFβ-induced MIR100HG expression to basal levels (Fig. 2b), as well as the established TGFβ-induced protein PAI-1 (plasminogen activator inhibitor-1, Fig.2c). Silencing SMAD2, SMAD3, or SMAD4 alone or in combinations decreased TGFβ-induced MIR100HG expression in HaCaT, PC3U, A549, and HuCCT1 cells (Fig. 2d–g and Supple-mentary Fig. S2a–c). In the HuCCT1 model, an independent TβRi (LY2157299) blocked the induction of MIR100HG by TGFβ (Supplementary Fig. S2d). Chromatin immunopreci-pitation (ChIP) revealed the association of SMAD2/3 to the MIR100HG promoter in HaCaT, PC3U, and A549 cells after stimulation with TGFβ (Supplementary Fig. S2e, f).
HaCaT and PC3U cell fractionation analysis confirmed that >90% of MIR100HG was cytoplasmic and <10% was nuclear (Fig. 2h–k). HPRT1 mRNA was essentially cytoplasmic, as expected, and lncRNA TGFB2-AS1 [12] was exclusively nuclear. Fraction purity was determined by analyzing the nuclear envelope protein lamin-B1 and the cytosolic proteins GAPDH and α-tubulin (Fig. 2i, k). Thus, several TGFβ-responsive cell models exhibit TGFβRI- and SMAD2/ 3/4-dependent transcriptional induction of MIR100HG, whose spliced product accumulates in the cytoplasm. In the following experiments, we studied MIR100HG expression and func-tional roles in PC3U, A549, and in nontumorigenic HaCaT cells, as these cell models showed robust responses of MIR100HG to TGFβ (Fig. 1), and represent cells of inde-pendent tissue origin.
MIR100HG regulates diverse cell responses to TGFβ
We investigated whether MIR100HG could affect expression of TGFβ target genes. Using a pool-of-4 siRNAs, two indi-vidual siRNAs targeting exons 1 and 4, and an independent antisense oligonucleotide (ASO) specific for exon 4 of MIR100HG (Fig. 2a), we identified those that silenced MIR100HG in HaCaT cells (Supplementary Fig. S3a), and chose siRNA#9 (exon 1) and ASO (exon 4) for the majority of subsequent experiments. Upon MIR100HG knockdown with siRNA#9 (Fig.3a), inducibility of SERPINE1 (encoding PAI-1), FIBRONECTIN 1 (FN1), and SNAI1/SNAIL expres-sion by TGFβ in PC3U cells was almost completely lost (Fig.3b–d) (note retained weak inducibility of FN1, Fig.3c), and basal SNAI1 expression was suppressed (Fig. 3d), con-sistent with a role for MIR100HG to promote autocrine TGFβ The noncodingMIR100HG RNA enhances the autocrine function of transforming growth factor β. . . 3749
signaling. MIR100HG silencing by siRNA#9 (Fig. 3a) reduced FN1 and PAI-1 protein levels (Fig. 3e). Although PC3U carcinoma cells do not exhibit physiological cell cycle arrest in response to TGFβ, upon MIR100HG silencing with ASO (Fig.3f), their viability was reduced (Fig.3g). Motility was strongly reduced in PC3U cells (Fig. 3h) upon MIR100HG silencing via ASO (Fig.3f).
In nontumorigenic keratinocytes, MIR100HG silencing with siRNAPool-of-4 (Supplementary Fig. S3b) reduced induction of SERPINE1 and FN1 mRNAs (Supplementary Fig. S3c, d), and reduced FN1 and N-CAD protein levels, as well as phosphorylation of SMAD2 (Supplementary Fig. S3e), in response to TGFβ stimulation. In these experi-ments, silencing of SMAD3, SMAD4 (Fig.2e), or TGFBR2 Fig. 1 MIR100HG is induced
by TGFβ. a Schematic outline of the experimental design to identify TGFβ-regulated lncRNAs. b Total numbers of lncRNA genes regulated by TGFβ1 in a time-course experiment, identified by microarray analysis. c–f Real-time RT-qPCR for determination of MIR100HG expression in HaCaT (c), A549 (d), PC3U (e), and HuCCT1 (f) cells in response to TGFβ1 treatment for the indicated time periods. Gene expression is normalized relative to the housekeeping genes HPRT1 (c–e) or TBP (f). Error bars represent standard deviation from three different experiments (*P < 0.05, **P < 0.01, ***P < 0.001).
(not shown) dramatically blocked TGFβ-inducible SER-PINE1 and FN1 expression (Supplementary Fig. S3c, d), indicating that the impact of MIR100HG silencing is in the same direction but not as robust as the impact of silencing central TGFβ signaling components (TGFBR2, SMAD3, and SMAD4). TGFβ-induced cell cycle arrest and cell
number decrease were partially blocked (Supplementary Fig. S3e, f) after silencing MIR100HG with siRNA#9 or ASO (Supplementary Fig. S3a, d). Both assays also revealed a small but reproducible increase in HaCaT S-phase entry and viability upon MIR100HG silencing under basal conditions (Supplementary Fig. S3f, g). The noncodingMIR100HG RNA enhances the autocrine function of transforming growth factor β. . . 3751
Motility was induced in HaCaT cells (Supplementary Fig. S3h) upon MIR100HG silencing via ASO (Supple-mentary Fig. S3a).
We cloned the human MIR100HG cDNA from immortalized mammary epithelial MCF10A cells (Sup-plementary Fig. S4a), and verified overexpression of MIR100HG in HaCaT (Supplementary Fig. S4b) and PC3U cells (Fig. 3i), which further enhanced basal and TGFβ-induced SERPINE1, FN1, and SNAI1 mRNA levels and FN1 and PAI-1 protein levels in the PC3U cells (Fig.3j–m), and the same proteins in HaCaT cells (Sup-plementary Fig. S4c). MIR100HG gain-of-function reduced viability of keratinocytes and cooperated with TGFβ by inducing a more robust growth inhibition (Supplementary Fig. S4d), whereas in PC3U cells, MIR100HG enhanced viability (Fig.3n). Motility assays did not reveal significant differences upon MIR100HG overexpression in either cell model (Fig.3o and Supple-mentary Fig. S4e). We conclude that MIR100HG silen-cing diminished, whereas MIR100HG overexpression strengthened TGFβ-mediated cell responses.
Impact of
MIR100HG on SMAD signaling and
cytotoxicity
We investigated whether MIR100HG regulates basal TGFβ signaling. Similar to HaCaT cells (Supplementary Fig. S3e), silencing MIR100HG with siRNA#9 in PC3U cells (Fig.3a) decreased the well-established early phosphorylation of SMAD2, SMAD3, and p38 MAPK after 30 min of TGFβ stimulation (Supplementary Fig. S5a). Relative to the con-trol, nonspecific ASO, which allowed proper time-dependent TGFβ signaling, anti-MIR100HG ASO (silen-cing efficiency shown in Fig. 3f), decreased the phos-phorylated levels of SMAD2, SMAD3, and p38 after 30 and 60 min of TGFβ stimulation (Supplementary Fig. S5b). Conversely, MIR100HG overexpression (Fig.3i) enhanced phosphorylation of SMAD2 and SMAD3 (Fig. 4a). SMAD2/SMAD3 signaling directly translates to target gene promoter/enhancer binding and regulation. Accord-ingly, MIR100HG overexpression approximately doubled SMAD2/3 recruitment to the SERPINE1 promoter after TGFβ stimulation, determined by ChIP-qPCR in PC3U cells (Fig. 4b), and mirroring the impact MIR100HG over-expression has on CAGA12-luciferase activity (Fig.4c). In a similar fashion, TGFβ-induced CAGA12-luciferase activity in keratinocytes was reduced upon MIR100HG silencing with the siRNApool to an extent comparable to TGFBR2 silencing (Supplementary Fig. S5c), and was further enhanced upon MIR100HG overexpression (Sup-plementary Fig. S5d). To explore deeper effects of MIR100HG on cell viability, we used the cytotoxic drugs doxorubicin, taxol, and 5-fluorouracil in combination with TGFβ stimulation and/or MIR100HG silencing (Fig. 4d). Drug cotreatment with TGFβ enhanced cytotoxicity only in the case of 5-fluorouracil; MIR100HG silencing repro-ducibly enhanced cytotoxicity by all drugs, as revealed by viability, cleaved PARP-1, and caspase-3 analysis (Fig.4d). Thus, MIR100HG possibly acts at the level of TGFβ ligand and/or TGFβ receptors.
MIR100HG regulates TGFβ1 expression via the
RNA-binding protein HuR
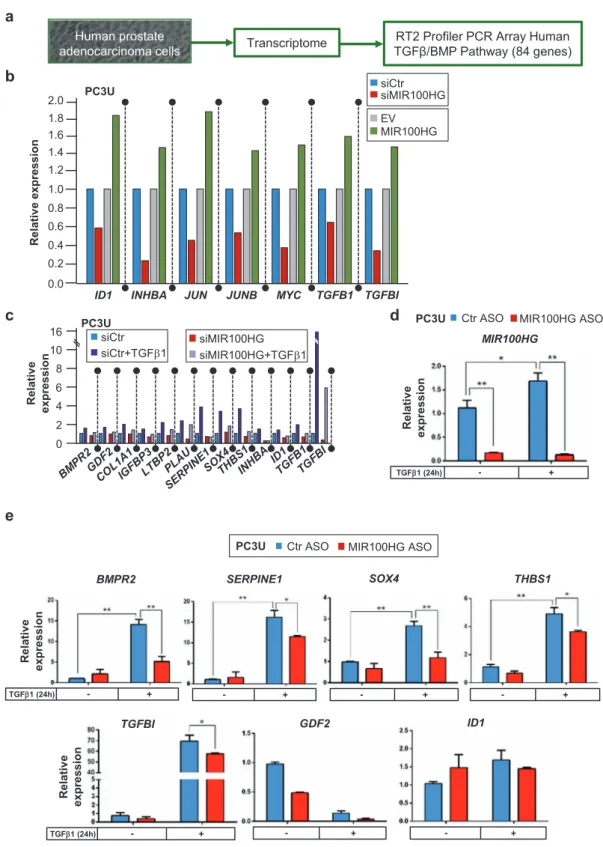
We examined the impact of MIR100HG on expression of TGFβ family signaling genes using a microarray platform that provided strong indications but did not allow repro-ducibility assays for technical reasons (Fig. 5a). Many of the 84 investigated transcripts were readily expressed in PC3U cells (Supplementary Fig. S6). The ligands TGFB1 and INHBA, their downstream effector of cell adhesion and secreted glycoprotein TGFBI, and downstream transcription factors ID1, MYC, JUN, and JUNB, were downregulated upon MIR100HG silencing (siRNA#9, Fig. 3a) and upre-gulated upon MIR100HG overexpression (Fig. 5b, single Fig. 2 MIR100HG is induced by TGFβRI-SMAD signaling. a
Schematic representation of the organization of the MIR100HG gene. Exons are shown as boxes and introns as lines. Arrows indicate the direction of transcription and the corresponding RNA (black) or protein-coding (blue) transcripts. The MIR100HG transcriptional unit coordinates on the H19 genome sequence (chromosome 11) are shown along with nucleotide (nt) numbering and coordinates of the four siRNAs and one ASO used in the study, marked by colored and numbered arrowheads, with underlines indicating those used in most experiments. b Real-time RT-qPCR for MIR100HG in HaCaT cells treated with TβRi (GW6604) in combination with TGFβ1 stimulation. Gene expression is normalized relative to the housekeeping gene HPRT1. Error bars represent standard deviation from three different experiments (*P < 0.05). c Immunoblotting for PAI-1 in HaCaT cells treated with TβRi (GW6604) in combination with TGFβ1 stimulation for 24 h.β-ACTIN was used as a loading control. Molecular mass (kDa) markers are indicated along with densitometric values of nor-malized band intensity. d, f Real-time RT-qPCR for determination of MIR100HG in HaCaT (d) or PC3U (f) cells transiently transfected with siRNAs targeting SMAD2, SMAD3, SMAD4, or combinations and treated or not with TGFβ1 for 24 h. Gene expression is normalized relative to the housekeeping gene HPRT1. Error bars represent stan-dard deviation from three different experiments (*P < 0.05, **P < 0.01, ***P < 0.001). e, g Immunoblots corresponding to the experi-ment of panels (d, f) indicating the efficiency of SMAD protein silencing in specific combinations that cover all three SMADs exam-ined. GAPDH was used as a loading control and molecular mass (kDa) markers are indicated. h–k Expression levels of MIR100HG lncRNA, HPRT1 mRNA, and TGFB2-AS1 lncRNA (which is known to be primarily nuclear) in nuclear and cytoplasmic fractions of HaCaT (h) or PC3U (j) lysates. Gene expression is normalized relative to the housekeeping gene HPRT1. These data show a representative experiment out of two. Corresponding immunoblot controls (i, k) verify the relative purity of cell fractions based on the nuclear (LAMIN-B1) and two cytoplasmic (GAPDH,α-TUBULIN) protein markers. Molecular mass (kDa) markers are indicated. A star indicates a nonspecific protein band recognized by the antibody.
biological repeat). After TGFβ stimulation, TGFB1, INHBA, and its downstream target genes IGFBP3, SER-PINE1, SOX4, THBS1, ID1, and TGFBI were most robustly inhibited after silencing MIR100HG (Fig.5c, single biolo-gical repeat, siRNA#9). Independent RT-qPCR assays confirmed in multiple repeats that MIR100HG silencing (Fig.5d, via ASO) resulted in a relative decrease of TGFB1
(see next section), BMPR2, SERPINE1, SOX4, THBS1, and TGFBI; expression of GDF2 or ID1 also decreased, but not significantly (Fig.5e), in agreement with lack of significant regulation by MIR100HG in the single-microarray assay (Fig.5c). Many of the analyzed genes mediate a conserved TGFB1 autoinduction mechanism that responds to TGFβ signaling.
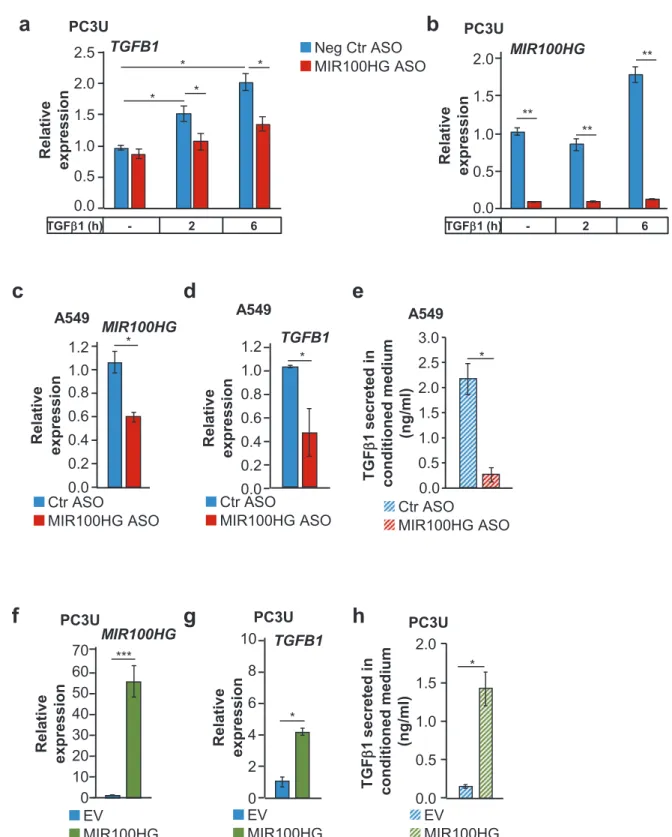
We corroborated the impact of MIR100HG on TGFβ1 expression (Fig. 6). The anti-MIR100HG ASO suppressed TGFB1 mRNA expression in PC3U and A549 cells (Fig.6a–d) and suppressed secreted TGFβ1 protein in A549-conditioned medium (Fig. 6e). MIR100HG overexpression enhanced both TGFB1 mRNA and protein secretion in PC3U cells (Fig. 6f–h). The impact MIR100HG had on secreted TGFβ1 suggested post-transcriptional action.
To investigate post-transcriptional mechanisms, we focused on the RNA-binding protein human antigen R (HuR) [15,16], a nuclear protein that shuttles to the cyto-plasm, associates with AU-rich sequences at the 3′ untranslated region of mRNAs, including TGFB1 mRNA, causing stabilization and enhancing their translation [17,18]. Furthermore, MIR100HG can associate with HuR, facilitating interactions between HuR and mRNAs [19].
Stimulating or not keratinocytes and PC3U cells with TGFβ confirmed that HuR partitioned mainly in the nucleus and exhibited a substantial cytoplasmic pool (Fig.7a). Silencing HuR using two out of four independent siRNAs (Fig.7b, c) did not significantly affect steady-state MIR100HG levels, but decreased TGFB1 mRNA levels (Fig. 7d, e), and weakly but not-significantly decreased secreted TGFβ1 protein (Supplementary Fig. S7).
RNA immunoprecipitation (RIP) assays in PC3U cells transfected with control or anti-MIR100HG ASO, exhibit-ing robust MIR100HG silencexhibit-ing and correspondexhibit-ing TGFB1 mRNA reduction (Supplementary Fig. S8a, b), demon-strated HuR immunocomplexes with high amounts of MIR100HG (relative to control IgG), and measurable amounts of TGFB1 mRNA (Supplementary Fig. S8c, d). Calculating fold enrichment of each RNA in HuR immu-nocomplexes relative to nonspecific IgG, showed that TGFβ stimulation significantly enhanced HuR-MIR100HG asso-ciation, and MIR100HG silencing eliminated these com-plexes, as expected (Fig. 7f). Confirming our hypothesis, the HuR-TGFB1 complexes lost a large portion of bound TGFB1 mRNA upon MIR100HG silencing (Fig. 7g and Supplementary Fig. S8d). As an additional control, TGFB1 was silenced, decreasing basal MIR100HG levels as expected (Fig. 7h), and after TGFβ stimulation, causing observable but weaker MIR100HG decrease (Supplemen-tary Fig. S8e, f). RIP demonstrated again HuR-TGFB1 association, which decreased, as expected, after TGFB1 silencing (Fig. 7iand Supplementary Fig. S8g), and HuR-MIR100HG complexes showed a decreasing but not statis-tically significant trend (Fig. 7j and Supplementary Fig. S8h). The data suggest that MIR100HG facilitates the formation of HuR-TGFB1 ribonucleoprotein complexes (Fig. 7k).
Regulation of miRNA expression from the
MIR100HG
intron-3
Since unspliced MIR100HG can be processed into miR-NAs (Fig. 2a), signaling inputs that induce spliced MIR100HG should regulate MIR100HG-derived miRNAs, as they share the same transcriptional promoter. Pre-miR-100 showed time-dependent downregulation in HaCaT cells and stable levels in PC3U cells in response to TGFβ stimulation (Supplementary Figs. S9a, S10a). Mature miR-100-5p showed a late-time but not significant trend of upregulation in both cell lines (Supplementary Figs. S9b, S10b), and also increased weakly in A549 cells after 24-h stimulation (Supplementary Fig. S11a). MiR-100-3p expression was undetectable in all cell lines. MiR-361-5p expression, used as a reference, remained unchanged in response to TGFβ (Supplementary Fig. S11b). Pre-miR-125b showed early induction by TGFβ in Fig. 3 MIR100HG regulates TGFβ-signaling responses. a–d
Real-time RT-qPCR for detection of MIR100HG (a), SERPINE1 (b), FN1 (c), and SNAI1 (d) expression in PC3U cells transiently transfected with siMIR100HG#9 and stimulated with TGFβ1 or not for 24 h. Gene expression is normalized relative to the housekeeping gene HPRT1. Error bars represent standard deviation from three different experi-ments (*P < 0.05, **P < 0.01, ***P < 0.001). e Representative immunoblot out of three independent experiments for FN1 and PAI-1 in PC3U cells transiently transfected with control siRNA (siC) or siMIR100HG#9 and treated with TGFβ1 for 24 h. β-ACTIN was used as a loading control and molecular mass (kDa) markers are indicated along with densitometric values of normalized band intensity. f Real-time RT-qPCR for determination of MIR100HG expression in PC3U cells transiently transfected with anti-MIR100HG. Gene expression is normalized relative to the housekeeping gene HPRT1. Error bar represents the standard deviation from three different experiments (*P < 0.05). g Cell viability/proliferation assay with PC3U cells transiently transfected with negative control (Ctr) or specific ASO and treated or not with TGFβ1 for 24 h. Error bars represent standard deviation from three independent experiments (**P < 0.01, ***P < 0.001). h Cell migration assay with PC3U cells transiently transfected with negative control (Ctr) or specific ASO and treated or not with TGFβ1 for 24 h. Error bars represent standard deviation from three independent experiments (*P < 0.05, **P < 0.01). i–l Real-time RT-qPCR for detection of MIR100HG (i), which serves as a control for the experi-ments of panels (m–o), SERPINE1 (j), FN1 (k), and SNAI1 (l) expression in PC3U cells transiently transfected with empty vector (EV) or pcDNA3-MIR100HG and stimulated with TGFβ1 or not for 24 h. Gene expression is normalized relative to the housekeeping gene HPRT1. Error bars represent standard deviation from three different experiments (*P < 0.05). m Representative immunoblot out of three independent experiments for expression of FN1 and PAI-1 in PC3U cells transiently transfected with empty vector (EV) or pcDNA3-MIR100HG and treated with TGFβ1 for 24 h. GAPDH was used as a loading control and molecular mass (kDa) markers are indicated along with densitometric values of normalized band intensity. n Cell viabi-lity/proliferation assay with PC3U cells transiently transfected with empty vector (EV) or pcDNA3-MIR100HG and treated or not with TGFβ1 for 24 h. Error bars represent standard deviation from three independent experiments (*P < 0.05). o Cell migration assay with PC3U cells transiently transfected with empty vector (EV) or pcDNA3-MIR100HG and treated or not with TGFβ1 for 24 h. Error bars represent standard deviation from three independent experiments. Lack of stars indicates a lack of statistical significance.
HaCaT cells and early downregulation in PC3U cells (Supplementary Figs. S9c, S10c). The corresponding mature miRNAs showed (not significant) trends for upre-gulation in HaCaT (Supplementary Fig. S9d, e), early downregulation but only for miR-125b-3p in PC3U cells (Supplementary Fig. S10d, e), and significant upregulation
at 24 h in A549 cells (Supplementary Fig. S11c, d). Pre-miR-let7a-2 showed early upregulation in HaCaT cells and a corresponding (but not significant) trend in PC3U cells (Supplementary Figs. S9f, S10f). Mature let-7a-2 miRNAs showed corresponding trends of upregulation in HaCaT and PC3U cells (Supplementary Figs. S9g, h, S10g, h), The noncodingMIR100HG RNA enhances the autocrine function of transforming growth factor β. . . 3755
whereas significant upregulation only for let-7a-2–3p was observed in A549 cells (Supplementary Fig. S11e, f). Thus, TGFβ can regulate expression of some of the miRNAs of the MIR100HG intron-3, in a cell-type- and time-dependent manner; however, the kinetics of regulation of the miRNAs do not match those of spliced MIR100HG and the regulation is highly variable.
In order to test whether spliced MIR100HG affects intron-3 miRNA biogenesis, we silenced spliced MIR100HG (using siRNApool, Supplementary Fig. S12a) in HaCaT cells, and detected no impact on basal expression of thefive miRNAs or on TGFβ-induced levels of miR-125b-1–3p and let-7a-2–3p (Supplementary Fig. S12). In PC3U cells though, MIR100HG silencing (via ASO, Supplementary Fig. S3a) had no effect on pre-miR-100, but resulted in significant downregulation of mature miR-100-5p, pre-miR-125b, and miR-125b-1–3p/5p (Supplementary Fig. S13). The cumula-tive data suggest that spliced MIR100HG functions in par-allel and possibly independently from the intron-3 miRNAs, however, a clear impact on mature miR-100-5p, miR-125b-5p, and miR-125b-1–3p expression is worth considering.
Let-7a-2–3p regulates TGFβ-target genes and
epithelial cytostasis
We also asked whether intron-3 miRNAs could affect TGFβ signaling output. We overexpressed chemically stabilized mimics of mature miRNAs whose expression was regulated by TGFβ (let-7a-2–3p, miR-125b-1–3p, and miR-125b-5p) or negative control random-sequence miRNA mimic (NCm) in HaCaT cells. Let-7a-2–3p mimic but not miR-125b-1–3p
mimic or miR-125b-5p mimic potentiated TGFβ-induced CAGA12-luciferase activity (Supplementary Fig. S14a). Cotransfecting all three miRNA mimics (let-7a-2–3p, miR-125b-5p, and miR-125b-1–3p) enhanced TGFβ-induced CAGA12-luciferase activity (Supplementary Fig. S14b), to a similar degree as achieved by single let-7a-2–3p mimic, failing to demonstrate additive effects.
Furthermore, ectopic let-7a-2–3p mimic, enforced sig-nificant cell cycle arrest, whereas miR-125b-5p mimic and miR-125b-1–3p mimic showed a trend but not significant effect (Supplementary Fig. S14c). TGFβ stimulation further enhanced the cytostatic response (Supplementary Fig. S14c). We also monitored let-7a-2–3p effects on expression of CDK inhibitors downstream of TGFβ signaling, obser-ving enhancement of CDKN2B/p15Ink4bexpression induced by TGFβ stimulation, and strong upregulation of CDKN1A/ p21Cip1expression in control and TGFβ-treated cells (Sup-plementary Fig. S14d, e).
Analyzing genes of the TGFβ fibrogenic program, let-7a-2–3p mimic enhanced TGFβ-induced SERPINE1 and FN1 expression (Supplementary Fig. S14f). Inhibiting endogen-ous let-7a-2–3p but not let-7a-5p (produced from the 5′-arm of the pre-let-7a-2) or the reference gene miR-361-5p, weakly attenuated TGFβ-induced SERPINE1 and FN1 levels, PAI-1 and N-CAD protein levels, without clear effect on FN1 protein, and phospho-SMAD2 levels in HaCaT cells (Supplementary Fig. S15).
We attempted to identify potential targets of let-7a-2–3p using the DIANA online suite [20]. After removing 54 common predicted targets of let-7a-5p and let-7a-2–3p, we observed several highly significant pathways encompassing the target mRNAs, including glycosaminoglycan biosyn-thetic enzymes, Wnt signaling components, and histone methyltransferases (Supplementary Fig. S16a, b). Parallel querying of the KEGG database for all let-7a-2 target mRNAs revealed additional and diverse functional categories (Supplementary Fig. S16c–e). Focusing on the let-7a-2–3p targets, Wnt and estrogen signaling are known to crosstalk with TGFβ and provide relevant points for analyzing the role of let-7a-2 in the context of cancer biology. Collectively, intron-3 miRNAs can, to some extent, contribute to TGFβ responses, whereas the impact of MIR100HG was more robust and general.
MIR100HG and TGFβ1 expression profiles in diverse
tumors
Since TGFβ induces MIR100HG, which enhances TGFβ signaling in normal and carcinoma cells, we examined MIR100HG expression in cancer patients. Querying the PanCancer Atlas expression data from ~10,000 patients [21], revealed that MIR100HG expression was significantly higher in the lung (where A549 cells belong) and prostate Fig. 4 MIR100HG regulates TGFβ receptor signaling. a
Repre-sentative immunoblots out of three independent experiments for expression of phosphorylated SMAD2 (p-SMAD2), SMAD2/3, phos-phorylated SMAD3 (p-SMAD3), SMAD3, phosphos-phorylated p38 (p-p38), and p38 in PC3U cells transiently transfected with empty vector (EV) or pcDNA3-MIR100HG (as shown in Fig.3i) and treated with TGFβ1 for the indicated time periods.β-ACTIN was used as a loading control and molecular mass (kDa) markers are indicated along with densitometric values of normalized band intensity. Stars indicate nonspecific protein bands recognized by the antibodies. b ChIP-qPCR analysis for SMAD2/ 3 occupancy to the SERPINE1/PAI-1 promoter in PC3U cells stimulated with TGFβ1 for 24 h or not, after transient transfection of empty vector (EV) or pcDNA3-MIR100HG (as shown in Fig. 3i). Control IgG immunoprecipitation data are also shown. Error bars represent standard deviation from three different experiments (*P < 0.05). c CAGA12
-luci-ferase assay in PC3U cells transiently transfected with empty vector (EV) or pcDNA3-MIR100HG and in the presence or absence of TGFβ1 stimulation for 24 h (as shown in Fig.3i). Error bars represent standard deviation from three different experiments (*P < 0.05). d Cell viability assay with PC3U cells transiently transfected with negative control (Ctr) or specific ASO (as shown in Fig.3f) and treated with TGFβ1 in the absence or presence of the indicated concentrations of doxorubicin (Dox), taxol (Tax), or 5′-fluorouracil (5-FU) for 48 h. Error bars represent standard deviation from three independent experiments (**P < 0.01, ***P < 0.001).
Fig. 5 MIR100HG regulates TGFB1 expression and many mem-bers of thefibrogenic program. a Schematic outline of the experi-mental design to identify TGFβ-signaling targets of MIR100HG action. b Gene expression data based on the RT2profiler PCR array of
the human TGFβ/BMP signaling pathway in PC3U cells transiently transfected with control siRNA (siCtrl) or siMIR100HG#9 (as shown in Fig.3a) and with empty vector (EV) or pcDNA3-MIR100HG (as shown in Fig.3i). Data from a single biological repeat are shown, highlighting genes whose expression was affected by both silencing
and overexpression of MIR100HG. c Similar experiment as in panel (b) with the addition of TGFβ1 stimulation for 24 h in PC3U cells. d, e Validation of PCR array analysis using real-time RT-qPCR for detection of MIR100HG, BMPR2, SERPINE1, SOX4, THBS1, TGFBI, GDF2, and ID1 expression in PC3U cells transiently transfected with negative control or specific ASO and stimulated or not with TGFβ1 for 24 h. Gene expression is normalized relative to the housekeeping gene HPRT1. Error bars represent standard deviation from three different experiments (*P < 0.05, **P < 0.01).
Fig. 6 TGFβ1 synthesis and secretion is induced by MIR100HG downstream of TGFβ signaling. a, b Real-time RT-qPCR for detection of TGFB1 (a) and MIR100HG (b) expression in PC3U cells transiently transfected with negative control or MIR100HG-specific ASO and stimulated with TGFβ1 or not for the indicated time periods. Gene expression is normalized relative to the housekeeping gene HPRT1. Error bars represent standard deviation from three different experiments (*P < 0.05, **P < 0.01). c–h Detection of MIR100HG
(c, f), TGFB1 mRNA (d, g) expression by real-time RT-qPCR, and corresponding secreted mature TGFβ1 ligand detected by ELISA in the conditioned medium (e, h) of A549 (c–e) and PC3U (f–h) cells transiently transfected with negative control or MIR100HG-spe-cific ASO in the absence of TGFβ stimulation. Gene expression is normalized relative to the housekeeping gene HPRT1. Error bars represent standard deviation from three different experiments (*P < 0.05, ***P < 0.001).
(where PC3U cells belong) carcinoma relative to other tumors (Supplementary Fig. S17a). A PanCancer Atlas cohort of 494 prostate adenocarcinoma patients [21] revealed a positive correlation between MIR100HG and TGFB1 expression (Fig.8a), and even stronger correlation between MIR100HG and TGFBI expression (Fig. 8b). Significant correlations with weaker coefficients were observed in 566 lung adenocarcinoma samples and in 36
cholangiocarcinoma samples of the PanCancer Atlas (Fig. 8c–e), the latter being confirmed with data from an independent cholangiocarcinoma cohort representing 29 patients (Fig. 8f). Using in situ hybridization on a cancer patient tissue microarray, we detected distinct cytoplasmic MIR100HG signals in lung adenocarcinoma, higher expression in malignant melanoma, and even higher in glioma specimen (Supplementary Fig. S17b), reflecting the The noncodingMIR100HG RNA enhances the autocrine function of transforming growth factor β. . . 3759
findings of the PanCancer Atlas cohorts (Supplementary Fig. S17a).
Since TGFβ signaling is known to play both tumor suppressor and protumorigenic roles dependent on the cancer type and stage [9], we analyzed contributions of MIR100HG and TGFB1 to overall survival of patients with different tumors. Thus, using OncoLnc [22], Kaplan–Meier analysis revealed that in lung adenocarci-noma and cutaneous melaadenocarci-noma, high expression of both MIR100HG and TGFB1 was linked to long patient sur-vival (Supplementary Fig. S18a–d), suggesting their
tumor-suppressive role. Conversely, high MIR100HG and TGFB1 expression correlated with poor survival outcome in stomach adenocarcinoma (Supplementary Fig. S18e, f). The cancer database analyses must be considered with caution, yet they suggest that MIR100HG and TGFB1 present similar predictive values in the prognosis of cer-tain cancers.
Discussion
We here establish that TGFβ upregulates spliced MIR100HG, which positively regulates TGFβ responses in several normal and cancer cell types (Figs.1–4). Signaling via the TGFβRI and SMAD proteins (Fig.2), but possibly additional mediators (e.g. MAPK) participate in this reg-ulation, as previously established for pancreatic carcino-mas [6]. Mechanistically, MIR100HG facilitates the RNA-binding protein HuR to form complexes with the TGFB1 mRNA, thus stabilizing the mRNA and enhancing auto-crine TGFβ1 production and autogenous responses (Fig. 7k). Our observations are compatible with recent findings that demonstrated a function of MIR100HG as a HuR protein facilitator [19], and extend this model in the context of TGFβ cancer biology. The 3′ untranslated region of the TGFB1 mRNA contains AU-rich sequences recognized by HuR [18]. Furthermore, HuR-mediated stabilization of TGFB1 mRNA can sustain TGFβ signaling in cardiac fibroblasts during fibrosis [17]. Combined RIP and cell fractionation analyses confirm this model in the context of cancer cell biology (Fig. 7). In fibroblasts, TGFβ signaling was shown to induce translocation of nuclear HuR to the cytoplasm where association with mRNA seems to take place [17]. In normal epithelial and carcinoma cells, we observed weak mobilization of nuclear HuR to the cytoplasm in response to TGFβ (Fig.7a). Yet, we find more convincing the fact that MIR100HG accu-mulates in the cytoplasm of all cell types examined (Fig. 2h–k), suggesting that TGFB1 mRNA stabilization depends on cytoplasmic accumulation of MIR100HG. Interestingly, RIP experiments reproducibly showed that TGFβ signaling enhanced association between HuR, MIR100HG, and TGFB1 mRNA (Fig. 7g–i), suggesting that TGFβ, in addition to promoting transcription from the MIR100HG and TGFB1 genes, also regulates cytoplasmic RNA-protein assembly (Fig.7k). HuR encompasses three RNA-recognition motifs (RRM1–3, Fig.7k), one of which facilitates HuR dimerization [23]. We envision a mechanism whereby MIR100HG binding to one RRM, facilitates the association of TGFB1 mRNA with a second RRM in dimeric HuR (Fig. 7k).
Beyond the above mechanism, additional processes explaining oncogenic roles of MIR100HG have been Fig. 7 MIR100HG engages HuR to regulate TGFβ1. a
Repre-sentative immunoblots out of two independent experiments for expression of HuR in HaCaT (left) and PC3U (right) cells treated with TGFβ1 for 24 h. PARP-1 (nuclear) and α-TUBULIN (cytoplasmic) were used as fractionation controls and molecular mass (kDa) markers are indicated along with densitometric values of normalized band intensity. b–e Representative immunoblot (b) out of three independent experiments for expression of HuR, and corresponding real-time RT-qPCR for detection of HuR (c), MIR100HG (d), and TGFB1 (e) mRNA expression in PC3U cells transiently transfected with negative control or specific siRNA for the indicated time periods. GAPDH was used as loading control and molecular mass (kDa) markers are indi-cated. A star indicates nonspecific protein bands recognized by the antibody. Gene expression is normalized relative to the housekeeping gene HPRT1. Error bars represent standard deviation from three dif-ferent experiments (*P < 0.05, **P < 0.01, ***P < 0.001). f, g RIP analysis in PC3U cells transiently transfected with negative control or MIR100HG-specific ASO and stimulated with TGFβ1 or not for 48 h. Fold enrichment of the HuR-specific RIP relative to the IgG control is reported for MIR100HG (f) and TGFB1 (g) RNAs. Error bars represent standard deviation from three different experiments (*P < 0.05). h Real-time RT-qPCR for detection of TGFB1 and MIR100HG expression in PC3U cells transiently transfected with negative control or TGFB1-specific siRNA and treated with TGFβ1 for 48 h. Gene expression is normalized relative to the housekeeping gene HPRT1. Error bars represent standard deviation from three different experi-ments (*P < 0.05). i, j RIP analysis in PC3U cells transiently trans-fected with negative control or TGFB1-specific siRNA and stimulated with TGFβ1 or not for 48 h. Fold enrichment of the HuR-specific RIP relative to the IgG control is reported for TGFB1 (i) and MIR100HG (j) RNAs. Error bars represent standard deviation from three different experiments (*P < 0.05). k Diagrammatic scheme of TGFβ signaling regulating the downstream target genes MIR100HG and TGFB1, mediated by the two TGFβ receptor kinases and SMAD complexes together with gene-specific transcription factors (TF, note color dif-ferentiation based on gene specificity), leading to transcriptional induction of MIR100HG and TGFB1. Two possible (dashed red arrows) and one confirmed mechanism of action of MIR100HG are illustrated: (a) cytoplasmic MIR100HG associates with HuR in the cytoplasm (HuR domains are highlighted) and causes stabilization and accumulation of TGFB1 mRNA, which leads to enhanced synthesis of latent and mature secreted TGFβ1 (dimeric circles—mature TGFβ1— with twinkled lines—N-terminal pro-domain) that further stimulates the pathway in an autocrine manner. The two RNAs are shown to interact with distinct HuR RRM domains (not proven) and for com-pletion, nuclear HuR is also illustrated. (b) Cytoplasmic MIR100HG promotes or stabilizes TGFβ receptor-SMAD complexes that prolong signaling. (c) A transcriptional mechanism in which nuclear MIR100HG enhances SMAD-mediated transcription of the TGFB1 gene.
reported. In acute megakaryoblastic leukemia, silencing of MIR100HG impaired cell proliferation [24]. In osteo-sarcoma cells, MIR100HG expression peaked during early
G1 cell cycle phase, and MIR100HG silencing caused cell cycle arrest [19]. In osteosarcoma cells, MIR100HG pro-motes proliferation by interacting with the EZH2 protein of Fig. 8 MIR100HG and TGFB1 expression analysis in human
cancers. a–e Expression correlation of TGFB1 and MIR100HG (a, c, e) or TGFBI and MIR100HG (b, d) in prostate adenocarcinoma (a, b), lung adenocarcinoma (c, d), and cholangiocarcinoma (e) patients enlisted in the PanCancer Atlas. Expression values are reported in a
natural logarithmic scale and Pearson and Spearman correlation values are indicated along with the corresponding P values. f Expression correlation of TGFB1 and MIR100HG in 29 samples from intrahepatic cholangiocarcinoma patients included in the French national liver biobank network.
the polycomb repressor complex-2, causing repression of LATS1/2, mediators of Hippo signaling [25]. In breast cancer cells, triple-helical formation between MIR100HG and p27Kip1 DNA suppresses p27Kip1 and promotes pro-liferation [26].
As TGFβ signaling instructs the MIR100HG promoter, it may also affect the maturation of miRNAs derived from MIR100HG intron-3. TGFβ regulated expression of some but not all MIR100HG miRNAs with diverse kinetic profiles among different carcinoma cells (Supplementary Figs. S9 and S10). Selective regulation of miRNA maturation could be mediated by the direct association of SMAD3 with spe-cific pre-miRNAs and the enzyme DROSHA [27]. However, MIR100HG-miRNAs were not among those processed via the TGFβ/SMAD3/DROSHA-specific mechanism [27]. Furthermore, TGFβ induced expression of 100 and miR-125b, but not of let-7a-2 in pancreatic adenocarcinoma cells [6]. The distinct MIR100HG-miRNAs induced by TGFβ in keratinocytes and diverse carcinoma cells (this study) or in pancreatic adenocarcinoma [6] may reflect different physio-logical outcomes mediated by TGFβ. We suggest that induction of the antitumorigenic let-7a-2-3p by TGFβ enhances its antiproliferative effect (Supplementary Fig. S14c). On the other hand, in pancreatic adenocarcinoma, TGFβ frequently loses its antiproliferative power and instead promotes EMT and stemness [28], including enhanced expression of miR-100 and miR-125b, which promote EMT [6]. Additional studies highlight protumorigenic actions for miR-100 and miR-125b; chemotherapy-resistant colorectal cancer cells exhibit high MIR100HG, 100, and miR-125b expression, the miRNAs enhancing Wnt signaling [29]. In prostate carcinoma PC3U cells, silencing of spliced MIR100HG downregulated expression of mature miR-100 and miR-125b (Supplementary Fig. S14c–e). This may explain why silencing MIR100HG sensitized the PC3U cells to cytotoxic drugs (Fig.4d). Furthermore, miR-100 induces mammary EMT by downregulating the chromatin remodel-ing factor SMARCA5 [30]. We observed that silencing MIR100HG reduced TGFβ responses and overexpression of MIR100HG, lacking introns and therefore unable to influence intron-3 miRNA biosynthesis (data not shown), resulted in enhanced TGFβ responses (Figs.3and4). Thus, MIR100HG has functions beyond hosting miRNAs in one if its introns.
The link established here between MIR100HG and TGFB1 is supported by analyses of expression in many tumors (Supplementary Fig. S17a). MIR100HG expression data from PanCancer Atlas were reproduced by in situ hybridization in cancer specimen (Supplemen-tary Fig. S17b). Furthermore, clinical data correlated MIR100HG expression with poor survival in certain tumors and with better survival in certain others (Sup-plementary Fig. S18). Indeed, MIR100HG promotes col-orectal cancer progression and predicts poor prognosis
[31]. It is possible that the dual action of MIR100HG in cancer is linked to the dual action of TGFβ, known to have antitumor properties in certain cancers and protu-morigenic actions in others, a matter worth examining in future studies.
Materials and methods
Reagents
Recombinant human TGFβ1, 1–5 ng/ml (PeproTech EC Ltd, London, UK) with 4 mM HCl/0.1% BSA as a vehicle, GW6604 (5μM, Ludwig Cancer Research Ltd, New York, USA), LY2157299 (5μM), doxorubicin (0.7 μM), taxol (0.7 μM), and 5´-fluorouracil (6.25 μM) (Sigma-Aldrich, Stockholm, Sweden), with dimethyl sulfoxide as a vehicle, were added to cells.
Plasmids
Human MIR100HG (NR_024430.2) was amplified using total RNA from MCF10A cells, cDNA synthesis was syn-thesized via PrimeScript (Takara Bio-Europe, Saint-Ger-main-en-Laye, France), and PCR-amplified. The cDNA (3129 bp) was cloned in HindIII/EcoRI sites of pcDNA3 (Supplementary Fig. S4a), and sequenced (primers listed in Supplementary Table S1).
Transfections
SiRNAs/ASOs (20–25 nM; Supplementary Table S2) were transiently transfected once or twice sequentially using siLentFect (Bio-Rad Laboratories, Solna, Sweden) targeting mRNAs or using ASOs; Dharmafect-1 (Dharmacon/VWR, Uppsala, Sweden) targeting lncRNAs; lipofectamine-3000 (ThermoFisherScientific, Stockholm, Sweden) when trans-fecting plasmids (pcDNA3-MIR100HG, pcDNA3), cotrans-fecting siRNAs and plasmids or transcotrans-fecting MirVana miRNA mimics and miRNA inhibitors (Supplementary Table S3; ThermoFisherScientific), each at 10 nM. Upon transfection for 24 h, cells switched to starvation medium (0.1–1% fetal bovine serum (FBS, Biowest, Esbjerg, Den-mark) in Dulbecco’s modified Eagle’s medium (DMEM, Sigma-Aldrich)) and TGFβ1 stimulation for 24 h (total period of 48 h).
Viability assays
Cells (3000/well) seeded in 96-well plates, transfected with ASOs or plasmids, were monitored at 48 h by MTS assay, following the manufacturer’s protocol (Promega Biotech AB, Nacka, Sweden). For cytotoxicity analysis, IC50curves
for each drug were established in PC3U cells under trans-fection conditions prior tofinal experiments. Luminescence units from treated cells were normalized against controls. Graphs show average values of % viability with standard deviations of at least three biological experiments.
Wound-healing assay
Cells transfected with ASOs or plasmids for 48 h were seeded (3 × 10⁴ cells/well) in the complete medium into Culture-Insert-2 (Ibidi GmbH, Gräfelfing, Germany). Con-fluent cell layers were starved in FBS-free medium for 16 h, the silicone insert was removed, detached cells were removed by washing twice with PBS and vehicle, or 5 ng/ml TGFβ1 were added in fresh medium. Wound closure was observed at 0 and 15 h using a Zeiss Axioplan microscope (objective ×10) with MRC digital camera. Wound surface area was quantified by ImageJ-1.47 v as a percentage of open wound per condition.
qPCR, microarray, and database analysis
RNA extraction, reverse transcription, and qPCR were performed as described [12] with indicated primers (Supplementary Table S1). Using RT²-Profiler™ PCR Array (330231/PAHS-035Z, Qiagen, Sollentuna, Swe-den), the expression of 84 human TGF β/BMP-Signaling-Pathway genes was measured. RNA expression was cal-culated based on the 2−ΔΔCt method, normalized to reference genes (GAPDH, HPRT1, 18S-rRNA, TBP1) and graphed as averages with standard deviations of at least three biological experiments. Affymetrix transcriptomic data (GSE23952, GSE114761) deposited in the Gene Expression Omnibus (GEO) from NCBI were retrieved and analyzed using the GEO2R web tool. Suitability for direct comparison was assessed by sample value dis-tribution and verification as median-centered. Adjusted P values were calculated via the Benjamini–Hochberg false discovery rate method.
TaqMan assays
Small (<200 nt) RNA isolated by the NucleoSpin miRNA kit (Macherey-Nagel, Solna, Sweden) was used for Taq-Man advanced miRNA assays (Supplementary Table S4) according to the manufacturer’s protocol (Thermo-FisherScientific). qPCR was performed on a CFX96 cycler (Bio-Rad Laboratories). miRNA expression was calculated based on the 2−ΔΔCtmethod, normalized to reference (miR-191-5p, miR-361-5p) miRNAs, and graphed as averages with standard deviations of at least three biological experiments.
In situ hybridization
Formalin-fixed, paraffin-embedded tissues from melanoma, glioma, and lung adenocarcinoma patients from the Human Protein Atlas project (https://www.proteinatlas.org/) were hybridized in situ for MIR100HG detection using RNA-scope Assays (Advanced Cell Diagnostics, Newark, CA, USA) [32].
RNA-binding protein immunoprecipitation
RIP was performed according to the Magna-RIPTM RNA-binding protein immunoprecipitation kit (Millipore/Merck, Stockholm, Sweden) as described [12]. Beads loaded with 5μg of anti-HuR antibody (Supplementary Table S5) or normal mouse IgG (Millipore/Merck) and primers (Sup-plementary Table S1) were used. Graphs show average values of relative normalized levels (% input) or enrichment relative to IgG control with standard deviations of at least three biological experiments.
Luciferase assays
Luciferase assays in HaCaT or PC3U cells transiently transfected with the CAGA12-luciferase promoter reporter and siRNA pools, pcDNA3-MIR100HG, or miRNA mimics were performed using thefirefly and renilla dual-luciferase Assay kit (Biotium, Fremont, CA, USA) as described [12]. Relative normalized luciferase activity is expressed as averages from triplicate determinations, with standard deviations. Each experiment was repeated at least twice.
ChIP
ChIP experiments were performed as described [12], with 3μg of anti-Smad2/3 antibody (BD Biosciences-Europe, Stockholm, Sweden), normal mouse IgG (Millipore/Merck), and primers for qPCR of precipitated MIR100HG and SERPINE1 DNAs (Supplementary Table S1).
Immunoblotting
Protein extraction, nucleocytoplasmic fractionation fol-lowed by RNA extraction, protein quantification, and immunoblotting was performed as described [12], with primary antibodies (Supplementary Table S5) and densito-metric quantification performed using ImageJ-1.47 (National Institutes of Health, MD, USA). Protein-band density normalized against the corresponding loading con-trol (α-TUBULIN, β-ACTIN, or GAPDH) is expressed as 1 under basal or control conditions. Phosphoprotein and The noncodingMIR100HG RNA enhances the autocrine function of transforming growth factor β. . . 3763
cleaved-protein density was normalized to the correspond-ing total protein.
Thymidine-incorporation assay
HaCaT cells transiently transfected with siRNAs or miRNA mimics were seeded in 1% FBS/DMEM and treated with TGFβ1 for 24 h. Thymidine-incorporation assays were performed as described [12]. Average values with standard deviation of triplicate repeats for each condition are plotted from experiments repeated twice.
ELISA
PC3U or A549-conditioned media were concentrated 50× through Amicon Ultra-15 centrifugal filters (Merck/Milli-pore) at 3000× g for 15 min at 4 °C or used without con-centration (for certain PC3U experiments). Secreted mature TGFβ1 was measured using the human TGFβ1-Duoset ELISA kit according to the manufacturer’s instructions (R&D Systems, Oxon, UK).
PanCancer Atlas and cholangiocarcinoma cohort
analysis
The cBioPortal for Cancer Genomics [33,34] was used to retrieve RNA-seq data from cancer patients and gene coexpression analyses of MIR100HG in carcinomas. All gene expressions were equally weighted. For MIR100HG-TGFB1 coexpression analysis in the intrahepatic cho-langiocarcinoma cohort from the French national liver biobank network, tissues were acquired as described [35], after written informed consent from all patients and study protocol approval by the local ethics committee and insti-tutional review board of INSERM (IRB00003888). Pearson correlation value was calculated as described [35]. Survival Kaplan–Meier plots were generated using the OncoLnc platform [22].
miRNA target analysis
Targets of let-7a-5p and let-7a-2–3p miRNAs were pre-dicted using the DIANA microT-CDS algorithm [20]. For pathway prediction among let-7a-2–3p targets, DIANA mirPathv.3 was used (p-value threshold 0.001, microT threshold 0.8). For KEGG pathway prediction of common and unique targets of let-7a-5p and let-7a-2–3p, Enrichr (https://amp.pharm.mssm.edu/Enrichr/#) was used.
Cell culture
Cell and media information is listed in Supplementary Table S6. Cells were free of mycoplasma (tested every 2 months)
and authenticated using PCR single-locus technology (Eurofins, Uppsala, Sweden).
Statistics
The results are shown as mean values from n= 3 or n = 2 independent biological experiments. Error bars represent standard deviations. Each biological experiment included triplicate or quintuplicate technical repeats. Comparisons were performed using a two-tailed paired Student’s t test and statistical significance is represented by stars (*P < 0.05, **P < 0.01, ***P < 0.001).
Acknowledgements We thank members of our laboratory for discus-sions, Caroline Gélabert and Eric Ahlström for technical assistance, and Anders Sundqvist for advice and reagents.
Author contributions PP and ArM conceived the project; PP and DMRJr designed experiments; PP, DMRJr, AnM, AB, and LC acquired the data; PP, DMRJr, LC, and ArM analyzed the data; PP, DMRJr, AnM, LC, CC, FP, CHH, and ArM interpreted the data; PP drafted and ArMfinalized the paper. All authors critically revised the paper and approved submission for publication.
Funding This work was supported by Ludwig Cancer Research, Cancerfonden [CAN2012/438, CAN2015/438, CAN2018/469] to ArM, Vetenskapsrådet [K2013-66X-14936-10-5, 2017-01588-3, 2018-02757-3] to ArM, [2015-02757, 2020-01291] to CHH, Barn-cancerfonden [PR2018-0091] to ArM, European Research Council [787472] to CHH, Bodossaki Foundation and Alexander Onassis Foundation, Greece to PP, Inserm, Université de Rennes-1, and ITMO Cancer AVIESAN Plan Cancer [C18007NS] to CC.
Compliance with ethical standards
Compliance with ethical standards The intrahepatic cholangiocarci-noma cohort from the French national liver biobank network has been maintained after written informed consent from all patients and study protocol approval by the local ethics committee and institutional review board of INSERM (IRB00003888).
Conflict of interest The authors declare no competing interests. Publisher’s note Springer Nature remains neutral with regard to jurisdictional claims in published maps and institutional affiliations. Open Access This article is licensed under a Creative Commons Attribution 4.0 International License, which permits use, sharing, adaptation, distribution and reproduction in any medium or format, as long as you give appropriate credit to the original author(s) and the source, provide a link to the Creative Commons license, and indicate if changes were made. The images or other third party material in this article are included in the article’s Creative Commons license, unless indicated otherwise in a credit line to the material. If material is not included in the article’s Creative Commons license and your intended use is not permitted by statutory regulation or exceeds the permitted use, you will need to obtain permission directly from the copyright holder. To view a copy of this license, visithttp://creativecommons.
References
1. Esteller M. Non-coding RNAs in human disease. Nat Rev Genet. 2011;12:861–74.
2. Pelechano V, Steinmetz LM. Gene regulation by antisense tran-scription. Nat Rev Genet. 2013;14:880–93.
3. Tordonato C, Di Fiore PP, Nicassio F. The role of non-coding RNAs in the regulation of stem cells and progenitors in the normal mammary gland and in breast tumors. Front Genet. 2015;6:72. 4. Dews M, Fox JL, Hultine S, Sundaram P, Wang W, Liu YY, et al.
The myc-miR-17~92 axis blunts TGFβ signaling and production of multiple TGFβ-dependent antiangiogenic factors. Cancer Res. 2010;70:8233–46.
5. Montes M, Nielsen MM, Maglieri G, Jacobsen A, Hojfeldt J, Agrawal-Singh S, et al. The lncRNA MIR31HG regulates p16INK4A expression to modulate senescence. Nat Commun. 2015;6:6967.
6. Ottaviani S, Stebbing J, Frampton AE, Zagorac S, Krell J, de Giorgio A, et al. TGF-β induces miR-100 and miR-125b but blocks let-7a through LIN28B controlling PDAC progression. Nat Commun. 2018;9:1845.
7. Ha M, Kim VN. Regulation of microRNA biogenesis. Nat Rev Mol cell Biol. 2014;15:509–24.
8. Bueno MJ, Malumbres M. MicroRNAs and the cell cycle. Bio-chim Biophys Acta. 2011;1812:592–601.
9. David CJ, Massagué J. Contextual determinants of TGFβ action in development, immunity and cancer. Nat Rev Mol Cell Biol. 2018;19:419–35.
10. Papoutsoglou P, Moustakas A. Long non-coding RNAs and TGF-β signaling in cancer. Cancer Sci. 2020;111:2672–81.
11. Heldin C-H, Landström M, Moustakas A. Mechanism of TGF-β signaling to growth arrest, apoptosis, and epithelial-mesenchymal transition. Curr Opin Cell Biol. 2009;21:166–76.
12. Papoutsoglou P, Tsubakihara Y, Caja L, Morén A, Pallis P, Ameur A, et al. The TGFB2-AS1 lncRNA regulates TGF-β sig-naling by modulating corepressor activity. Cell Rep. 2019;28:3182–98. e3111
13. Maupin KA, Sinha A, Eugster E, Miller J, Ross J, Paulino V, et al. Glycogene expression alterations associated with pancreatic can-cer epithelial-mesenchymal transition in complementary model systems. PLoS ONE. 2010;5:e13002.
14. Gordian E, Welsh EA, Gimbrone N, Siegel EM, Shibata D, Creelan BC, et al. Transforming growth factor β-induced epithelial-to-mesenchymal signature predicts metastasis-free sur-vival in non-small cell lung cancer. Oncotarget. 2019;10:810–24. 15. Ma WJ, Cheng S, Campbell C, Wright A, Furneaux H. Cloning and characterization of HuR, a ubiquitously expressed Elav-like protein. J Biol Chem. 1996;271:8144–51.
16. Spångberg K, Wiklund L, Schwartz S. HuR, a protein implicated in oncogene and growth factor mRNA decay, binds to the 3′ ends of hepatitis C virus RNA of both polarities. Virology. 2000;274:378–90.
17. Bai D, Gao Q, Li C, Ge L, Gao Y, Wang H. A conserved TGFβ1/ HuR feedback circuit regulates thefibrogenic response in fibro-blasts. Cell Signal. 2012;24:1426–32.
18. Nabors LB, Gillespie GY, Harkins L, King PH. HuR, a RNA stability factor, is expressed in malignant brain tumors and binds to adenine- and uridine-rich elements within the 3′ untranslated regions of cytokine and angiogenic factor mRNAs. Cancer Res. 2001;61:2154–61.
19. Sun Q, Tripathi V, Yoon JH, Singh DK, Hao Q, Min KW, et al. MIR100 host gene-encoded lncRNAs regulate cell cycle by modulating the interaction between HuR and its target mRNAs. Nucleic Acids Res. 2018;46:10405–16.
20. Vlachos IS, Hatzigeorgiou AG. Functional analysis of miRNAs using the DIANA tools online suite. Methods Mol Biol. 2017;1517:25–50.
21. Hoadley KA, Yau C, Hinoue T, Wolf DM, Lazar AJ, Drill E, et al. Cell-of-origin patterns dominate the molecular classification of 10,000 tumors from 33 types of cancer. Cell. 2018;173:291–304. e296
22. Anaya J. OncoLnc: linking TCGA survival data to mRNAs, miRNAs, and lncRNAs. Peerj Comput Sci. 2016;2:e67. 23. Pabis M, Popowicz GM, Stehle R, Fernandez-Ramos D, Asami S,
Warner L, et al. HuR biological function involves RRM3-mediated dimerization and RNA binding by all three RRMs. Nucleic Acids Res. 2019;47:1011–29.
24. Emmrich S, Streltsov A, Schmidt F, Thangapandi VR, Reinhardt D, Klusmann JH. LincRNAs MONC and MIR100HG act as oncogenes in acute megakaryoblastic leukemia. Mol Cancer. 2014;13:171.
25. Su X, Teng J, Jin G, Li J, Zhao Z, Cao X, et al. ELK1-induced upregulation of long non-coding RNA MIR100HG predicts poor prognosis and promotes the progression of osteosarcoma by epi-genetically silencing LATS1 and LATS2. Biomed Pharmacother. 2019;109:788–97.
26. Wang S, Ke H, Zhang H, Ma Y, Ao L, Zou L, et al. LncRNA MIR100HG promotes cell proliferation in triple-negative breast cancer through triplex formation with p27 loci. Cell Death Dis. 2018;9:805.
27. Davis BN, Hilyard AC, Nguyen PH, Lagna G, Hata A. Smad proteins bind a conserved RNA sequence to promote microRNA maturation by Drosha. Mol Cell. 2010;39:373–84.
28. David CJ, Huang YH, Chen M, Su J, Zou Y, Bardeesy N, et al. TGF-β tumor suppression through a lethal EMT. Cell. 2016;164:1015–30.
29. Lu Y, Zhao X, Liu Q, Li C, Graves-Deal R, Cao Z, et al. lncRNA MIR100HG-derived miR-100 and miR-125b mediate cetuximab resistance via Wnt/β-catenin signaling. Nat Med. 2017;23:1331–41. 30. Chen D, Sun Y, Yuan Y, Han Z, Zhang P, Zhang J, et al. miR-100 induces epithelial-mesenchymal transition but suppresses tumor-igenesis, migration and invasion. PLoS Genet. 2014;10:e1004177. 31. Li W, Yuan F, Zhang X, Chen W, Tang X, Lu L. Elevated MIR100HG promotes colorectal cancer metastasis and is asso-ciated with poor prognosis. Oncol Lett. 2019;18:6483–90. 32. Wang F, Flanagan J, Su N, Wang LC, Bui S, Nielson A, et al.
RNAscope: a novel in situ RNA analysis platform for formalin-fixed, paraffin-embedded tissues. J Mol Diagnostics. 2012;14:22–29. 33. Cerami E, Gao J, Dogrusoz U, Gross BE, Sumer SO, Aksoy BA,
et al. The cBio cancer genomics portal: an open platform for exploring multidimensional cancer genomics data. Cancer Discov. 2012;2:401–4.
34. Gao J, Aksoy BA, Dogrusoz U, Dresdner G, Gross B, Sumer SO, et al. Integrative analysis of complex cancer genomics and clinical profiles using the cBioPortal. Sci Signal. 2013;6:pl1.
35. Merdrignac A, Angenard G, Allain C, Petitjean K, Bergeat D, Bellaud P, et al. A novel transforming growth factor β-induced long noncoding RNA promotes an inflammatory microenviron-ment in human intrahepatic cholangiocarcinoma. Hepatol Com-mun. 2018;2:254–69.