ÉCOLE DE TECHNOLOGIE SUPÉRIEURE UNIVERSITÉ DU QUÉBEC
THESIS PRESENTED TO
ÉCOLE DE TECHNOLOGIE SUPÉRIEURE
IN PARTIAL FULFILLMENT OF THE REQUIREMENTS FOR THE DEGREE OF DOCTOR OF PHILOSOPHY
Ph.D.
BY
Vasile STROIAN
DEVELOPMENT OF A PROTOTYPE FOR MULTIDIMENSIONAL PERFORMANCE MANAGEMENT IN SOFTWARE ENGINEERING
MONTREAL, 19 APRIL 2011
THIS THESIS HAS BEEN EVALUATED
BY THE FOLLOWING BOARD OF EXAMINERS:
Pierre Bourque, Ph.D., Thesis Supervisor
Department of Software and IT Engineering, École de Technologie Supérieure
Alain Abran, Ph.D., Thesis Co-Supervisor
Department of Software and IT Engineering, École de Technologie Supérieure
Alain April, Ph.D., President of the Board of Examiners
Department of Software and IT Engineering, École de Technologie Supérieure
Eric Paquette, Ph.D., Examiner
Department of Software and IT Engineering, École de Technologie Supérieure
Andreas Schmietendorf, Ph.D., External Examiner University of Magdeburg, Magdeburg, Germany
THIS THESIS WAS PRESENTED AND DEFENDED BEFORE A BOARD OF EXAMINERS AND PUBLIC
22 MARCH 2011
DEDICATION
This thesis is dedicated to my mother Maria and my father Grigore for their endless love and support throughout my life.
This thesis is also dedicated to my daughter, Marie Louise, with the hope that she will realize that higher education is important in life, and that one day her dream to become a medical doctor will come true.
ACKNOWLEDGMENTS
A Ph.D. thesis should bring the writer feelings of fulfillment, accomplishment, and joy, which is certainly the case for me.
I am grateful to the following people, who provided guidance, advice, and support throughout my Ph.D. studies.
I heartily thank my supervisor, Pierre Bourque, Ph.D. for his encouragement, commitment, and support during this lengthy and often stressful process. His professionalism, constructive criticism, and guidance helped me during my research and showed me the way into the world of “engineering science”.
I extend my warm and sincere thanks and gratitude to my co-supervisor, Alain Abran, Ph.D. I have been privileged to benefit from his comprehensive expertise and vast knowledge.
I also thank my daughter, Marie Louise, for her support. She has been a shining light throughout these past few years. She always encouraged me, even at the most difficult times.
DEVELOPMENT OF A PROTOTYPE FOR MULTIDIMENSIONAL PERFORMANCE MANAGEMENT IN SOFTWARE ENGINEERING
Vasile STROIAN
RÉSUMÉ
Une meilleure compréhension et l’amélioration de la performance sont des problèmes importants, d’actualité et difficiles pour les organisations. Conséquemment, les gestionnaires sont toujours à l'affût de meilleures solutions pour gérer la performance au sein de leurs organisations.
Une conséquence importante de ne pas avoir de cadre conceptuel de gestion de la performance (Performance Management Framework ou PMF) en place est l’incapacité de différencier le succès de l'échec au sein d’une organisation. Les cadres conceptuels de gestion de la performance sont nécessaires aux organisations qui doivent planifier, assurer un suivi et contrôler leurs activités, ainsi que prendre des décisions éclairées. L'utilisation d'un cadre conceptuel de gestion de la performance peut offrir à une organisation une meilleure vision de son fonctionnement réel et indiquer si elle est en voie d’atteindre ses objectifs.
Au fil des ans, plusieurs cadres ont été développés pour les gérer les actifs tangibles et intangibles de l'organisation. Dans le passé, la gestion de la performance a surtout été orientée vers le point de vue économique. Kaplan et Norton ont ajouté trois autres points de vue dans leur cadre, soit le Balanced Scorecard (BSC), et cet ajout représente une contribution majeure au domaine.
Les cadres de gestion de la performance existants ne satisfont pas aux exigences de la gestion du génie logiciel étant donné que différents points de vue doivent être pris en compte en même temps. De plus, les données quantitatives sous-jacentes sont multidimensionnelles et les techniques de visualisation à deux et trois dimensions ne sont pas adéquates. Troisièmement, chaque organisation a ses propres points de vue de performance qui lui sont spécifiques. Dernièrement, ces points de vue doivent être représentés de façon consolidée pour une saine gestion de l'ensemble.
Le but de cette thèse est de développer un prototype pour la gestion de la performance multidimensionnelle en génie logiciel. La thèse commence par définir les termes importants et les concepts clés utilisés dans la recherche : le logiciel, la performance, la gestion, les modèles multidimensionnels, le développement, l'ingénierie, et le prototype, et les diverses combinaisons de ces termes. Il est suivi par une revue des modèles multidimensionnels de la performance qui sont spécifiques au génie logiciel et des modèles multidimensionnels de performance qui sont disponibles de façon générique en management. Un cadre de gestion de la performance en génie logiciel est proposé qui est divisé en quatre phases : la conception, la mise en œuvre, l'utilisation du cadre, et l’amélioration de la performance. Un prototype est ensuite proposé en appui à ce cadre. Le prototype comprend notamment des outils d'analyse
visuelle pour gérer, interpréter et comprendre les résultats sous une forme consolidée tout en permettant l’accès aux valeurs des dimensions individuelles de la performance. De plus, le référentiel de données de projet logiciel mis à disposition par l'International Software Benchmarking Standard Group (ISBSG) est intégré au sein du prototype.
Mots-clés : Modèles multidimensionnels de performance, Mesure de la performance,
Gestion de la performance, Visualisation, Management du génie logiciel, International Software Benchmarking Standards Group, ISBSG, QEST, ISO 9126
DEVELOPMENT OF A PROTOTYPE FOR MULTIDIMENSIONAL PERFORMANCE MANAGEMENT IN SOFTWARE ENGINEERING
Vasile STROIAN
ABSTRACT
Managing performance is an important, and difficult, topic, and tools are needed to help organizations manage their performance. Understanding, and improving performance is an important problem.
Performance management has become more and more important for organizations, and managers are always on the lookout for better solutions to manage performance within their organizations.
One of the most important consequences of not having a Performance Management Framework (PMF) in place is the difficulty of differentiating organizational success from failure over time. Performance Management Frameworks have become important to organizations that need to plan, monitor, control, and improve their decisions. Use of a PMF can show an organization how it is performing and indicate whether or not an organization is going in the right direction to achieve its objectives.
Over the years, several frameworks have been developed to address the management of organizational assets, both tangible and intangible. Performance measurement has always mostly been focused on the economic viewpoint. The framework developed by Kaplan and Norton adds three other viewpoints to this, and this addition represents a significant improvement to PMFs.
The PMFs currently proposed do not meet the analytical requirements of software engineering management when various viewpoints must be taken into account concurrently. This difficulty is compounded by the fact that the underlying quantitative data are multi- dimensional, and so the usual two- and three-dimensional approaches to visualization are generally not sufficient to represent such models. Organizations vary considerably in the wide variety of viewpoints that influence their performance, and every organization has their own viewpoints that they want to manage, and which must be represented in a consolidated manner.
The purpose of this thesis is to develop a prototype for managing multidimensional performance in software engineering. The thesis begins by defining the important terms or key concepts used in the research: software, performance, management, model, multidimensional, development, engineering, and prototype, and the various associations of these terms. This is followed by a review of the multidimensional PMFs that are specific to software engineering and the generic multidimensional performance models that are available to management.
A framework for managing performance in software engineering in four phases: design, implementation, use of the framework, and performance improvement is then presented. Based on this framework, a prototype tool is developed. The prototype notably includes visual analytical tools to manage, interpret, and understand the results in a consolidated manner, while at the same time keeping track of the values of the individual dimensions of performance. The repository of software project data made available by the International Software Benchmarking Standard Group (ISBSG) is integrated into and used by the prototype as well.
Keywords : Multidimensional management models, Performance measurement,
Performance management, Visualization, Software engineering management, International Software Benchmarking Standards Group, ISBSG, QEST, ISO 9126
TABLE OF CONTENTS
Page
INTRODUCTION ...1
CHAPTER 1 PRESENTATION OF KEY CONCEPTS ...17
1.1 What is a prototype? ...18
1.2 What is software? ...19
1.3 What is engineering? ...20
1.4 What is software engineering? ...20
1.5 What is multidimensional? ...22
1.6 What are management and project management? ...22
1.7 What is software engineering management? ...23
1.8 What is performance? ...24
1.9 What is measurement? ...25
1.10 What is performance measurement? ...29
1.11 What is performance management? ...29
1.12 What are the key measures of performance management? ...31
1.13 Summary ...39
CHAPTER 2 PERFORMANCE MANAGEMENT FRAMEWORKS AND THE ISBSG REPOSITORY ...40
2.1 Performance Management Frameworks in software engineering ...41
2.1.1 McCall model ... 42
2.1.2 Boehm model ... 46
2.1.3 ISO 9126 quality model ... 48
2.1.4 Donaldson and Siegel model ... 51
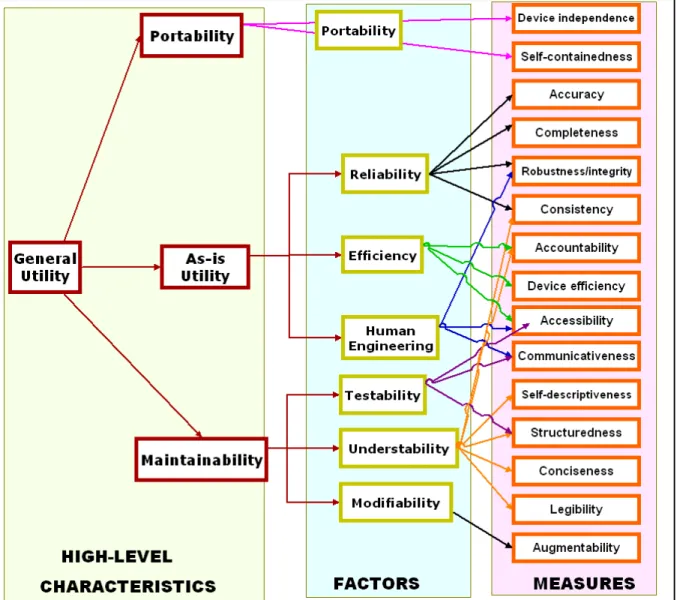
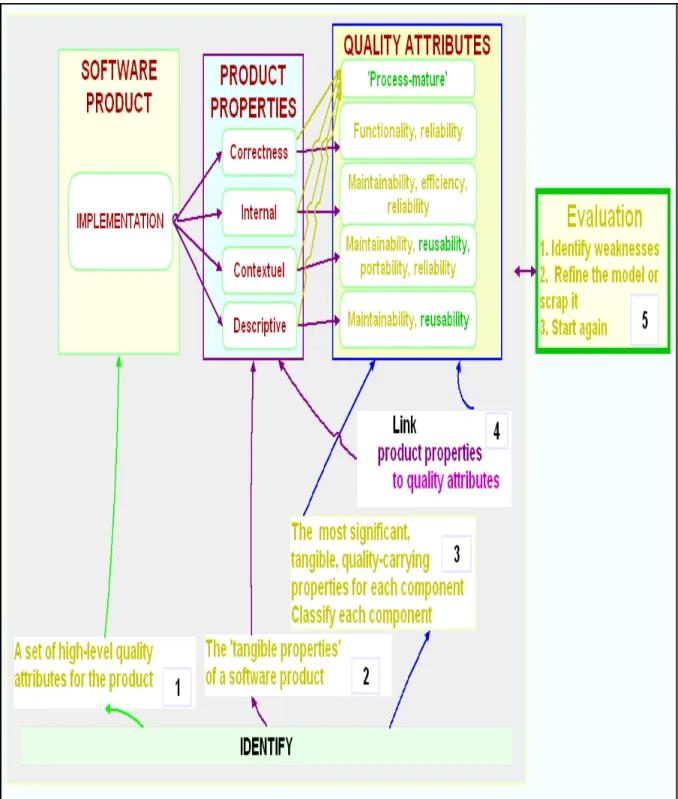
2.1.5 Dromey model ... 54
2.1.6 An Integrative Framework for IS quality management ... 57
2.1.7 The QEST & Lime Models ... 58
2.2 Generic Performance Management Frameworks ...65
2.2.1 Balanced Scorecard (BSC) ... 66
2.2.2 The Performance Prism ... 69
2.2.3 EFQM Excellence Model ... 71
2.2.4 Intangible Assets Monitor (IAM) ... 74
2.2.5 The Baldrige Framework ... 78
2.2.6 Skandia Navigator ... 81
2.2.7 Integrated Performance Measurement System ... 84
2.2.8 Sink and Tuttle model ... 88
2.3 Comparison of models ...91
2.4 International Software Benchmarking Standards Group data repository ...95
2.5 The QEST prototype ...96
CHAPTER 3 BUILDING A CONCEPTUAL PERFORMANCE MANAGEMENT
FRAMEWORK ...104
3.1 Designing a conceptual framework to manage multidimensional performance in software engineering ...108
3.1.1 The design of a PMF ... 108
3.1.1.1 Preparation ... 109
3.1.1.2 Guiding elements ... 109
3.1.1.3 Definition of the objectives ... 110
3.1.1.4 Selection and weighting of viewpoints and indicators ... 117
3.1.1.5 Assignment of threshold values ... 122
3.1.2 Implementation of measures ... 124
3.1.3 Use of the framework ... 128
3.1.4 Performance improvement ... 135
3.1.5 Conclusion ... 137
CHAPTER 4 THE MULTIPERF PROTOTYPE ...139
4.1 Technology selection ...142
4.2 The design of MultiPERF ...142
4.2.1 Setting up a performance management team and determination of guiding elements ... 145
4.2.2 Definition of the objectives ... 146
4.2.3 Selection and weighting of measures and viewpoints ... 147
4.2.4 Assignment of threshold values ... 150
4.3 Implementation of measures ...153
4.3.1 Internal data ... 153
4.3.2 External data ... 153
4.3.3 Calculate performance data ... 154
4.4 Analysis and use of performance data ...158
4.4.1 Performance tree and use of color ... 159
4.4.2 Basic reports and graphical representations ... 165
4.4.2.1 Other available features ... 174
4.4.3 Building the pyramid ... 174
4.4.3.1 Using a sphere to represent the APV% for a viewpoint ... 176
4.4.3.2 Using a cube to represent the OP_APV and OP_TPV of a viewpoint... 178
4.4.3.3 Using a line to represent TPV% ... 179
4.4.3.4 OP_APV and OP_TPV are indicated by a cone ... 180
4.4.3.5 Using a line to represent APV% and TPV% ... 181
4.4.3.6 Volume concept to represent organizational performance ... 183
4.5 Using the ISBSG repository to set up performance targets ...193
4.5.1 Setting performance targets ... 195
4.5.2 Setting the organizational performance level ... 197
4.5.3 Selecting the dataset ... 199
4.5.4 Statistical analysis ... 200
4.6 Conclusion ...210
CONCLUSION ...212
ANNEX I RESEARCH PHASES AND SUMMARY OF THE LIMITATIONS ...220
ANNEX II ANSWERS TO RESEARCH QUESTIONS ...221
LIST OF TABLES
Table 2.1 Template for identifying and analyzing performance models ...42
Table 2.2 Relationship of criteria to software quality factors ...45
Table 2.3 Summary – McCall model ...45
Table 2.4 Summary – Boehm model ...47
Table 2.5 Summary – ISO 9126 model ...50
Table 2.6 Summary – Donaldson and Siegel model ...54
Table 2.7 Summary – Dromey model ...56
Table 2.8 Summary – Integrative Framework for IS Quality Management ...57
Table 2.9 Summary – QEST model ...64
Table 2.10 Summary – Balanced Scorecard ...68
Table 2.11 Summary –Performance Prism ...70
Table 2.12 Viewpoints (Criteria) for EFQM ...72
Table 2.13 Summary –EFQM model ...73
Table 2.14 Table of measures ...76
Table 2.15 Summary – IAM model ...77
Table 2.16 Summary – Baldrige model ...80
Table 2.17 Summary – Skandia model ...83
Table 2.18 Summary – IPMS model...85
Table 2.19 Summary – Sink and Tuttle model ...91
Table 2.20 Origin of the model – Year and country/region ...92
Table 2.21 Comparison of models ...93
Table 2.23 Summary – QEST prototype ...101
Table 3.1 Guiding elements ...109
Table 3.2 Overall organizational performance ...127
Table 3.3 Performance table – Summary of TPV vs. APV ...127
Table 3.4 Horizontal view ...129
Table 3.5 Visualizing performance: One- and two-dimensional graphs ...133
Table 3.6 Visualizing performance: Multidimensional graphs ...134
Table 4.1 Example of how the APV% and APV(Coef) will be calculated ...152
Table 4.2 Example of how the performance gap will be calculated ...156
Table 4.3 Color legend of spheres ...177
Table 4.4 Target values per iteration for PDR, Size, Duration (Months), ...196
Table 4.5 Target values per project for PDR, Size, Duration (Months), ...197
LIST OF FIGURES
Page
Figure 0.1 Research phases and thesis outline. ...13
Figure 1.1 Thesis – literature review – Phase 1. ...17
Figure 1.2 Key concepts – related to the thesis title. ...18
Figure 1.3 Measurement foundations. ...26
Figure 1.4 Effectiveness ...32
Figure 1.5 Efficiency. ...33
Figure 1.6 Profitability ...34
Figure 1.7 Quality. ...35
Figure 1.8 Six quality checkpoints. ...36
Figure 1.9 Productivity. ...37
Figure 1.10 Quality of work life. ...38
Figure 1.11 Innovation. ...39
Figure 2.1 Thesis – literature review – Phase 1. ...41
Figure 2.2 McCall model. ...43
Figure 2.3 The Boehm’s quality model. ...47
Figure 2.4 Quality in use model. ...49
Figure 2.5 ISO 9126 – External and internal quality. ...50
Figure 2.6 Visualization – the Kiviat graph with 8 dimensions (viewpoints). ...52
Figure 2.7 The vector length concept for combining multiple dimensions. ...53
Figure 2.8 Linking product properties to quality attributes. ...55
Figure 2.9 QEST model. ...60
Figure 2.11 Representing performance using the geometrical concept of area. ...62
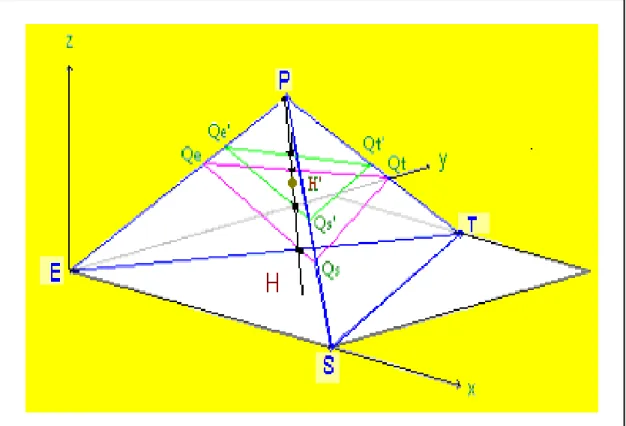
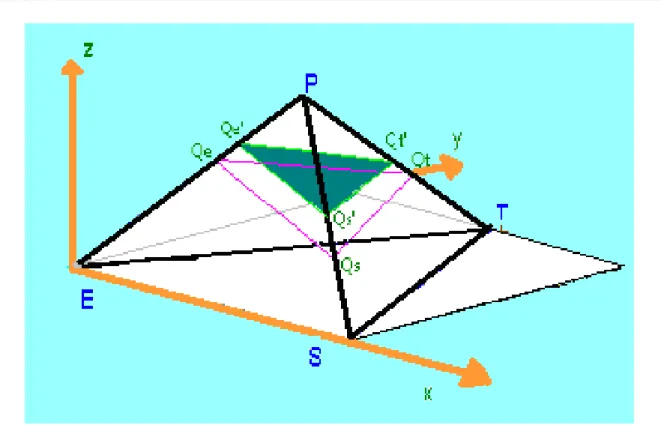
Figure 2.12 Representing performance using the geometrical concept of volume. ...63
Figure 2.13 Relationship between the four viewpoints in BSC. ...67
Figure 2.14 The five dimensions of the performance prism. ...70
Figure 2.15 EFQM model ...73
Figure 2.16 Intangible assets monitor ...75
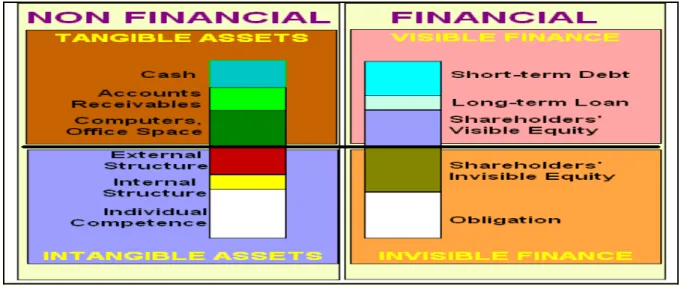
Figure 2.17 The balance sheet of a knowledge organization ...76
Figure 2.18 Baldrige model. ...79
Figure 2.19 Skandia framework. ...82
Figure 2.20 Skandia knowledge tree. ...83
Figure 2.21 IPMS with examples of measures ...87
Figure 2.22 Performance improvement planning process. ...89
Figure 2.23 Sink and Tuttle model – Interrelationships between viewpoints. ...90
Figure 2.24 Selected nodes. ...97
Figure 2.25 Data collection – weighting viewpoint. ...98
Figure 2.26 Data collection – minimum and maximum. ...99
Figure 2.27 Volume visualization ...100
Figure 3.1 Thesis – chapter 3. ...105
Figure 3.2 Steps in the design of a PMF. ...107
Figure 3.3 Design of a PMF. ...108
Figure 3.4 Design tree of the framework. ...112
Figure 3.5 Measurement Information Model (MIM). ...115
Figure 3.6 GQM Tree. ...116
Figure 3.8 Weighting of indicators and viewpoints. ...121
Figure 3.9 Overall performance: left side-equal weights, right side – different weights. ...122
Figure 3.10 The level of performance. ...123
Figure 3.11 Designing – Data collection and calculation. ...124
Figure 3.12 Calculation – Theory. ...126
Figure 3.13 Analysis in software measurement. ...131
Figure 3.14 Performance improvement. ...135
Figure 3.15 Framework summary. ...138
Figure 4.1 Thesis Map – chapter 4 – Development of a prototype. ...139
Figure 4.2 MultiPERF – main figure. ...141
Figure 4.3 Overview of the step: Plan - The design in MultiPERF. ...144
Figure 4.4 Performance project identification and guiding elements. ...145
Figure 4.5 Definition of objectives. ...146
Figure 4.6 Select viewpoints. ...147
Figure 4.7 Selection and weighting of indicators and measures. ...149
Figure 4.8 Weighting of measures and assignment of threshold values. ...150
Figure 4.9 MultiPERF performance grid for Table 4.1. ...152
Figure 4.10 Implementation of measures. ...154
Figure 4.11 MultiPERF performance grid for Table 4.2. ...156
Figure 4.12 Calculating APV. ...158
Figure 4.13 MultiPERF performance tree - Snapshot of a few scenarios. ...160
Figure 4.14 MultiPERF performance tree. ...161
Figure 4.15 Use of colors in a MultiPERF performance tree. ...163
Figure 4.17 Performance – Activity level. ...165
Figure 4.18 Sample basic report generated by MultiPERF. ...165
Figure 4.19 Importance of each measure within the Functionality Indicator. ...166
Figure 4.20 Importance of each indicator within the Economic viewpoint. ...167
Figure 4.21 Histogram of indicator weights within viewpoints. ...168
Figure 4.22 Area block of indicator weights within viewpoints. ...169
Figure 4.23 Histogram of viewpoints weights within indicators. ...170
Figure 4.24 Line graph (left side) and histogram (right side) ...171
Figure 4.25 Kiviat graph comparing APV% with TPV% for each viewpoint. ...171
Figure 4.26 Evolution of organizational performance for each viewpoint. ...172
Figure 4.27 Three-dimensional graphs. ...173
Figure 4.28 Comparing APV% and TPV%. ...174
Figure 4.29 Organizational performance using a pyramidal representation. ...176
Figure 4.30 Representation of the APV% using a sphere for each viewpoint. ...177
Figure 4.31 OP_APV and OP_TPV represented using a cube. ...179
Figure 4.32 Performance – an aqua line indicating the next TPV%. ...180
Figure 4.33 OP_APV : Outstanding (left), and unacceptable (right). ...181
Figure 4.34 Performance – white line delimiting the TPV. ...182
Figure 4.35 Line delimiting the APV (grey line) and TPV (white line). ...183
Figure 4.36 How to interpret the color scheme of volumes in the pyramid. ...184
Figure 4.37 Unacceptable OP_APV: the spheres are black and the volume is in red. ...186
Figure 4.38 Volume concept – Example using ten viewpoints. ...187
Figure 4.39 Volume concept – Example using ten viewpoints – ten tetrahedrons. ...188
Figure 4.41 Using the ISBSG repository to set performance targets. ...194
Figure 4.42 Target performance levels for benchmarking purposes. ...198
Figure 4.43 Selecting a dataset from the ISBSG repository. ...200
Figure 4.44 Productivity model – Regression analysis (ISBSG). ...203
Figure 4.45 Estimating size, effort, productivity, and duration. ...204
Figure 4.46 Statistical analysis and graphical models. ...205
Figure 4.47 Benchmarking – Performance level representation. ...207
Figure 4.48 Performance benchmarking using the TreeMap concept. ...208
Figure 4.49 Target objectives, as defined in Table 4.5. ...209
Figure 4.50 Target objectives, as defined in Table 4.5 vs. an ISBSG dataset. ...210
LIST OF ACRONYMS
APV Actual Performance Value
APV% Actual Performance Value after normalization
APV(coef) Actual Performance Value after taking into account the weight coefficient
BSC Balanced Scorecard
EFQM European Foundation for Quality Management FCM Factor-Criteria-Metric
FP Function Point
GQM Goal-Question-Metric
GE Guiding Elements
IAM Intangible Asset Monitor
IEEE Institute of Electrical and Electronics Engineers IFPUG International Function Point Users Group IPMS Integrated Performance Measurement System ISO International Organization for Standardization
ISBSG International Software Benchmarking Standards Group
IC Intellectual Capital
IS Information Systems
IT Information Technology
KA Knowledge Area
QEST Quality Economic Social Technical MIM Measurement Information Model MSEK Millions of Swedish Krona
OP_APV Organizational Actual Performance OP_TPV Organizational Target Performance PDR Project Delivery Rate
PMI Project Management Institute PSM Practical Software Measurement PMF Performance Management Framework
SEI Software Engineering Institute SLC Software Life Cycle
SWEBOK Software Engineering Body of Knowledge TPV Target Performance Value
TPV% Target Performance Value after normalization
INTRODUCTION
Purpose of this thesis
The purpose of this thesis is to develop a software prototype for multidimensional performance management in software engineering. The prototype will be primarily based on a geometrical visualization approach adapted from a software multidimensional performance measurement model titled QEST (Quality factor + Economic, Social, and Technical) (Abran and Buglione, 2003; Buglione and Abran, 1999), the Sink and Tuttle viewpoints of organizational performance (Sink and Tuttle, 1989), the ISO 9126 standard approach to classifying software quality characteristics and sub-characteristics (ISO/IEC, 2001), and the International Software Benchmarking Standards Group (ISBSG) repository of software project data (ISBSG, 2008b).
Performance management
In recent decades, performance management has become more and more important for organizations and managers who are always looking for better solutions to manage performance in their organization. Any activity of an organization may influence performance, and organizations need to measure and manage organizational performance in order to plan, monitor, control, and improve their productivity, their efficiency, their effectiveness, the quality of their products, and their ability to deliver them on time.
A successful organization must not only measure performance, but also manage it, and the manner in which performance is managed is becoming an increasingly important research area (Neely, 2005; Neely et al., 1996).
Performance management in the context of software engineering
take into account the specifics of software development and maintenance. According to The Standish Group’s 1995 CHAOS study, only 9% of American IT projects in large organizations were successful, and the two main reasons why these projects failed are the lack of user involvement and the lack of top management support (The Standish Group, 1995). In 2009, of the projects (58% US-based and 24% European) costing more than $750,000 and less than $3 million, only 19% were successful, and “projects over 10 million only have a 2% chance of coming in on time and on budget” (The Standish Group, 2009). Note, however, that an incomplete description of how they conducted this study makes it difficult to evaluate the validity of the research, even though it is very widely cited in the scientific and industrial literature (Eveleens and Verhoef, 2010; Glass, 2005; Jørgensen and Moløkken-Østvold, 2006).
Nevertheless, even in the case of the most optimistic failure rates, which would be 10-15% according to (Glass, 2005), these project failures still represent a colossal amount of money. For example, spending in the U.S. alone on information technology, which represents about 50% of their total corporate capital spending, was estimated at roughly $2.5 trillion for 2005 (Knowledge@Wharton, 2005).
According to Glass, ‘success’ and ‘failure’ are tricky words, because “how do you categorize a project that is functionally brilliant but misses its cost or schedule targets by 10 percent?” (Glass, 2005). According to Donaldson and Siegel, it is difficult to say what a ‘good’ software product or development process is, because it depends on your point of view (Donaldson and Siegel, 2001, p. 9). The main criteria for determining a successful software development project are: was it delivered on time? can it do what it is supposed to do? and, finally, was it delivered for the agreed cost (Donaldson and Siegel, 2001, p. 2; Ewusi-Mensah, 2003).
Unfortunately, the software development industry has long suffered from projects being late, over budget, and lacking in agreed features, owing to technical or time limitations (DeMarco, 1982, pp. 1-2; Ewusi-Mensah, 2003; Taylor, 2000; The Standish Group, 1995).
The management of software development projects in general, and of their performance in particular, are not easy, primarily for the following reasons:
• There is no unique way to arrive at results in software development: the organization “must set up a way of doing business that allows for adaptation to the situation at hand…no ‘way’ of doing business can anticipate all contingencies” (Donaldson and Siegel, 2001, p. 5).
• Software is often built using an iterative process, rather than by following a predefined sequence of closed tasks. In a more traditional engineering field, such as civil engineering, we would build the first floor of an apartment building, and then, when that is finished, build the next floor, and so on. This is often not the case for software development (Vliet, 2008, pp. 8-9).
• There is no simple explanation for failure in software development projects, and the factors that contribute to failure are multidimensional (Ewusi-Mensah, 2003).
• Creativity and discipline are necessary for software development, and these are difficult to combine. Discipline is necessary for achieving predictability, while creativity is a must if we wish to produce innovative results (Vliet, 2008, p. 7). According to Vliet, “discipline is one of the keys to the successful completion of a software development project” (Vliet, 2008, p. 7).
• There are few underlying theories in software engineering, and its fundamental principles are not well established, compared to those of more traditional fields of engineering (Bourque et al., 2002; Meridji, 2010). We must always remember that computing in general is only roughly sixty years old, and that the word ‘software’ was only coined in 1958 (Shapiro, 2000). In terms of software engineering specifically, the Guide to the Software Engineering Body of Knowledge has only been in existence now for six years (Abran et al., 2004).
• The degree of novelty is extremely high in software engineering: we are faced with an extremely rapid rate of change in the underlying technology. “Software development involves novelty, which introduces uncertainty. It can be argued that there is a higher degree of novelty in software than in other forms engineering.” (Laplante, 2004, p. 167).
What does ‘multidimensional’ mean in the context of performance management?
Managing performance is challenging because of its multidimensional nature, its many levels of granularity, and the fact that organizations differ so widely.
Historically, performance measurement has always been focused on economical or financial concerns, meaning that performance management systems “were uni-dimensional – focused purely on financial measures.” (Bourne et al., 2003).
According to Simons (Simons, 1995, p. 13), performance measurements by themselves are obsolete, because they are backward-looking and not forward-looking. He also believes that organizations should be analyzed multidimensionally, because “…organizations are also sets of relationships among self-interested participants, each of whom is balancing personal well-being and organizational needs.”
Performance measurement “is complicated by its multi-dimensional nature...managers need to resolve issues such as: conflicts between performance measures; the appropriate balance of internal and external measures; the linking of measures and strategy; etc.”(Neely et al., 1996).
Every organization has their viewpoints (dimensions) from which they wish to evaluate the performance of their organization. The most common and widely analyzed viewpoint in software engineering has always been the economic one (managers’ viewpoint), but the social or organizational viewpoint (users’ viewpoint) and the technical or socio-technical viewpoint (for example, the software engineers’ viewpoint) also have an important impact on performance (Buglione and Abran, 1999; Ewusi-Mensah, 2003):
• The socio-organizational viewpoint can be characterized as “where the organizational component describes or deals with the set of organizational interests the artifact must serve” (Ewusi-Mensah, 2003);
• The socio-technical viewpoint mainly concerns the requirements of the software and the necessary supporting documents;
• The economic viewpoint reflects the cost of creating the software artifact.
Initially, performance measurement focused only on financial measures, but organizations also need non financial measures in order to better align objectives and strategies throughout all levels. Non financial measures, however, are not easy to quantify.
The main objective of a Performance Management Framework (PMF) is to help an organization move in the desired direction. Performance management is a complex task and cannot be managed with only a single indicator (Sink and Tuttle, 1989, p. 59). Many multidimensional PMFs have been developed and proposed in the literature to help organizations manage their organizational performance (Neely, 2005).
For example, the concept of the Tableau de bord has been used in the francophone world to manage performance for almost 80 years now. Briefly, this is a dashboard developed for top management to monitor the operations of an organization. However, there is no standard
Tableau de bord, and almost every author proposes a different one. It usually includes
financial and non financial measures; however there is little linkage with the strategy of an organization (Balantzian, 2005).
In the last three decades or so, proposals for performance frameworks have grown in number. Among the better known frameworks are the Balanced Scorecard (Kaplan and Norton, 1992; 1993; 1996a; 1996b), the Performance PRISM (Neely and Adams, 2003; Neely et al., 2002), the EFQM (European Foundation for Quality Management) Excellence Model (European Foundation for Quality Management, 2008), and the Baldrige Criteria for Performance Excellence (Baldrige, 2010; Srivivatanakul and Kleiner, 1996; Tudahl and Lindner, 1994).
The Balanced Scorecard (BSC), originally published in 1992, is perhaps the best-known PMF and the one most often used in the U.S. It identifies four viewpoints from which to
manage organizational performance: financial, internal process, external customer, and innovation and learning (Kaplan and Norton, 1992; 1993; 1996a; 1996b).
According to (Kaplan and Norton, 1992), an important advantage of using the BSC is that it helps managers focus on strategy and vision to manage organizational performance. The use of these four viewpoints, which combine financial and non financial measures, can “help managers transcend traditional notions about functional barriers and ultimately lead to improved decision making and problem solving.”
According to Marr and Neely (Marr and Neely, 2003, p. 7), more than 50% of the largest U.S. firms had adopted the BSC by the end of 2000, and 43% of the companies that were not using it were planning to do so. However, it cannot be applied directly to any organization, because they are all different and require particular viewpoints and measures associated with their own objectives (Kaplan and Norton, 1993). The Balanced IT Scorecard (BITS) (Reo et
al., 1999)is a specific version of the four original viewpoints for the information technology industry, with the addition of a fifth, the ‘people’ viewpoint.
A PMF can be very complex, primarily because of its multidimensionality, and no single approach is suitable for all organizations. There is no ‘one size fits all’ PMF. However, there seems to be a consensus in the literature that the objectives of a PMF amount to more than simply monitoring measures. In addition, performance has multiple perspectives or viewpoints. These viewpoints and measures also need to be combined in some way into a single, overall performance value for management purposes.
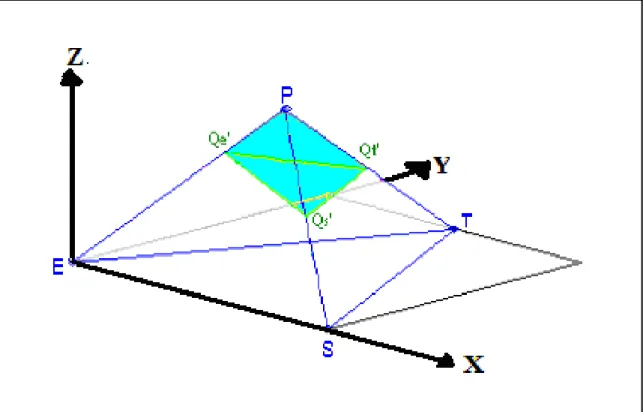
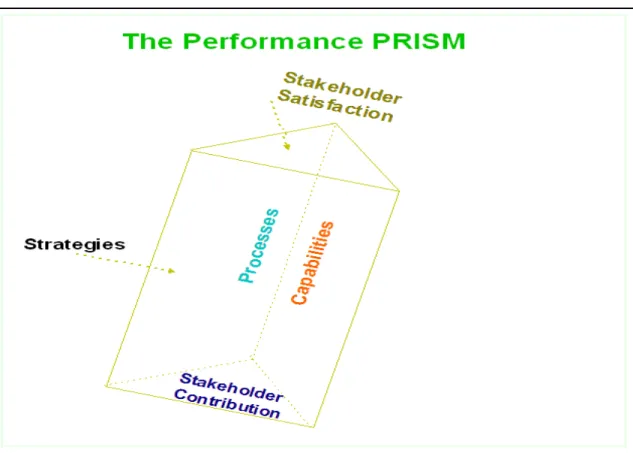
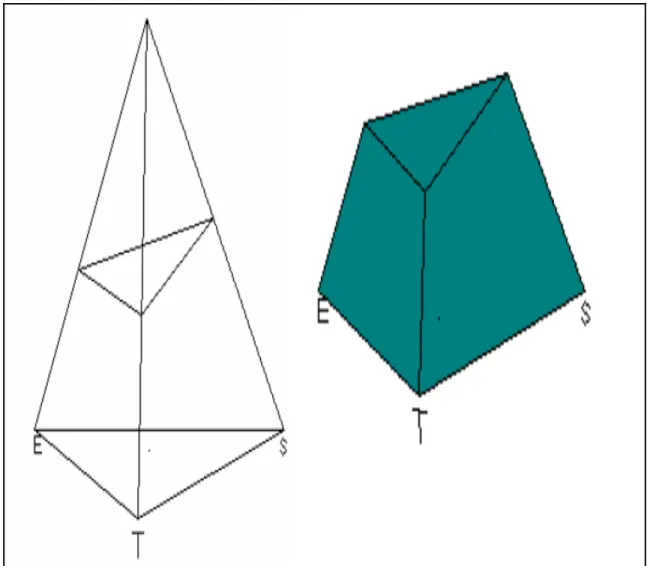
The Performance Prism takes into consideration the complexity of performance management by using five interlinked points of view and representing them in the geometrical form of a prism with five facets (Neely and Adams, 2003; 2005b). The QEST model (Abran and Buglione, 2003) proposes a performance value that is, essentially, a normalized measurement value, and combines the various views of performance measurement. The geometrical representation adopted by QEST-3D is a regular tetrahedron with a regular triangular base
and equal sides (a pyramid), which is suitable for three viewpoints only. However, where there are more than three viewpoints, no visual representation is possible. The QEST model can also be used for consolidating BSCs (Abran and Buglione, 2003).
According to Kaplan and Norton, “managers recognize the impact that measures have on performance. But they rarely think of measurement as an essential part of their strategy” (Kaplan and Norton, 1993). Some keys to better management of organizational performance are a clear definition of objectives and paying attention to the selection and weighting of measures and viewpoints.
From one-dimensional to multidimensional performance models
The economic viewpoint has always been the main focus in evaluating organizational performance. The best-known method for measuring performance at the beginning of 20th century was probably the DuPont Formula, which originated before 1920: performance measurement is expressed by the relationships between five economic indicators (operating profit margin, asset turnover, financial leverage, cost of debt, and tax retention rate), each resulting from calculations based on two ratios: return on investment (ROI) and return on equity (ROE) (12MANAGE, 2008; Posey, 2006; Ramesh, 2000, p. 66). The ROI is obtained by dividing net profit by total assets. The ROE ratio, often called the DuPont Formula, has the following equation:
Equity Assets * Assets Sales * Sales EBIT * EBIT profit Pretax * profit Pretax profit Net Equity profit Net = = ROE where:
Net profit = Profit after taxes; Equity = Shareholders' equity;
EBIT = Earnings before interest and taxes; Sales = Net sales.
One of the problems with performance measurement initially was that too much importance was given to the economic viewpoint (Bourne et al., 2003), as clearly exemplified by the Dupont formula.
Managers “have tracked quality, market share, and other non-financial measures for years. Tracking these measures is one thing. But giving them equal (or even greater) status in determining strategy, promotions, bonuses, and other rewards is another” (Eccles, 1991). Performance management based only on an accounting viewpoint “often fails to support investments in new technologies and markets that are essential for successful performance in global markets” (Eccles, 1991).
PMFs have been developed to achieve a more balanced view between internal and external viewpoints, and between economic and non economic measures and indicators. Kaplan and Norton identified the weakness of early models, which was that they were one-dimensional, and added three other dimensions that are relatively easy to understand and can be applied to any organization (Kaplan and Norton, 1992). Their BSC balances the economic viewpoint by adding those three new viewpoints, which are outside the economic or financial sphere (Kaplan and Norton, 1992; 1993; 1996a; 1996b)
According to Kaplan and Norton, there are organizations using fewer than four viewpoints and others that need additional viewpoints. They find no theoretical support for the statement that four viewpoints are necessary and sufficient (Kaplan and Norton, 1996a, p. 34). Organizations vary considerably with regard to the wide array of dimensions that influence their performance. Generally, however, performance is multidimensional, and there is a need to measure all the viewpoints that have an important impact on organizational success.
Visualization and consolidation techniques are necessary for managing multidimensional performance data in the software engineering field
An organization is multidimensional, and overall performance should be managed with the support of appropriate graphical tools that are able to represent this multidimensionality. Analyzing multidimensional organizational performance, and exploring performance data, can be difficult without proper visualization tools or approaches (Lawton, 2009) .
Having the right information at the right time is crucial to making the right decisions, and so there is growing interest in data visualization in all disciplines, including engineering and management (Stroian et al., 2006).
One difficulty with current performance models is to represent many possible viewpoints quantitatively and in a consolidated manner, while at the same time keeping track of the values of the individual dimensions of performance (Abran and Buglione, 2003; Bourque et
al., 2006; Stroian et al., 2006). This difficulty is compounded by the fact that the underlying
quantitative data are of high dimensionality, which means that the usual two- and three-dimensional approaches to visualization are not sufficient for representing such models.
QEST model and prototype
The QEST (Quality factor + Economic, Social, and Technical dimensions) model represents performance in a consolidated manner and is capable of handling independent sets of viewpoints (dimensions) without predefined ratios and weights. This model produces a single performance value, which is important to good decision making because it integrates individual and linked measurements into a single performance indicator, making it possible to see the ‘big picture’ and not always getting caught up in the details.
It adopts a geometrical approach (a regular tetrahedron representation is the basis for this 3D-model) (Abran and Buglione, 2003) to representing performance as is shown in Figure 2.9. A tetrahedron is composed of four triangular faces, three of which meet at a single point (each vertex represents a viewpoint), and a regular tetrahedron is one consisting of four regular
triangles (triangular pyramid). The concepts of distance, area, and volume are used to represent performance.
At the beginning of this research project, a prototype was available to support the QEST approach; however, this prototype (Abran et al., 2003a):
• is limited with regard to software product quality, as its measures are restricted to those proposed in the context of the ISO 9126 quality characteristics and sub-characteristics (ISO/IEC, 2001);
• is constrained to three predefined viewpoints: social, technical, and economic; • does not include historical data and has no mechanisms for handling such data; • does not include a repository for persistent data storage;
• is limited to a pyramidal representation of data.
ISO 9126
The International Organization for Standardization introduced a standard named ISO/IEC
9126 (1991) to interpret and measure software quality (ISO/IEC, 2001). This standard defines a software quality model using:
• three viewpoints, defined as follows: quality in use, external quality, and internal quality; • six characteristics: functionality, system reliability, usability, efficiency, maintainability,
and portability. Two or more sub-characteristics are associated with each characteristic.
Sink and Tuttle model
The Sink and Tuttle model can be applied to improve organizational performance. It provides operational definitions of seven performance criteria: effectiveness, efficiency, quality, productivity, quality of work life, innovation, and profitability (Sink, 1985; Sink and Tuttle, 1989). These authors insist on the importance of measurement system design in improving organizational performance and achieving an accepted vision regarding performance improvement. They claim that organizations have the responsibility of getting
the job done on time, within quality specifications, and with the right amount of resources, and to continuously improve individual, group, organizational, and performance systems.
The ISBSG repository as a benchmarking and performance tool specific to software engineering
Benchmarking is used to compare organizational performance results with those of other organizations. The International Software Benchmarking Standards Group (ISBSG), a not-for-profit organization established in 1994, has established and maintains a database of software project data that can be used by software project managers for various purposes, including estimation and benchmarking (ISBSG, 2008b).
ISBSG offers an interesting avenue for managing performance quantitatively:
• There are more than 100 nominative and quantitative variables included in the repository; • The ISBSG Repository, release 11 (R11), made available in 2009, contains data on 5,000 projects. Data from a large number and a wide variety of projects are therefore available; • The repository can be used as a valuable alternative for organizations without their own
performance database. If they do have their own performance database, then the ISBSG repository can be used as an external supplement to that internal one.
Problem statement of this thesis
The purpose of this thesis is to develop a prototype to model multidimensional performance in software engineering management.
The generic problem addressed is how to better manage performance in software engineering when many dimensions or viewpoints must be taken into account concurrently:
• The PMFs currently proposed do not meet the analytical requirements of software engineering management when various viewpoints must be taken into account concurrently;
• There is a lack of visualization techniques and analysis tools when multi-dimensionality must be taken into account;
• There already exist a significant number of models in software engineering to manage quality, but there are few PMFs available that are specific to software engineering (Bourque et al., 2006; Stroian et al., 2006);
• There is currently no satisfactory tool available to meet the analytical requirements of software engineering management when various viewpoints must be taken into account individually, but at the same time concurrently.
Research questions
From the above problem statements, the following research questions have been formulated:
• Question 1: A. What are the strengths and weaknesses of the multidimensional PMFs currently available in software engineering, and in management more generally?
B. Which of the multidimensional PMFs could be used for performance management in software engineering?
• Question 2: What are the strengths and weaknesses of the QEST prototype?
• Question 3: How can we build a prototype for multidimensional performance management in software engineering to represent, graphically and in a consolidated manner, the many possible performance viewpoints, while at the same time keep track of the values of the individual performance dimensions?
Research objectives
The main objective of the research is to develop a prototype for multidimensional performance management in software engineering which can represent, quantitatively and in consolidated manner, the many possible performance viewpoints, while at the same time
keeping track of the values of the individual performance dimensions (Bourque et al., 2006; Stroian et al., 2006).
Research phases and thesis outline
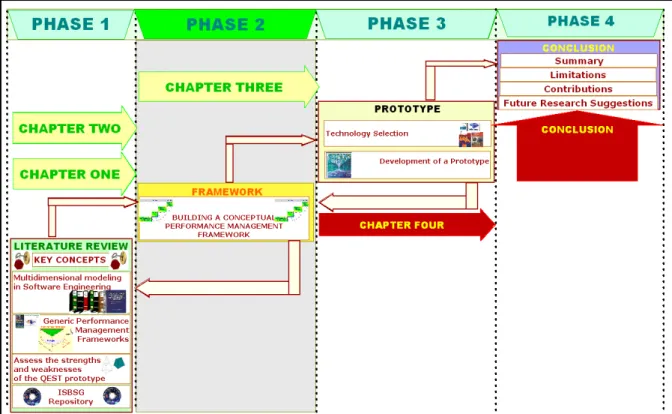
The research phases leading to this thesis are as shown in Figure 0.1. In the first phase, the main or key concepts of this thesis are defined and explained, the
strengths and weaknesses of the models and frameworks found in the literature are analyzed, the repository of the International Software Benchmarking Standard Group (ISBSG) is presented, and, finally, the QEST prototype currently available is analyzed for its strengths and weaknesses. The main purpose of this phase is to analyze the models and frameworks and to identify candidate concepts to be included in the conceptual framework.
In the second phase, a conceptual framework for managing multidimensional performance in software engineering is proposed. This conceptual framework is composed of four main steps:
• design: decide what performance to measure and how to measure it; • implementation of measures: collect the measures;
• use analysis and visualization techniques; • improve performance.
An effective PMF incorporates a multidimensional view of performance, provides feedback, and enables performance improvement. This conceptual framework is a major input to the prototype discussed next.
The third phase focuses on the primary goal of the dissertation, which is to develop a prototype for multidimensional performance management in software engineering. The technology is selected and a prototype called MultiPERF is developed to manage multidimensional performance in software engineering.
Finally, a summary of the research, the contribution and limitations of the research, and future research suggestions are presented in the fourth and final phase.
The overall structure of the thesis is illustrated in the lower part of Figure 0.1. The dissertation is structured in five chapters.
The results of Phase 1 are discussed in chapters 1 and 2. Chapter 1 defines the important terms or key concepts used in this thesis: software, performance, management, model, multidimensional, development, software, engineering, and prototype, and the various associations of these terms.
Chapter 2 includes:
• a review of the generic multidimensional performance models that are available to management;
• a review of the repository of the International Software Benchmarking Standard Group (ISBSG);
• an analysis of the strengths and weaknesses of the QEST prototype.
Chapter 3 describes a conceptual framework for managing performance in software engineering. It comprises four phases:
• Phase 1: design – decide what to measure and how to measure it; • Phase 2: implementation – collect the measures;
• Phase 3: use of the framework – visualization, analysis, and interpretation of the results; • Phase 4: performance improvement – provide feedback and facilitate benchmarking.
Chapter 4 presents and discusses the prototype that was developed in this thesis and which is based on the conceptual framework discussed in chapter 3:
• the features of the prototype;
• a transparent simulation approach to fixing appropriate performance targets using the ISBSG repository;
• a discussion of how the prototype enables or supports the framework proposed in the previous chapter;
• relation of the results to the research questions.
Conclusions summarizes the main results of the thesis, discusses their originality and their limitations and how they contribute to the advancement of knowledge, and offers suggestions for future work within this research theme.
Contributions of the research
Framework: the proposal of a conceptual framework for managing organizational performance in the context of software engineering;
Prototype: the development of a prototype for managing performance in the context of software engineering which:
o supports the conceptual framework mentioned above;
o adopts a multidimensional geometrical approach adapted from the QEST model to facilitate the management of performance when many dimensions or viewpoints must be taken into account individually and concurrently (Abran and Buglione, 2003; Buglione and Abran, 1999).
o facilitates the use of the ISO 9126 quality standard (ISO/IEC, 2001) in a performance management context;
o adopts the Sink and Tuttle viewpoints of organizational performance (Sink, 1985; Sink and Tuttle, 1989);
o incorporates a repository of software project data known as the ISBSG repository (ISBSG, 2008b).
These contributions have been published by/accepted for the following conferences:
• Stroian, Vasile, Pierre Bourque, and Alain Abran. 2006. “Visualization – a key concept for multidimensional performance modeling in software engineering management.” IEEE-TTTC International Conference on Automation, Quality & Testing, Robotics AQTR 2006 (THETA 15), (May 25-28, 2006), Cluj-Romania, p. 6.
• Bourque, Pierre, Vasile Stroian, and Alain Abran. 2006. “Proposed concepts for a tool for multidimensional performance modeling in software engineering management.” IEEE-IES International Symposium on Industrial Electronics (ISIE), (July 9-13, 2006), Montreal-Canada, p. 6.
CHAPTER 1
PRESENTATION OF KEY CONCEPTS
As shown in Figure 1.1 in the Phase 1 column, this chapter and the following one present a review of the literature on the multidimensional PMFs. The objective of chapter 1 is to explain the key concepts of this research, as shown in Figure 1.2. Chapter 2 will present and analyze the multidimensional PMFs that are currently available in software engineering specifically, and in management in general, assess the strengths and weaknesses of the QEST prototype, and present the ISBSG repository.
Figure 1.1 Thesis – literature review – Phase 1.
The key concepts discussed in this chapter all revolve around the title of the thesis. This is why the top box (green background color) in Figure 1.2 contains the title of the thesis. The
second-level boxes contain words extracted from the title: development, prototype, multidimensional, performance, software, engineering, and management. Each box has a uniquely colored arrow to link the box with the next, or third, level. The bottom level boxes (white background color) indicate the sections in this chapter where these key concepts are defined and explained.
Figure 1.2 Key concepts – related to the thesis title.
1.1 What is a prototype?
In Webster’s Dictionary (Merriam-Webster, 2005) a prototype is defined as ‘an original model on which something is patterned.’ According to McGraw-Hill's Encyclopedia of Science & Technology, a prototype is defined as ‘a first or original model of hardware or software.’ (McGraw-Hill's, 2008).
Experimental prototyping “is used for the investigation of alternative approaches to a solution”, and exploratory prototyping “is used to assist in the formulation of a problem or
issue” (McGraw-Hill's, 2008). The prototype developed in this thesis belongs much more in the exploratory category than in the experimental category.
One advantage of using prototyping is “the ability to rapidly construct a product that is representative of the final product at relatively low cost and effort” (McGraw-Hill's, 2008). But, “a prototype is generally a functionally immature model of a proposed product that is built to explore requirements, investigate alternative approaches, or demonstrate model feasibility. The model may or may not evolve into a mature, functionally useful product” (McGraw-Hill's, 2008).
In the context of software engineering, the Guide to the Software Engineering Body of Knowledge (SWEBOK) (Abran et al., 2004) defines a prototype as:
“a means for validating the software engineer’s interpretation of the software requirements, as well as for eliciting new requirements. As with elicitation, there is a range of prototyping techniques and a number of points in the process where prototype validation may be appropriate. The advantage of prototypes is that they can make it easier to interpret the software engineer’s assumptions[,] and, where needed, give useful feedback on why they are wrong.”
1.2 What is software?
One definition of software is “the programs, routines, and symbolic languages that control the functioning of the hardware and direct its operation” (HMC, 2000).
Software is defined by the IEEE as “computer programs, procedures and possibly associated documentation and data pertaining to the operation of a computer system” (IEEE Computer Society, 1990).
The problem of loosely deliverables, notably in the IEEE definition, is why Pressman explicitly includes data structures and documentation within the scope of software:
“Software is (1) instructions (computer programs) that when executed provide desired function and performance, (2) data structures that enable the programs to adequately manipulate information, and (3) documents that describe the operations and use of the programs.” (Pressman, 2001, p. 6)
1.3 What is engineering?
According to Vincenti, “engineers spend their time dealing mostly with practical problems” (Vincenti, 1990, p. 200), and, in his book on the development of aeronautical engineering, he argues strongly that, from the point of view of the practitioner, "technology, though it may apply science, is not the same as or [sic] entirely applied science" (Vincenti, 1990, p. 4).
The McGraw-Hill Encyclopedia of Science and Technology defines engineering as “the science by which the properties of matter and the sources of power in nature are made useful to humans in structures, machines, and products” (McGraw-Hill's, 2008).
The IEEE definition of engineering is the “application of a systematic, disciplined, quantifiable approach to structures, machines, products, systems or processes” (IEEE Computer Society, 1990).
1.4 What is software engineering?
The IEEE definition of software engineering is an adaptation of their definition of engineering to the specifics of software (IEEE Computer Society, 1990): “(1) The application of a systematic, disciplined, quantifiable approach to the development, operation, and maintenance of software; that is, the application of engineering to software” and “(2) The study of approaches as in (1).”.
According to Pressman, “Software engineering encompasses a process, the management of activities, technical methods, and tools” (Pressman, 2001, p. 21), and software is developed by applying three distinct phases (Pressman, 2001, p. 22):
• the definition phase, focusing on “what information is to be processed, what function and performance are desired, what system…, what interfaces…, what design…, and what validation criteria are required to define a successful system” (Pressman, 2001, p. 22) • the development phase, focusing on “how data are to be structured, how function is to be
implemented…, how procedural details…, how interfaces..., how the design will be translated into a programming language…, and how testing…” (Pressman, 2001, p. 22) • the support phase, focusing on changes “associated with error correction, adaptations
required…, and changes due to enhancements brought about by changing customer requirements…reapplies the steps of the definition and development phases, but does so in the context of existing software” (Pressman, 2001, p. 22).
Software engineering, according to Berry, is:
“that form of engineering that applies a systematic, disciplined, quantifiable approach, the principles of computer science, design, engineering, management, mathematics, psychology, sociology and other disciplines as necessary and sometimes just plain invention, to creating, developing, operating and maintaining cost-effective, reliably correct, high-quality solutions to software problems” (Berry, 1992).
The IEEE Computer Society carried out a project to develop a Guide to the Software Engineering Body of Knowledge (SWEBOK) to establish consensus on generally accepted knowledge in the Software Engineering discipline. The SWEBOK objectives are:
“(1)‘To promote a consistent view of software engineering worldwide; (2) To clarify the place–and set the boundary–of software engineering with respect to other disciplines such as computer science, project management, computer engineering, and mathematics; (3) To characterize the contents of the software engineering discipline; (4) To provide a topical access
to the Software Engineering Body of Knowledge; (5) To provide a foundation for curriculum development and for individual certification and licensing material” (Abran et al., 2004).
The ten Knowledge Areas (KAs) identified by this initiative as specific to software engineering are: Software requirements, Software design, Software construction, Software testing, Software maintenance, Software configuration management, Software engineering management, Software engineering process, Software engineering tools and methods, and Software quality (Abran et al., 2004).
1.5 What is multidimensional?
In the Merriam-Webster Collegiate Dictionary (Merriam-Webster, 2005), dimension is notably defined as a ‘measure in one direction’, ‘one of a group of properties whose number is necessary and sufficient to determine uniquely each element of a system of usually mathematical entities (as an aggregate of points in real or abstract space)’, or ‘the number of elements in a basis of a vector space’.
In the Word Reference (WordReference, 2005) dictionary, ‘multidimensional’ is defined as ‘having or involving or marked by several dimensions or aspects’.
1.6 What are management and project management?
In the Merriam Webster Dictionary again (Merriam-Webster, 2005), management is defined
as ‘the act or art of managing: the conducting or supervising of something’, or, for an
organization, it can be defined as ‘the collective body of those who manage or direct an enterprise’.
The Project Management Institute (PMI) has defined project management as “the application of knowledge, skills, tools, and techniques to project activities to meet project requirements”
(PMI, 2000, p. 6).
According to Kerzner, a decade ago, “project management resided only in the project-driven sectors of the marketplace. In these sectors, the project managers were given the responsibility for profit and loss, which virtually forced companies to treat project management as a profession” (Kerzner, 2009, p. 50). In the last decade, the acceptance of project management in the non-project-driven and hybrid sectors led to “project management being promoted by marketing, engineering, and production, rather than only by the project-driven departments” (Kerzner, 2009, p. 50).
1.7 What is software engineering management?
Software Engineering Management is defined in (IEEE Computer Society, 1990) as “the application of management activities—planning, coordinating, measuring, monitoring, controlling, and reporting—to ensure that the development and maintenance of software is systematic, disciplined, and quantified.”
The Software Engineering Management KA of the SWEBOK Guide (Abran et al., 2004) therefore addresses the management and measurement of software engineering. The SWEBOK Guide identifies six major sub areas within the Software Engineering Management KA:
“Initiation and scope definition, […] the decision to initiate a software engineering project; Software project planning, […] the activities undertaken to prepare for successful software engineering from a management perspective; Software project enactment, […] software engineering management activities that occur during software engineering; Review and evaluation, […] assurance that the software is satisfactory; Closure,…the post-completion activities[…]; Software engineering
measurement,…the effective development and implementation of measurement programs […]” (Abran et al., 2004).
1.8 What is performance?
According to Lebas, it is difficult to define performance, and few people agree on what performance means, because “it can mean anything from efficiency, to robustness or resistance or return on investment, or plenty of other definitions never fully specified.” (Lebas, 1995).
According to Robbins, the performance of an individual is defined as:
“a function (f) of the interaction of ability (A) and motivation (M); that is, performance = f(A x M) [recte performance =
f(A,M)]. If either ability or motivation is inadequate,
performance will be negatively affected. This helps to explain, for instance, the hardworking athlete with modest abilities who consistently outperforms her more gifted, but lazy, rivals. But an important piece […] is still missing. We need to add opportunity (O) […] Performance = f(A x M x O) [recte performance = f(A,M,O)]. Even though an individual may be willing and able, there may be obstacles that constrain performance.”(Robbins, 2007, p. 70)
According to the Encarta Dictionary, performance is associated with working effectiveness and represents “the way in which somebody does a job, judged by its effectiveness” (Encarta, 2008). A performance appraisal represents “the assessment of an employee's effectiveness, usually undertaken at regular intervals” (Encarta, 2008).
Some of the definitions in the Webster Dictionary (Merriam-Webster, 2005) for performance are: ‘the execution of an action’, ’something accomplished’, ‘the fulfillment of a claim, promise, or request’, ‘the ability to perform : efficiency’, and ‘the manner in which a mechanism performs’.
According to the Business Dictionary (BusinessDictionary, 2005), performance is defined as the ‘accomplishment of a given task measured against preset standards of accuracy, completeness, cost, and speed’.
In the case of software performance (not organizational performance), it can be defined as the capability of a system to process a given number of tasks in a predetermined time interval (Schmietendorf et al., 2000).
Lebas defines performance as:
“deploying and managing well the components of the causal model(s) that lead to the timely attainment of stated objectives within constraints specific to the firm and to the situation. Performance is therefore case specific and decision-maker specific. Achieving congruence as to the definition of the parameters of performance and the causal model(s) that lead to it is one of the essential functions of management” (Lebas, 1995).
There are a variety of ways to view and define performance, as illustrated above. However, it is important to understand that this thesis deals with organizational performance, not software performance, individual performance, or any other type of performance. The author’s outlook on organizational performance corresponds to the last definition of performance in this section, as offered by Lebas.
1.9 What is measurement?
Metrology is the scientific study of measurement, and its terminology is standardized in a document titled “International Vocabulary of Basic and General Terms in Metrology” (ISO, 1993). The term ‘metrology’ ‘includes all aspects of measurement (theoretical and practical), collectively referred to in the metrology literature as ‘the science of measurement’ (Abran et
al., 2003b), as shown in Figure 1.3, where:
• The principles of measurement form the scientific basis for a measurement;
• A method of measurement is the logical sequence of operations for quantifying an attribute. A subjective method of measurement involves human judgment, while an objective measurement method is based on numerical rules;
• Measurement is the implementation of a set of operations for quantifying an attribute using a specified scale. The output is represented by the measurement results (the term ‘input’ is not defined in the ISO standard) (Abran et al., 2003b).
Figure 1.3 Measurement foundations. Adapted from Abran et al (2003b, p. 6)
The field of metrology covers three main activities: “the definition of internationally accepted units of measurement…the realisation of units of measurement by scientific methods…the establishment of traceability chains by determining and documenting the value and accuracy…and disseminating that knowledge” (Howarth and Redgrave, 2008, p. 9).
According to Vincenti in his book on the emergence of the aeronautical engineering discipline, engineering design knowledge can be divided into six categories:
• Fundamental design concepts, which fall into two important groups:
o operational principles – as explained by Polanyi, “how [the design’s] characteristic parts…fulfil their special function in combining to [sic: into] an overall operation which achieves the purpose” (Vincenti, 1990, p. 208);
o normal configurations – “general shape and arrangement that are commonly agreed to best embody the operational principle” (Vincenti, 1990, p. 209);
• Criteria and specifications – “Engineers, to carry out their task of designing devices, must work to very concrete objectives. This requires that they devise relevant design criteria and specifications” (Vincenti, 1990, p. 213);
• Theoretical tools – “intellectual concepts for thinking about design” (Vincenti, 1990, p. 213) and “mathematical methods and theories for making design calculations”(Vincenti, 1990, p. 213);
• Quantitative data:
o descriptive – “knowledge of how things are. Descriptive data needed by designers include physical constants…as well as properties of substance...and of physical processes…” (Vincenti, 1990, p. 216);
o prescriptive – “knowledge of how things should be to attain a desired end” (Vincenti, 1990, p. 217);
• Practical considerations – “designers also need for their work an array of less sharply defined considerations derived from experience in practice” (Vincenti, 1990, p. 217). These considerations are mostly learned on the job;
• Design instrumentalities − “the procedures, ways of thinking and judgemental skills” (Vincenti, 1990, p. 219) necessary to carry out engineering design.
The above categorization of engineering design knowledge is very interesting, notably because it clearly emphasizes the importance of measurement (quantitative data) to the engineering discipline in general.
Bunge states that any quantitative observation is a measurement, and “in order to decide what kind of measurement is to be done, an analysis of the concept denoting the corresponding property must be performed. Accordingly, the nature of quantification must be analyzed before the features of measurement can be understood” (Bunge, 1967, p. 194).
Measurement cannot guarantee success, but it can help an organization manage performance and have a transparent approach to improving performance. In the opinion of Donaldson and Siegel, “measurement for measurement's sake is a waste of time and money. Measurements need to be expressed in everyday terms that are familiar to the organization; otherwise, they may be of little value” (Donaldson and Siegel, 1998). Measuring is applied to past actions,
and, according to DeMarco, “you can’t control what you can’t measure” (DeMarco, 1982, p. 1).
According to Sink and Tuttle, the decision to measure is imposed on us “at least in the control-oriented situation. It is frequently avoided, and almost always misunderstood certainly influenced by management style and preference…motivated by unnecessary or unwarranted desires to control, or at least created illusion of control” (Sink and Tuttle, 1989, p. 141)
In software, measurement is very important for managing software life cycle activities. ISO/IEC 15939 is an international standard that defines a measurement process, as well as the measurement information model and associated terminology (ISO/IEC, 2002). This standard can be used by a supplier or acquirer to implement a measurement process or to evaluate the conformance of a measurement process with respect to this standard (ISO/IEC, 2002, p. 1). The measurement model, according to ISO/IEC 15939, is divided into three parts, as shown in Figure 5: information need, measurable concept, and entity. Format