THESIS REPORT PRESENTED TO
ECOLE DE TECHNOLOGIE SUPERIEURE
SUBMITTED IN PARTIAL FULFILLMENT
OF THE REQUIREMENTS FOR THE DEGREE OF
MASTER IN CONSTRUCTION ENGINEERING
BY
MENAA MEROUANE
PERFORMANCE OF SURFACE STRUCTURES SUBJECTED TO SUBSURFACE
SOIL EROSION
MONTREAL, July 25* 2008
© Merouane MENAA, 2008M. Gabriel Assaf, Supervisor
Department of construction engineering at Ecole de technologie superieure.
M. Mohamed A. Meguid, Co-Supervisor
Department of Civil Engineering and Applied Mechanics at McGill University.
M. Omar Chaallal, Chair
Department of construction engineering at Ecole de technologie superieure.
M. Jean-Sebastien Dube, External examiner
Department of construction engineering at Ecole de technologie superieure.
THIS THESIS WAS PRESENTED TO THE COMMITTEE AND THE ASSISTANCE
ON JULY 8* 2008
I would like to thank, Dr. Mohamed A. Meguid, for welcoming me among his team at McGill University. His guidance, availability and patience allowed me to learn a lot under his close supervision.
I would like to thank, Dr. Gabriel Assaf, for his understanding and support in a master oriented research.
I also express my thanks to Mr. John Bartczak, Marek Przykorski and Damon Kiperchuk for their precious help during the experimental program.
I owe deep appreciation to my cousin, Mr. Abdel-Jelil Khelalfa, for his support and kindness.
MENAA MEROUANE ABSTRACT
Several geotechnical engineering structures (e.g. pavements, slabs-on-grade, footings) transfer pressure to the ground through a contact area with the supporting soil. Design of these structures usually assumes that full contact is established throughout the service life of the structure. Erosion of the subgrade soil is a common mechanism that can lead to the development of subsurface voids and consequently a contact loss between the structure and the supporting soil characterized by a void space under the structure.
The performance of surface structures such as concrete pavements, slabs-on-grade, and sidewalks subjected to subsurface soil erosion is investigated experimentally and numerically in this thesis. The experiments were performed in a rigid tank holding a prism of sand with artificially created soil erosion; supporting a rigid steel plate. The surface deformation and contact pressure at the plate-soil interface were measured to quantify the effect of subsurface soil erosion on the stresses developing in the surface structure. Numerical modeling was conducted using 2D elasto-plastic finite element analysis. The model was first validated using the experimental results. Several scenarios were then considered where parameters such as the volume of soil erosion, its location, and the magnitude of the load the concrete slab is subjected to, were varied. Results of this investigation indicated that when the void space is centered under the slab-on-grade, tensile stresses developing in the structure increased as the size of the void increased causing ultimately the failure of the slab. It has also been concluded that when the void is off-centered, the supporting soil around the void space is likely to experience shear failure before excessive tensile stresses develop in the outermost fibers of the structure.
Key words: subsurface soil erosion, slab-on-grade, cracking, experimental modeling, finite element analysis.
MENAA MEROUANE RESUME
Plusieurs infrastructures geotechniques (ex. chaussees, dalles, fondations) exercent une pression a travers leurs surfaces de contact avec le sol. Le dimensionnement de ces structures suppose un contact parfait tout au long de la vie de service de celles-ci. Par ailleurs, I'erosion des sols sous-jacents est un mecanisme qui pent contribuer au developpement de cavites souterraines et par consequent a une perte locale de contact entre la structure et le sol, caracterisee par un vide sous la structure.
La performance des structures telles que les chaussees en beton, les dalles ainsi que les trottoirs sujettes a I'erosion souterraine est etudiee experimentalement et numeriquement dans ce memoire. Les experiences ont ete menees dans un caisson en acier rigide contenant du sable ou I'erosion souterraine a ete cree artificiellement; le tout supportant une plaque en acier rigide. Les deformations de la surface ainsi que les pressions de contact a I'interface plaque-sol ont ete mesurees afin de quantifier les effets de I'erosion souterraine sur les contraintes developpees dans la structure. L'etude numerique a ete conduite en utilisant un modele elastoplastique a 2 dimensions. Le modele a ete calibre avec les resultats experimentaux et divers scenarios ont ete envisages. Des parametres tels que le volume du sol erode, sa localisation ainsi que les chargements appliques sur la dalle de beton ont ete varies. Les resultats de cette recherche ont montre que lorsque le vide est centre directement sous la dalle, les contraintes de traction developpees dans celle-ci augmentent avec la taille du vide provoquant ainsi la rupture de la dalle. II a egalement ete conclu que lorsque le vide est excentre, le sol au voisinage de celui-ci est susceptible de subir une rupture avant que des contraintes de traction excessives ne se developpent dans la fibre la plus tendue de la dalle en beton.
INTRODUCTION 1 CHAPTER 1 LITERATURE REVIEW 7
1.1 Performance of slab-on-grade 7 1.1.1 Types of damage 7 1.1.2 Mode of deformation 8 1.2 Practices of slab-on-grade construction 8
1.2.1 Characteristics of the subgrade 9 1.2.2 Characteristics of the subbase 9 1.2.3 Characteristics of the concrete 10
1.2.4 Jointing the concrete 11 1.2.5 Overview of the practices at the city of Montreal 11
1.3 Causes of deterioration 12 1.3.1 Subsurface soil erosion 13
1.3.2 Frost susceptible soil 14 1.3.3 Expansive soil 15 1.3.4 Other causes of deterioration 16
1.4 Effect of subsurface void 17 1.4.1 Influencing parameters 17 1.4.2 Stability of underground openings 18
1.5 Underground void detection 20 CHAPTER 2 EXPERIMENTAL PROGRAMME 32
2.1 General 32 2.2.1 The rigid box 33
2.2.2 Polystyrene foam and organic solvent 34
2.2.3 Pressurized air bag 35 2.2.4 The trap door 36 2.3 Instrumentation 36
2.3.1 Measuring the displacement 36 2.3.2 Measuring the contact pressure 37 2.3.3 The data acquisition system 38
2.4 Material properties 38 2.5 Experimental procedure 39
2.6 Results analysis 41 2.6.1 The surface displacements 41
3.3 Pre-processing 62
3.4 The constitutive models 63
3.5 Calibration of the model 69
3.6 Physical model analyses 69
3.7 Full scale analyses 70
3.7.1 Effect of boundary locations 71
3.7.2 Validation of the full scale model with known analytical solutions 71
3.7.3 Discussion of the fiiU scale analysis 73
CONCLUSIONS AND RECOMMANDATIONS 96
APPENDIX 1 98
APPENDIX II 99
APPENDIX III 100
APPENDIX IV 101
REFERENCES 102
Table 1.1 Characteristics of the subbase 10 Table 1.2 Characteristics of the concrete 12 Table 1.3 Approximate expansion-swell-plasticity relationships 16
Table 2.1 Steel plate specifications 39 Table 2.2 Sand surface heights vs Number of container 40
Page
Figure 1.1 Typical characteristics of sidewalk cracking patterns 21 Figure 1.2 Components of vertical movement for a typical sidewalk slab 22
Figure 1.3 Possible failure modes of sidewalks 23 Figure 1.4 Effect of void size and location on the bearing capacity of a strip footing 24
Figure 1.5 Effect of void size on critical depth to void 25 Figure 1.6 Effect of void shape on bearing capacity of strip footing 26
Figure 1.7 True arch behavior 27 Figure 1.8 Inverted arch behavior 28 Figure 1.9 Generalized cross section of the roadways profile 29
Figure 1.10 Generalized cross section corresponding to the segment of the GPR data across
the known void 30 Figure 1.11 Map of the streets profiled showing the distribution of GPR signals 31
Figure 2.1 Description of the rigid steel tank 43 Figure 2.2 Polystyrene foam and organic solvent technique 44
Figure 2.3 The pressurized airbag technique 45
Figure 2.4 The trap door technique 46 Figure 2.5 Result of the optical displacement transducers calibration 47
Figure 2.6 Displacement set up 48 Figure 2.7 Contact Pressure measurement set up 49
Figure 2.8 Load cell calibration set up 50 Figure 2.9 Result of the load cell calibration 50 Figure 2.10 The data acquisition system 51
Figure 2.13 Device to grade the sand 54 Figure 2.14 Displacement at the center line for the case of a free sand surface 55
Figure 2.15 Displacement at 0.15m from the center line for the case of a free sand surface... 56
Figure 2.16 Settlement profile for the case of a free sand surface 57 Figure 2.17 Settlement profile for the case of a loaded sand 58 Figure 2.18 Contact pressure during the unloading process 59 Figure 2.19 Contact Pressure initiated from the same stage 60
Figure 3.1 Model with prescribed displacement 76 Figure 3.2 Model with surface excavation 76 Figure 3.3 Typical finite element mesh with 15 -nodded solid elements 77
Figure 3.4 Hyperbolic stress strain relation in primary loading 78
Figure 3.5 Definition of E^g^ in isotropic compression test 78 Figure 3.6 Yield surface of Hardening-Soil model in q-p plane 79 Figure 3.7 Representation of the total yield contour in principal stress plane 79
Figure 3.8 The variation of the modulus of elasticity with the confining pressure 80
Figure 3.9 Results of the calibration 81 Figure 3.10 Contact pressure for centered voids 82
Figure 3.11 Contact pressure for off-centered voids 83 Figure 3.12 Effect of the boundary locations on the horizontal displacements 84
Figure 3.13 Effect of the boundary locations on the vertical displacements 84
Figure 3.14 Problem geometry 85 Figure 3.15 Vertical surface displacements induced by the footing 85
Figure 3.18 Plan of scenarios simulations 87 Figure 3.19 Normalized tensile stresses induced into the concrete slab subjected to a uniform
load and a centered void 88 Figure 3.20 Normalized tensile stresses induced into the concrete slab subjected to a uniform
load and an off-centered void 89 Figure 3.21 Mohr coulomb plastic points before presence of void 90
Figure 3.22 Mohr coulomb plastic points for a void width of B=0.58m 90
Figure 3.23 Influence of the void depth on the tensile stresses 91 Figure 3.24 Influence of the centered void on the vertical stress distribution 92
Figure 3.25 Influence of the off-centred void on the vertical stress distribution 93
Figure 3.26 Depth influence under centered and off-centred voids 94 Figure 3.27 Normalized tensile stresses induced into the concrete slab versus prescribed
2D 3D ASTM CH GPR HSS MH OH WRc A Ac B D D E E50 p r e f -^50 Eur
E;:^
Two dimensions Three dimensionsAmerican society for testing and material Clays of high plasticity
Ground penetrating radar Hollow structural section Silts of high plasticity Organic clays
Water Research Center Normal section Activity factor Void width Void depth Depth to void Young modulus
Confining stress dependent stiffness modulus
Reference stiffness modulus
Elastic modulus
Reference elastic modulus
H Sand surface height
I Inertia
Ko Coefficient of lateral earth pressure at rest
Ko"*^ N o r m a l l y consolidated coefficient of lateral earth pressure at rest
P Isotropic stress
P Load
Pp Isotropic preconsolidation stress
PH Dimensionless coefficient
PI Plasticity index
Rf Failure ratio
S Settlement
W Void width
W Concrete unit weight
X Axe of abscissa
Y ordinate axe
Z Depth to void
a Area of soil tension
a Half of footing width
c Cohesion
d Steel plate thickness
f"=
/ c
g h
Cap yield surface
Compressive strer
Gravity
Water elevation
m Stiffness stress dependency
p*^^ Reference confining pressure
q Deviatoric stress
qa Asymptotic deviatoric stress qf Ultimate deviatoric stress
q Special stress measure for deviatoric stresses
r Circular void radius 9 Friction angle
Ej Axial strain
©3 Minor principal stress
Oj Major principal stress
Y'' Hardening parameter
ej* Axial plastic strain
e^ Volumetric plastic strain
(Pj,y Critical friction angle
(pn, Mobilized friction angle
P Relative soil thickness.
a Auxiliary parameter related to Ko° M Poison ration
Uur Poison ration in primary loading
Gf Tensile stresses
Ogjjjj Admissible tensile stresses
Among the 100,000 kilometers of Canadian sidewalks, 15 to 20% need to be replaced. These structures are designed to last for a period of 20 to 40 years, however, in some Canadian cities, premature failure is observed 1 to 5 years after construction. Consequently, the repair or replacement costs of sidewalks assumed by Canadian municipalities are estimated to $1.5 to $2.4 billion (Rajani, 2002).
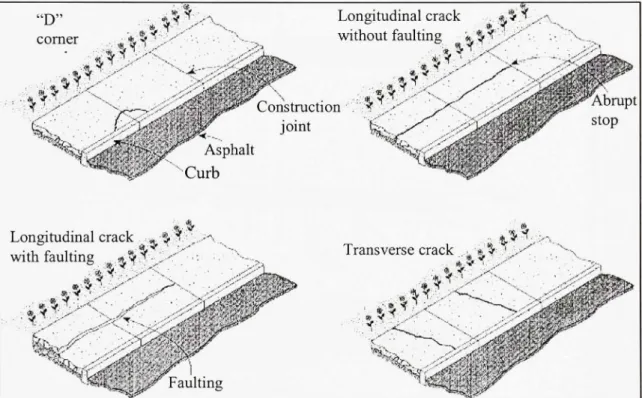
Sidewalks in North-America are essentially slab-on-grade and the most common loading they are subjected to, comes from snow removal vehicles. The observed deteriorations can take several forms i.e., rigid body movements, joint buckling/blow-up, popout, shattering, comer break, scaling, crazing, shrinkage cracks, longitudinal cracks, faulting, "D" cracks, transverse cracks, joint spalling, or comer spalling. These deteriorations are usually attributed to two main factors. The first involves aspects related to material failure, which includes fatigue of the concrete and other constmction defects. The second category is attributed to the loss of reaction support. The behavior of slabs-on-grade is best understood by studying the corresponding soil-structure interaction rather than the individual aspects of the slab or the soil. In this research, the effects of subsurface soil erosion on the performance of concrete slabs directly supported on the erodable subgrade are investigated. The erosion mechanism is characterized by a soil volume loss responsible for ground deformation leading to loss of support underneath the slab. As illustrated in the figure at the end of the Introduction, the phenomenon is problematic when the partially unsupported slab-on-grade experiences deformations that induce excessive tensile stresses in the outer fibers of the concrete or when the supporting soil around the void experience excessive shear stresses.
The three main objectives of the research are listed below:
• Build a physical model that simulates one dimensional volume loss under a rigid stmcture according to the mechanism illustrated in the figure at the end of the Introduction.
• Monitor the physical model to measure parameters such as the surface settlement and the contact pressure at the structure-soil interface.
• Conduct 2D elasto-plastic finite element analyses to investigate (a) the structural behavior of a concrete slab-on-grade subjected to a uniform loading and a loss of support due to subsurface volume loss (b) the failure mechanism of the soil-stmcture system.
State of Montreal sidewalk s
A survey to evaluate the condition of sidewalks at Montreal has been conducted in September 2006 with the following objectives: (a) determine the proportion of each type of cracks and the slab movements encountered based on visual observations; (b) estimate the age of the sidewalks surveyed; (c) gather as many information as possible concerning the underlying soil through boring logs. Six streets were selected for the investigation because of either the amount of stmctural subsidence observed (St-Laurent, St-Denis, St-Valier) or because the sidewalks seemed to be recently constmcted (Mont-Royal, Sherbrooke and St-Hubert). The exact sections of the streets surveyed are listed below:
• Mont-Royal avenue between Saint-Denis and De Lorimier • Sherbrooke street between Berri and Jeanne Mance • Saint-Hubert street between Villier and Jean Talon
The general surficial soil descriptions of the surveyed streets are described below. The complete soil boring logs gathered from the city of Montreal can be found in Appendix I. The subsurface materials of Mont-Royal avenue consists of a 0.5 m fill of clayey sand containing a small amount of rock fragments, overlying a hard or soft clay layer of variable thickness. The surficial stratigraphy of Sherbrooke street is composed of a fill containing gravels with presence of asphalt and concrete, or clayey silt with small amount of sand, or silty clay. The thickness of the fill varies from 0.5 m to 1.22 m and is usually underlain by a layer of clay with medium to high plasticity index. Only two locations were sounded for Saint-Hubert street and over a short depth. The boreholes indicated the presence of a fill layer containing sand with small amount of silt, trace of gravel, stones, blocs and various materials (charcoal, metal, asphalt). Brown silty and sandy moraine with gravels follow the fill over a depth of 2.6 m. Regarding Saint-Laurent boulevard, the borings indicate the presence of a shallow cracked limestone rock preceded by a fill of gravel, sand and small amount of silt. At some locations the stratigraphy consists of 1.7 m to 2 m layer of brown sandy clay with small amount of gravel or clayey fine sand overlying bedrock. The boreholes carried out on Saint-Denis street reveal for the most of them a layer with a thickness around 0.6 m of angular stones, sand silt and trace of clay size particles; over a shaly limestone. Saint-Valier street is generally constituted of a cracked limestone rock around 2 m depth from the surface overlain by a layer of sand, gravel and silt for an average thickness between 3 and 6 m.
The visual aspect of Mont-Royal, Sherbrooke and Saint-Hubert sidewalks indicates that they were recently constmcted whereas Saint-Denis, Saint-Laurent and Saint-VaUer showed significant deteriorations. All the pictures taken during this survey are classified in Appendix II. Most of the crack patterns observed are transverse followed by " D " cracks and then longitudinal cracks. The slab movement mode is essentially a rigid body movement
deteriorated streets multiple types of deterioration were observed such as popout, joint spalling, comer spalling, deterioration of the concrete at the top surface, slab completely split and crazing. Concerning St-Denis street, heavy trees are set up every five meters and the slabs are uplifted at the bottom of the tmnk.
Applications
The systematical replacement of the deteriorated sidewalks during a period of budgetary restrictions is unjustified and expensive. The minimal financial effort already required for maintenance and reparations is already huge. In this context, the development of maintenance strategies that would be efficient, durable and economical represents a major challenge for the construction industry. An analogy to sewer rehabilitation is worth to be mentioned. Indeed, because of the huge amount of sewers to be rehabilitated in the UK, the water research center put in place a strategic long-term maintenance plarming (WRc, 1994). This plarming takes into consideration the probability that an event would happen through parameters such as the surrounding soil, the type of the pipe, the complaints registered by the municipalities, etc.; and the consequences that would be endured because of this event. Consequently, a map that represents the sewers network with a grade attributed to each section helps to prioritize the sewers to be inspected and possibly rehabilitated. Therefore, information such as the size of the void and its location beneath the slab-on-grade that induce critical stresses in the concrete or the supporting soil represent parameters that could be used to schedule strategic long-term rehabilitation planning. Actions such as identifying the size and the location of the void with non destructive techniques (i.e. Ground penetration radar) can be taken and if necessary injecting a liquid mortar into the void before the latter reaches a critical size.
methodology pursued during this research. The first chapter reviews in the first section the problems encountered during the service life of the slab-on-grade including the types of damage and the modes of deformation followed by the common constmction practices. The second section discusses the main causes that lead to slab-on-grade deterioration focusing on the contribution of the supporting soil. This chapter concludes with a literature review on the soil-stmcture interaction when the soil is subjected to subsurface voids and the stability of underground cavities.
Chapter 3 describes how the physical model was built and discusses the results of the experimental investigation. This chapter is not restricted to the description of the final setup but explains the process that led to it.
Chapter 4 is dedicated to the numerical analysis and contains two main sections.
The first section describes the constitutive model, the strategy used to simulate the experimental tests and discusses the result of the calibration. The second section presents and discusses the full scale analyses.
Finally, the last part of the thesis contains general conclusions and suggestions for further research.
X:::>;:;:::X:::::::::;:;-:--:>:::D:-::;-:^ ^-y-y-yy-y.
- . • . • . • . • . • . • . • . • . • . • . • . - . • . • . • . • . • . • . • . • . - . • . • . • . • r r . - . \l . • . • . • . • . • . - . • . • . • . • • ' • • • • • • • • • • • • • • - • • • - • • • • ' • • • ' • • • • • • • • • • • • • • • • • " H • • : • : • : • : • : • ; • : • ; • : • :
mymM:::mm:^mmyyy
• : z : • : • : • : • ; • : • : • : • : • :: : : ; : : - : : : : ; : : : - : - : F t s s u r e d : y O ^ ::;•:• >
pipe o r j . / • ' • so i \/r»lijm p Inse t • • •.•.•.•.• , .hp H rrvr k ^ - ^ •/ / . . . .
1.1 Performanc e o f slab-on-grad e
In this section, the performance of slabs-on-grade implies the visual symptoms mostly observed and the modes of deformation the slabs are subjected to.
1.1.1 Type s of damag e
The main reason for crack development in slabs-on-grade is when forces induce stresses in excess of the tensile strength of the concrete. As shown on Figure 1.1, three major categories of crack are identified (Rajani and Zhan 1997). The most encountered type of crack is the longitudinal crack that usually appears in the middle third of the slab. The cracks initially appear as hairlines, but they open up with time and faulting develops. It is worth mentioning that observations have shown that longitudinal cracks increase with the plasticity index of the subgrade, although no correlation was found between them (Rajani and Zhan 1997).
A second type of crack, the transverse crack, results from a non-uniform compaction rather than a lack of compaction. These cracks are also subjected to opening and faulting.
The third category is the " D " comer crack. Comer cracks are also a consequence of inadequate grading of the subgrade. An uplift movement of the slab may cause comer breakage resulting from friction at the control joints if the underlying soil is subjected to frost heave or shrinkage movements. Based on observations, comer crack occur in regions where longitudinal cracks are not predominant (Rajani and Zhan, 1997).
As shown in Figure 1.2, slabs-on-grade are usually subjected simultaneously to several modes of deformation. Deteriorations occur when these modes of deformation induce excessive tensile strains in the concrete. As described below, four major modes of deformation are identified (Rajani, 2002).
Rigid body movement which represents a uniform movement where the slab rises, subsides or tilts. This type of movement results from expansive soil, frost susceptible soil or thermal expansion of the concrete (Figure 1.2).
The two second major modes of deformation are "sagging" and "hogging" which represent a non uniform movement that leads to longitudinal cracks. It occurs when the soil is subjected to a differential settlement between the center and the edge of the slab due to a freeze/thaw or swell/shrink of the underlying soil (Figure 1.3).
The last major mode of deformation is tensile-shrinkage, which is a horizontal movement caused by a moisture decrease of the underlying soil. When an expansive soil dries, tensile stresses are induced in the concrete slab. Cracks appear when the tensile stresses induced by the underlying soil exceed the tensile strength of the concrete (Figure 1.3).
1.2 Practice s o f slab-on-grade constructio n
Concrete sidewalks are essentially slab-on-grade underlain by a first layer that constitutes the subbase and a second one that constitutes the subgrade. Each entity needs to be prepared in order to ensure long-term performance, safety and comfort.
latter is strongly related to the uniformity of the subgrade rather than its bearing capacity, because of the low pressures the soil has to support. Uniform subgrade can be improved by controlling soil expansion, frost susceptible materials and grading.
While non uniform compaction rather than the degree of compaction is responsible for comer and transversal cracks on sidewalks, it is usually assumed that longitudinal cracks increase with plasticity index (Rajani and Zhan, 1997). Soil with plasticity index over 20 may cause significant changes in moisture and consequently high soil volume change. When compaction is applied on highly expansive soil, swelling and softening can occur during subsequent wetting if the soil is too dry. If the soil is too wet, shrinkage may create instability and transmits tensile strains to the sidewalk, which is a principal cause of cracks. Compact expansive soil to 95% of the optimum density at 1% to 3% higher than the optimum moisture content provides a subgrade with the required stability (Portland Cement Association, 1983). Frost action is also responsible for deteriorations due to differential movements. It is recommended to remove frost susceptible soils and replace them with gravel material.
1.2.2 Characteristic s o f the subbas e
The subbase is usually a layer of granular material placed between the subgrade and the slab-on-grade. Its principal role is to provide a cushion to compensate for the minor subgrade defects and reduce the development of suction which can induce problems due to frost action.
Studies carried out by the Portland Cement Association (1983) show that it is not economical to build a subbase over 101 mm thickness to improve support or diminish slab thickness. However, although uniform support rather than strong support is required from
the subbase and the subgrade, a subbase layer of 150 mm compacted to 95% of the standard
proctor density is usually used in Canada.
The Portland Cement Association (1983) recommends a subbase with a dense-graded
material that meets the requirements summarized in Table 1.1.
Table 1.1
Characteristics of the subbase
Material
Maximum particle size
Passing No.200 sieve
Plasticity index
Liquid limit
Sand, sand-gravel, cmshed stone or combinations
No more than — of the subbase thickness
3
15% maximum
6 maximum
25 maximum
1.2.3
Characteristic
s of the concrete
In Canada, concrete sidewalks are essentially slab-on-grade of 150 mm thickness. The
concrete quality is mostly affected by the top 6 mm that represent the wearing surface. Thus
the placeability of the concrete and the finishability of the surface are as important as the
strength because of the impact they have on the sidewalk surface. The general specifications
for the concrete sidewalks in Canada are (Rajani, 2002): Strength (25 to 35 MPa), minimum
cement content (333 kg/m ), maximum size of coarse particles (19 mm), slump
(50 to 100 mm) and air entrainment (5.5 to 8%). Except for sidewalks that cross a driveway entrance and are subjected to vehicle load, steel reinforcement is not required.
To better understand the behavior of the concrete slab-on-grade, a special attention must be taken to the soil-stmcture interaction rather than to the individual aspect of the slab or the soil characteristics.
1.2.4 Jointin g the concret e
Two types of joints are used for sidewalk constmction. The first type is the expansion joints (also called isolation joints) that allow for independent movements of the slab. Twelve millimeters of compressible material is recommended every 15 m along the sidewalk or when a rigid stmcture is encountered. The second type of joints is the control joints (also called contraction or cut joints). Their function is to relieve stresses induced thermally or by shrinkage allowing the horizontal movement of the slab. Control joints are placed transversally every 1.2 to 2 m along the sidewalk. However, longitudinal control joints are also recommended since longitudinal cracks are very frequent and can extend through several slabs, usually along the centerline.
1.2.5 Overvie w o f the practices a t the city of Montreal
Sidewalks in Montreal can be monolith or built in two parts (boulevard sidewalk). The subgrade is graded but not compacted except when the native soil is of poor quality and has to be replaced. A 20 mm layer of cmshed stone compacted to 95% of the optimum modified Proctor density is then used. A layer of 150 mm thick of clean stone forms the subbase. The size of the granular material ranges from 10 to 31.5 mm (usually sold at 20 mm). Four simple passes are performed using a vibrating plate.
Regarding the concrete characteristics, a complete specification report released by the city of Montreal to the ready mixed concrete suppliers is included in Appendix III. The main characteristics are summarized in Table 1.2 below:
Table 1.2
Characteristics of the concrete
Compressive strength (MPa)
Minimum cement content
Maximum size of granular material (mm) Slump (mm)
Air content (%)
32 to 35
Specified by the supplier respecting a ratio: '^^''' < 0.45 cement 20 80 ±30 5 to 8 1.3 Cause s of deterioration
The causes of sidewalk deterioration are multiple and often a combination of several mechanisms. Among theses mechanisms we can identify those relevant to quality concrete, freeze-thaw cycles and expansive soil. However, emphasis is placed in this study on the mechanism of subsurface soil erosion.
1.3.1 Subsurfac e soi l erosio n
Subsurface soil erosion is one of the contributing factors to the deterioration of surface stmctures such as concrete pavements, slabs-on-grade and sidewalks. Erosion of the subgrade is usually defined as a downward migration of unconsolidated deposits into bedrock openings and leads to a formation and propagation of cavities. This mechanism is responsible for surface deformation creating loss of support undemeath surface stmcture (Sterpi, 2003), and at the extreme point the development of sinkholes.
Soil erosion is usually associated to Karst terrain (Newton, 1984). Karst refers to a distinctive terrain that evolves through dissolution of the bedrock and development of underground drainage (Waltham and Bell and Culshaw, 2005). It is therefore associated to soluble rock such as limestone, dolostone, marble, gypsum, and carbonate rock. Karst terrain possesses hydrological characteristics favorable to soil erosion as they often contain a significant number of joints that accelerate the rate of intemal seepage. Surface deformation can also be attributed to a vertical upward propagation of an uneven subgrade due to bedrock weathering (Kemmerly, 1993).
The development of induced sinkholes is well documented in the literature. Although, sinkholes represent the extreme consequence of subsurface erosion, the mechanism is similar to the one responsible for the loss of support undemeath surface stmctures and leads to their deterioration. Induced sinkhole or doline refers to those caused by man's activities and exceeds natural sinkholes occurrence in many areas (Newton and Tanner 1986). They are divided into two types (Newton 1987). The first includes those resulting from water level lowering due to pumpage and leading to (1) loss of buoyant support; (2) increase in water velocity; (3) water level fluctuations; and (4) induced recharge. The second type involves those resulting from constmction such as erection of stmctures that induce surface loading, or diversion/drainage of water that modify the underground seepage movement. Also included is leakage from sewer and similar facilities (Giroud et al, 1990, Tharp, 1999).
1.3.2 Fros t susceptible soi l
Many parts of Canada are overlain by frost susceptible soil responsible for sever deteriorations to surface stmcture such as slabs-on-grade or pavements. Segregation and ice lenses are the main causes of these deteriorations. For instance, the pavement load-carrying capacity is strongly influenced in the freeze/thaw cycles as the pavement temperature can range from -40 °C to -50 °C and the frozen depth can reach up to 2 m (Watson and Rajapakse, 2000). As the stiffness of the granular base and the subgrade soil underlying the pavement increases during the winter, a state of near-saturation is reached in the spring season once thawing cycle take place. Pavements are thus at their weakest state during this period which significantly reduces their load-carrying capacity.
A survey program carried out by Rajani and Zhan (1997) monitored seasonal variations such as sidewalk movements, frost depth and moisture in five cities at monthly intervals over a period of two years. As a first step, the process extracted the non damaging rigid body movement (uniform vertical movement, tilt), then the next step assessed the differential vertical movements through the estimation of the flexural strains. The following conclusions were made:
• The uniform vertical movement is caused by the heave due to frost penetration beneath the sidewalk as the two parameters monitored have the same time dependency.
• During the warm season, the variation of the uniform vertical movements were insignificant as an indication that moisture change doesn't have a significant impact on sidewalks uniform vertical movement.
• Tilt movements were also observed to have the same seasonal dependency as uniform vertical movement. The differential frost heave beneath the sidewalk was explained by the differential soil moisture content at the two edges of the sidewalk.
It was difficult to understand through this study how the flexural strains vary with
seasonal conditions. However, flexural strains were found to be higher during the cold
season and a tendency for hogging was observed.
1.3.3 Expansiv e soil
Expansive soils are classified by the ASTM Soil Classification System, as clays of high
plasticity (CH), silts of high plasticity (MH), and organic clays (OH). Table 1.3 shows
approximate correlation between plasticity and degree of expansion.
Skempton (1953) defined the activity as being the susceptibility of a clayey soil to expand
and suggested three classes of clay. Inactive clay when the activity factor is smaller than
0.75, normal clay for a factor ranged between 0.75 and 1.25; and active clay for a factor
greater than 1.25. The activity is defined as follow:
Plasticity index ^, _
Ac- (1.1)
Percent of clay particles
Expansive soils can experience large volume changes when the soil swell as it absorbs water
or shrinks as it dries. Water content changes in expansive soils occur in the upper few
meters under climatic environmental factors. This zone is generally termed as zone of
seasonal fluctuation or active zone. Differential movements caused by these volume
changes are responsible for severe deteriorations throughout the world (Chen, 1998). Those
deteriorations are mostly associated with light surface stmctures such as pavement or
slab-on- grade, while heavy stmctures tend to eliminate the soil's swelling pressure (Marr et al.
2004).
As mentioned previously, an attempt to find a correlation between the Atterberg limits and
the type of sidewalk damage has failed (Rajani and Zhan, 1997). However, the authors
observed that longitudinal cracks increase with plasticity index because a large change in moisture is required to the transition from liquid state to semisolid state. Differential swelling beneath the concrete sidewalk may lead to hogging or sagging, that are responsible for longitudinal cracking.
Furthermore, both freeze-thaw and swelling-shrinkage cycles lead to erosion and void development into the subgrade. Depending on their size, erosion voids may cause a loss of support for the concrete slab. Tensile stresses are then induced and may be critical to the sidewalk integrity.
Table 1.3
Approximate expansion-swell plasticity relationships (Portland Cement Association, 1983)
Degree of expansion None expansive Moderately expansive Highly expansive Percentage of swell 2 or less 2 to 4 more than 4 Approximate Plasticity index (PI)
Oto 10 10 to 20 more than 20
Source: This table was taken from the Portland cement association bulletin written by Ralph E. Spears
(1983), Concrete floors on ground: Approximate expansion-swell plasticity relationships, p.3.
1.3.4 Othe r causes of deterioratio n
There are also other causes of sidewalks deterioration. Damage due to the fatigue of the concrete, poor concrete quality or poor concrete constmction procedure (placing and curing) are also responsible for sidewalks deterioration. Those causes lead to spalling, pop-outs and scaling.
Trees planted near sidewalks can be problematic to the slab integrity as well. First, the trees may cause moisture depletion during the dry season leading to a tensile-shrinkage mode of failure. Second, some trees have heavy roots that induce pressure that can lift the slab.
1.4 Effec t o f subsurface voi d
Investigations regarding the stability of shallow foundations subjected to subsurface voids resulting from mining, tunneling and soluble rock are available and worth noting in this section. The environment of these investigations is different from the scope of the present project as the size of the void and the load applied by the footing are not comparable. Furthermore, those studies don't analyze the behavior of the stmcture; only soil displacement and the bearing capacity are investigated.
1. 4.1 Influencin g parameter s
The bearing capacity and the displacement of a strip footing subjected to subsurface void were investigated experimentally and numerically by Bans et al. (1983). The experiments were performed using footings of different widths in a tank holding compacted silty clay where different sizes of void were artificially created. A total of 47 experiments were performed. Numerical modeling was conducted using 2D elastic-perfectly plastic finite element analysis. A normalized critical depth (D/B)cr that represent the limit after which the presence of void has a negligible effect on the bearing capacity of the strip footing was identified. Figure 1.4 shows that the bearing capacity decreased when the voids are closer to the footing (D/B ratio) for a given void size (W/B ratio). This can be explained by the reduction of the shear strength due to the thinner mass of the soil underlying the footing as the void became closer. It can also be observed as illustrated in Figure 1.5 that the critical depth (D/B)cr increased up to a maximum value of 12. This implies that when the depth of the void is located at a distance of more than twelve times the footing width, the bearing
capacity is not influenced by the presence of the void regardless of its size. For the sake of comparison, the critical depth is usually taken as two times the footing width for the case of no void condition.
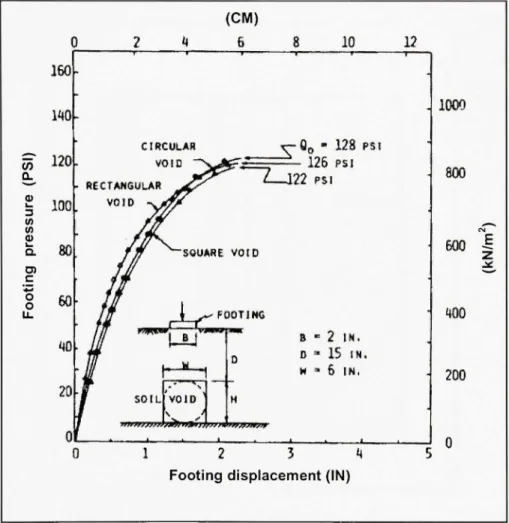
To determine whether the previous results differ for different void shapes a comparison was made through experimental study (Baus et al., 1983). As shown on Figure 1.6, the void shape has a negligible effect on the bearing capacity as the curves related to the rectangular, square and circular void are very close.
1.4.2 Stabilit y o f underground opening s
Stability of underground opening have been of interest to many researchers, a centrifuge modeling for instance have been widely used to model stability of soil over cavities. Craig (1990) found through centrifiige tests that failure of clayey soil over a cylindrical void provides a ratio representing the effective overburden depth against cavity diameter of less than the unity. The stability of a cylindrical cavity overlain by a cemented layer of sand was also investigated by Abdulla and Goodings (1996). The authors observed that the failure of the cemented sand layer take either the shape of a tmncated conical section or a dome when the cemented layer is 25-30% higher than the cavity diameter.
Analytical approaches to this problem are scarce. Brady & Brown (1993) used analytical approaches based on limit equilibrium to study the stability of a chimney in mining. This method presents some serious limitation. Indeed, the method ignores the plastic flow mles often employing a kinematically inadmissible collapse mechanism and only global equilibrium conditions are satisfied. It is, thus, impossible to determine if a collapse load determined by the limit equilibrium method is safe or unsafe.
Analytical approach based on limit analysis was investigated by Davis et al. (1980). Contrary to the limit equilibrium method, limit analysis is based on the determination of a
safe and an unsafe collapse loads that bracket the tme and unknown solution. Therefore, an upper bound solufion can be found from a kinematically admissible collapse mechanism by equating the work done by the intemal stresses with the work done by the extemal loads (traction load and self weight of the deforming soil mass). The collapse load determined through this balance will not be lower than the tme collapse loads and this is the unsafe solution. The lower bound solution states that if an equilibrium distribution of stress can be found that balances the extemal loads and is nowhere above the failure criterion of the material, the extemal loads are not higher than the tme collapse loads and this is the safe solution.
Stability of sinkholes and Karst formations are strongly related to arching phenomena. Marston and Anderson theory (1913) stated that the load due to the weight of a soil column supported by a buried pipe is reduced by the arch action that transfers part of the overburden load to the adjacent prism. Therzaghi (1943) used the arching theory to study the stability of soils subjected to underground void. Figure 1.7 represents a soil prism overlying a void assumed to have a width (B). The soil immediately overlying the void behaves in tension (area designated by a) and the overburden load is transferred by cohesive and frictional forces to the adjacent elements. This behavior is known as a tme arch (Hunt, 1986) and last momentarily depending on the soil shear strength and other variables. As soil particles begin to drop, the tensile forces that form the tme arch start to dissipate leading to a formation of an inverted arch (Figure 1.8). The latter behavior can be described as a soil prism settlement into an inverted arch and mobilize the shear strength of the adjacent soil elements that transfers a portion of the overburden load. The amount of the settlement that forms the inverted arch depends on the distance between the void and the soil element above. As this distance increases, the settlement decreases and ultimately nullifies at a certain point designated by "plane of equal settlement" if the soil thickness is significant.
If a circular void with a radius (r) is substituted to a rectangular void of a width (B), Kezdi (1986) showed that the effect of arching is doubled.
1.5 Undergroun d voi d detectio n
A survey involving a detection of voids or void-forming conditions in a residential neighborhood of northem Ohio was conducted by Hauser and Howell in 2001.
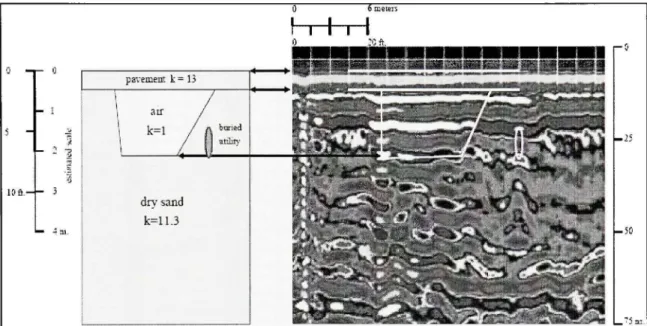
A ground penetrating radar (GPR) with a 300 MHz antenna was used in this project to identify locations of roadways that are likely underlain by voids. Figure 1.9 represents a typical cross section of the surveyed roadways reported through boring logs. The sketch shows a layer of asphalt up to 15 cm overlying a 10 cm brick pavement, which overlies 15 cm of concrete.
Initial tests have been made at a location of a known large void to provide a pattern that would be used to track eventual voids elsewhere along the profiles (Figure 1.10). The results obtained revealed a strong amplitude reflection at the base of the concrete pavement in comparison to the usual signal of concrete above soil. Anomalies were also observed in the data related to surface and subsurface facilities such as buried pipes, parked cars, and manhole covers. Each of these anomalies could be identified as such. The authors mentioned that a thinner void would not be observed as distinct, and would separate reflections. However, a combination or interference of the strong reflection at the base of the concrete roadway with the wave of a strong reflection from the bottom of the void can still reveal the presence of a void.
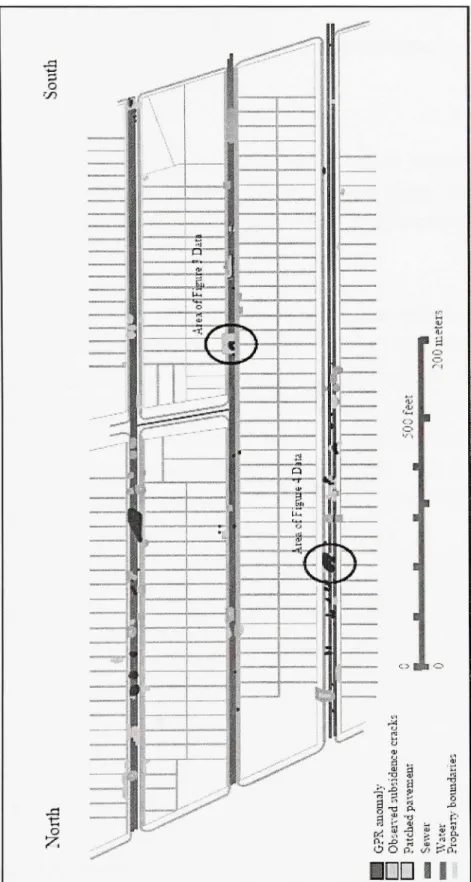
Figure 1.11 shows a map where locations that exhibit the same pattem of the known void are summarized. The signals interpreted as being potential voids were recorded in areas where surface subsidence was observed, such as cracks in roadway pavements, sidewalks, and foundations, as well as pavement patches. This was confirmed by subsequent borings at these areas.
Longitudinal crack — w-without faultine * t^'' ' *. T Constmction <r > joint Asphalt Curb Longitudinal crack ^ > with faultine *v>^ » > ^> -^ raulting Transverse crack » v' "^
Figure 1. 1 Typical characteristics of sidewalk cracking patterns.
(Rajani and Zhan, 1997)
Source: This figure was taken from an article written by Balvant Rajani and Caizzhao Zhan (1997),
Performance of concrete sidewalks: Typical characteristics of sidewalk cracking patterns, p.304.
^ vertical movement profile
<:i^;^;-<y^^^:ff'Sjy^^ >
• * > •
w
Uniform rigid body movement
-v^'v'^ mom<^M^pm^p:^^wM
^—^^
Tilting rigid body movement
-TTTSi
First mode
/J\\// rvr
imi^^^:ii:c^^:»^^^(^ilh^sm'Second mode / / W /
Figure 1.2
Components of vertical movement for a typical sidewalk slab.
(Rajani and Zhan, 1997)
Source: This figure was taken from an article written by Balvant Rajani and Caizzhao Zhan (1997),
Performance of concrete sidewalks: Components of vertical movement for a typical sidewalk slab,
Evapotranspiration Slab split
<t.
Tensile shrinkage
failure modes \/
V'Cracking at bottom of sidewalk \
\ <L Infiltration Sagging
- <._.Thawing front
r- Cracking at top of sidewalk
4 4 1
% . U Snow bank Hogging.
[ ^ 1 ^ *'
<,,Freezing front
Figure 1. 3 Possible failure modes of sidewalks.
(Rajani and Zhan, 1997)
Source: This figure was taken from an article written by Balvant Rajani and Caizzhao Zhan (1997),
Performance of concrete sidewalks: Possible failure modes of sidewalks, p.308. Published by the
c o •6 c o o •D O > o c c u k-V Q. o ra a (0 u o> _c *c ra 0) OQ .100 80 . 60 QO 20 COTI(»S jfWWTWfwwrrr flCCK - . 1 I I t 7 9 D/B Rati o 11 13 15
Figure 1.4
Effect of void size and location on the bearing capacity
of a strip footing.
(Baus et al. 1983)
Source: This figure was taken from an article written by Ronald L. Baus (1983), Bearing Capacity above
void: Effect of void size and location on the bearing capacity of a strip footing, p.9. Published by the
18 n 16 14 _ 1 2 -u m 1 0
a 8
6 -4 _ 9 ( • ^ — • -'' ) 2 1 1 4 6 W/B • i_^fOC sou. U- B 4 ^ - ^ L ^ 9immm " * « * l ! N 6 D ROCK 1 1 8 1 0 12Figure 1.5
Effect of void size on critical depth to void.
(Baus et al. 1983)
Source: This figure was taken from an article written by Ronald L. Baus (1983), Bearing Capacity above
void: Effect of void size on critical depth to void, p.10 . Published by the Journal of Geotechnical
(O Q. 3 tf) M C o o 160 iW 120 100 ClftCUtAR VOID - RECTAHCULA R VOID (CM) 6 10 ^ Q o " 12 8 ps t 126 P S I 22 P5 1 1 2 3 ^ 4
Footing displacemen t (IN )
12
im
800 z WO 200Figure 1.6
Effect of void shape on bearing capacity of strip footing.
(Baus et all983)
Source: This figure was taken from an article written by Ronald L. Baus (1983), Bearing Capacity above
void: Effect of void shape on bearing capacity of strip footing, p. 11. Published by the Journal of
^ B ^ H "^ZZZZZZ/ZZZZZ^ Soil iprislTi • 'Temporary : • true arch' ^ 'ZZZZZZZZZZZZZ.
Figure 1.7
True arch behavior.
(McKelvey 111, 1994)
Source: This figure was taken from an article written by James A. McKelvey III (1994), The anatomy of
soil arching: Void develops beneath soil mass, p.321. Published by Geotextiles and
^ B ^
ifZZZZZZZZZZZZA
Plane: oif; e q u a l • s e t t l e m e n t •'••'•••
"fZZZZZZZZZZZZZ
Figure \.% Inverted arch behavior.
(McKelvey III, 1994)
Source: This figure was taken from an article written by James A. McKelvey III (1994), The anatomy of
soil arching: True soil arch collapses and the soil immediately above the void takes the shape of an inverted arch or catenary, p.321. Pubhshed by Geotextiles and Geomembranes, v 13, n 5, pp.
We^t
Ea^t
Typical GPR
Profile Locations
PI P2
asplialc
" (new over old)
parked auto
1 « i 5 i biidc coacrete air-filled buried utilities ••.Figure 1.9 Generalized cross section of the roadways profile.
(Hauser and Howell, 2001)
Source: This figure was taken from an article written by Ernest C. Hauser and Mark J. Howell (2001),
Ground penetration radar survey to evaluate roadway collapse in northern Ohio: Generalized cross section of the roadways profiled and the location of the main GPR profiles within the roadway, p.3. Symposium on application of geophysics to environmental and engineering
pa'v'emen' k = 13 k=l / / / A btari-ad dry sand k=ll,3 'V\|pa
Figure 1.1 0 Generalized cross section corresponding to the segment of the GPR data across the known void.
(Hauser and Howell, 2001)
Source: This figure was taken from an article written by Ernest C. Hauser and Mark J. Howell (2001),
Ground penetration radar survey to evaluate roadway collapse in northern Ohio: Generalized cross section of the roadways profiled and the location of the main GPR profiles within the roadway, p.6. Symposium on application of geophysics to environmental and engineering
V5 o t / l
N-^
O O n ?' p. P. td T ^ ^ i^a,lUU
^ « &, ^g
o/
G
s: <5buti
stl •S tu ^ bo S/I<7>V / •wrofile
^ S •ij i^jsft
<%;ofth
f^
L * 1—1 3 OX) bN -~. oHowe
"«ser
an
12 .t^ —• C D O a c ^ • 3 | « • — <L > 2 9 c ^ o " c ey t esti 1 an i^ g o i 2 g § 1 3 8 2 ^ ^ P « a . b •^ K > § s S?^ °
is S i c « oiind pen tion ofG geophys i i . . i * -e ) J 5 O , ^ C 001 ) ? dist cati o CM ~ • — ^ C « .2 1 o m.^ c 5 > C L1^^
" - S f~ : Haus e rofiled ment, p U C L s j Ernes tstreets hed pa\
>. ^ i * ^ - S a
ritten apof andp
^^ ^ u •. it artic l Ohio featu C C 1 J ca ~ o _ ^ c O 1 ; ? 3 * S a r- " - S figur e wa s take i way collapse in istribution of si lems , 7 p . ,^ 1 3 ^ . O •a « < u 2 H ~ - - 5 ^ iu o u d o (/2
EXPERIMENTAL PROGRA M
2.1 Genera l
The process of subsurface soil erosion and the effects induced on the ground surface is considered to be a complex geotechnical engineering problem and experimental investigations are limited. The design methods used by consulting engineers rely mainly on empirical or numerical analysis.
The objective of the experimental program is to investigate the performance of a slab-on-grade subjected to subsurface soil erosion. One of the challenges is to develop a method to simulate artificially a three dimensional void into granular materials and measure the corresponding ground response. Two cases were investigated, the case where the surface is free and the case where the surface is uniformly loaded. As for the latter, a rigid steel plate was used to simulate the concrete slab-on-grade. The results of this investigation allowed the calibration of a numerical model and rurming the analysis under full scale conditions.
In developing this experimental program, techniques that have been successful in tuimeling research were tested (Terzaghi, 1936; Terzaghi, 1943; Atkinson et al., 1975; Higawara et al., 1999; Sharma et al., 2001; Wu et Lee, 2003; Lee et al., 2006). However, some of them were found to be not accurate enough (repeatability and precision) to be taken in consideration. Finally, the physical model built consisted of a rigid steel tank to contain the sand, a mechanism to simulate one dimensional subsurface soil erosion and instrumentations to measure the ground response either when the surface is free or loaded.
The relevant parameters that need to be measured at the ground surface are listed as follow:
a. The settlement. b. The strain.
c. The surface contact pressure between the ground surface and the loading element. d. The effect of the void shape
The roadmap of this chapter is as follows. Section 2.2 will describe the steel tank built to contain the sand and all attempts used to simulate the formation of subsurface void. Those that were not successful will be described as well to explain the process that led to the final setup. Section 2.3, 2.4 and 2.5 describe the instrumentation, the specification of the materials used and the experimental procedure, respectively. Finally, results of the experimental investigation will be discussed in section 2.6.
2.2 Th e physical mode l
The physical model is composed of a rigid steel tank to hold the sand, a mechanism to simulate artificially subsurface soil erosion and a rigid steel plate for the loaded tests. The latter is described in the section 2.4, dedicated to the material properties. Some hypotheses have been made during the development of the experimental program:
a. The set up built represents a 2D problem (plane strain). b. The possible effects of the lateral boundaries were neglected. c. An ideal soil (silica dry sand) was used during the experiments.
2.2.1 Th e rigid bo x
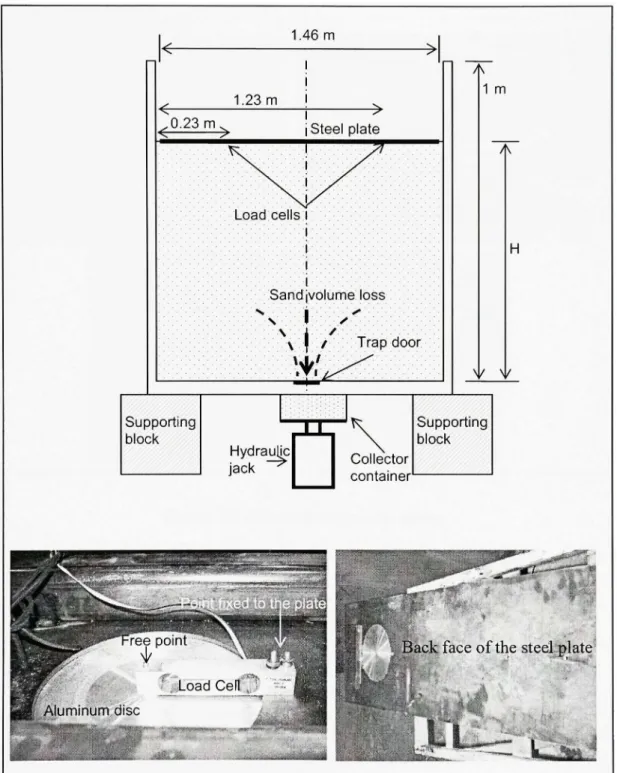
Figure 2.1 shows the (l"mxl.46'^'mx0.3^m) rigid rectangular tank buiU to hold the sand. The tank was made using 6 mm thick steel plates joined with 6 mm steel bolts. The rigidity of the tank is an important parameter since any deformation of the latter will influence the measurements that will be taken. To improve the rigidity, both the front and rear sides were reinforced with three 100 mm HSS sections. The front side had to be made of a colorless material to allow visual observations; a 6 mm Plexiglas sheet was then used. The intemal
sides of the tank were painted and lined with plastic sheets to reduce friction between the sand and the sides of the tank.
To simulate the unloading process due to subsurface void, the following techniques were investigated:
• Polystyrene foam and organic solvent • Pressurized air bag
• The trap door
Several experimental challenges were encountered when the first two methods were adopted; in particular problems related to test repeatability. For the sake of complement these methods are described in the following sections.
2.2.2 Polystyren e foa m an d organic solven t
This method was developed by Sharma and al. (2001) to simulate unloading due to excavation during a tunneling process. The technique is very straightforward. When polystyrene foam is exposed to an organic solvent it dissolves very quickly. This technique was adapted to our experiment by burying a half sphere of polystyrene into a tank full of sand. Acetylene was the dissolving agent used in this experiment. When the acetylene is injected and gets in contact with the polystyrene it dissolves leaving a half-spherical void in the soil (Figure 2.2). However, to avoid the mixing of the surrounding sand with the acetylene, the polystyrene was sealed with an impervious plastic wrap. Two hoses were also connected to the bag to introduce the acetylene and evacuate the gas generated by the chemical reaction (acetylene + polystyrene). The idea was abandoned after several trials for the following reasons:
a. The exact amount of acetylene was hard to introduce because of the chemical reaction between the acetylene and the polystyrene into the plastic wrap. This has led to a non complete dissolution of the polystyrene foam and a preferential movement of the sand.
b. Due to the pressure needed to introduce the acetylene, leakage from the plastic wrap was observed and could not be avoided. This may have changed the characteristics of the sand by the acetylene.
Following the same concept another combination (i.e. wax+ heat) was tested and showed little success because of the non uniform melting of the wax inside the void.
2.2.3 Pressurized air bag
Several researchers have used pressurized air bag to simulate subsurface voids in tunneling (e.g. Atkinson and al., 1975; Higawara and al., 1999; Wu and Lee, 2003; Lee and al., 2006). However, the first objective of this research had to be modified from a three dimensional to a two dimensional subsurface void shape. Figure 2.3 shows the different elements of the test setup. A rubber bag is inserted into a cylindrical steel net and buried into the sand. At the initial stress state, the bag is pressurized to fit the shape imposed by the cylinder and reach the overburden pressure. Unloading mechanism is then simulated by lowering the air pressure, allowing the movement of the sand particles into the cylinder through its nets. As shown in Figure 2.3, the air pressure is injected by a compressor through a hose, and controlled with a pressure gage. Two different rubber bag materials were used: stretchable commercial balloons and non-stretchable lined geotextile used in commercial shipping (Dunnage bags) sealed with a heat gun. Experiments were not successful because of the air leakage due to the amount of air pressure that had to be induced into the bag.
2.2.4 Th e trap doo r
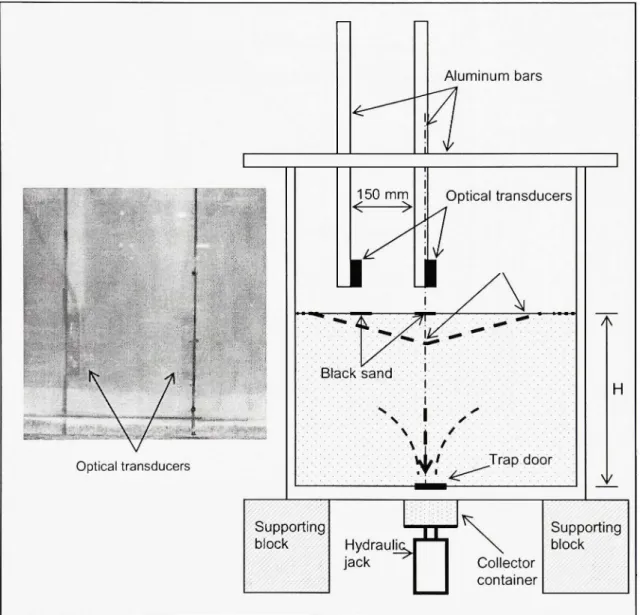
The trap door technique was first developed by Terzaghi (1936, 1943) to explain the arching theory. This technique was adopted to simulate a one dimensional soil loss below surface. The trap door consisted of two sliding plates whose movement can easily be controlled by a threaded bolt and nut mechanism. These sliding plates cover a rectangular opening at the base of the tank as shown in Figure 2.4. After several trials, a 5 mm opening was found to provide sufficient control over the sand movement. A collector container is placed under the opening to control the sand loss. When the collector container is full, no more sand is allowed to move out from the trap door and the test is considered complete. A total volume of 2670 cm of sand was removed from the bottom of the box in each test.
For the sake of convenience the vertical movement of the collector container that controls the sand volume loss was managed using a hydraulic jack.
2.3 Instrumentatio n
Measuring the soil response to subsurface volume loss has always been a challenge because of the cohesionless nature of the sand. As mentioned previously several parameters were planned to be measured at the surface but only some of them were found to be accurate enough to be taken in consideration. All the monitoring techniques investigated are described below.
2.3.1 Measurin g the displacemen t
Two optical displacement transducers were used to measure the displacement of the sand surface when unloaded (free surface). Two measurements were taken, one at the center line and the other at 150 mm from the center line. The transducers (BANNER LG5A65NIQ) can measure a displacement up to 150 mm. The results of the sensor calibration are plotted on Figure 2.5. It can be seen that the correlation between the voltage generated by the
transducer and the displacement measured are quite linear. The transducers are connected to the data acquisition unit and an extemal power supply to provide 15 V excitation. Each transducer is fixed to a steel bracket and screwed to an aluminum bar that can be lowered to within a certain distance above the sand surface. Since the laser generated by the optical transducers is reflected only on a dark surface, a small amount of sand was painted in black right where the laser aims. Figure 2.6 shows the details of the two optical displacement transducers and their installation at the top of the tank.
In addition to the displacement recorded using the optical transducers, manual measurements of the final width and depth surface profile were also taken.
2.3.2 Measurin g the contact pressur e
The redistribution of the contact pressure (vertical stress along the contact surface between the plate and the sand) is measured using load cells (SCAIM-AL5KG). The load cell has a strain gage glued all along its top surface and works as a cantilever. One end is fixed to the plate and the other is free to move through a hole made into the steel plate. The differential movement of the cell when the sand is removed from the tank induces a deformation to the strain gage and is converted to an equivalent load on the cell. An aluminum disk is screwed to the free end of the cell to increase the sand contact area. Two load cells have been placed at two chosen locations in order to allow for continuous contact with the sand surface during the duration of the test (Figure 2.7). A calibration needs however to be conducted since the cell measures loading and not pressure. A waterproof parallelepiped made of wood was built, whose base was constituted of the steel plate provided with the load cell. The whole device was immersed in a water reservoir at different depths (Figure 2.8). The loads measured by the cell at each depth were calibrated with the hydrostatic pressure (pgh). Where p, g and h are the density of the water, the gravity and the water elevation, respectively. The results of the calibration are plotted in Figure 2.9.
2.3.3 Th e data acquisitio n syste m
The signals recorded by the optical displacement transducers and the load cell were transmitted to an lOtech (Strain Book /616) data acquisition unit, connected to a Compaq Presario SR2170NX desktop computer (Figure 2.10).
2.4 Materia l propertie s
a) The san d
The experiments were conducted using an ideal soil (silica dry sand) commercialized by Quartz Industrial under the designation 2075. Results of the sieve analysis (Figure 2.11) according to the USCS standard indicated that the sand particles were coarse with little or no fines.
b) The steel plat e
For the loaded tests, a steel plate was used to simulate a rigid slab-on-grade. Consequently, two 50 mm HSS sections were welded all along the length of the plate to increase its rigidity. The length, width and thickness of the steel plate are 1.4 m, 0.3 m, 6x10' m respectively (Figure 2.12). The specifications based on the ASTM are summarized in Table 2.1.
Table 2.1
Tensile strength (MPa)
400-550
Steel plate specification (ASTM-A36)
Yield (MPa)
250
Young modulus (E) (MPa)
2x10^
Poisson ratio (u)
0.3
Weight (kg) 44.54
Source: Material property data, ASTMA36 Steel plate: Mechanical properties,
< http://www.matweb.com >, consulted on December 2007.
2.5 Experimenta l procedure
In order to have the same sand density for each test, an experimental procedure was
developed to fill the tank with sand. A plastic container (81.3 cm x 51.4 cm x 42.2 cm) was
used to fill the tank in several layers of 0,175 m in thickness. First, the plastic container is
filled from a reservoir where the sand is stored and placed at the top of the tank using a fork
lift. Then the sand is poured from the container into the tank, and manually graded into a
uniform layer. No compaction was applied and the same sequences were repeated for each
test to minimize potential inconsistencies. The placement procedure is repeated until the
sand surface reaches the desired height. Each test defined by its height required a sand
volume that corresponded to a number of containers as shown in Table 2.2.
Figure 2.13 shows a cart provided with three wheels that can be slid back and forth along
two rails welded at the top of the tank. An aluminum plate fixed vertically to the cart grades
the surface of the sand. This device was used to grad the last layer of sand as it needed to be
perfectly flat, in order to optimize the accuracy of the measures taken at the surface.
Once the tank is prepared into uniform layers, 2670 cm^ of sand are removed from the tank through the trap door. The above procedure is illustrated using a picture taken for each step in Appendix IV.
Two series of tests were conducted during the experimental program. The first series is conducted under unloading conditions (free surface) and composed of five tests of different heights (0.175 m, 0.34 m, 0.5 m, 0.64 m, 0.8 m). In this first phase, the movement of the surface profile was measured with the optical transducers and the final profile of the deflection was taken manually. For the loaded tests only one height (H = 0.8 m) has been chosen. This second series of tests was conducted under the same conditions; however a uniform load was applied at the surface by a rigid steel plate. The contact pressure was monitored at two specific points with a load cell and the final profile of the deflection was reported as well.
Table 2.2
Sand surface heights vs Number of containers