HAL Id: hal-02177061
https://hal.archives-ouvertes.fr/hal-02177061
Submitted on 8 Jul 2019HAL is a multi-disciplinary open access
archive for the deposit and dissemination of sci-entific research documents, whether they are pub-lished or not. The documents may come from teaching and research institutions in France or abroad, or from public or private research centers.
L’archive ouverte pluridisciplinaire HAL, est destinée au dépôt et à la diffusion de documents scientifiques de niveau recherche, publiés ou non, émanant des établissements d’enseignement et de recherche français ou étrangers, des laboratoires publics ou privés.
To cite this version:
Juan de Dios Rodriguez-Ramirez, Bruno Castanié, Christophe Bouvet. Analysis of nonlinear behavior on honeycomb cores. 21st International Conference on Composite Materials ( ICCM 21 ), Aug 2017, Xi’an, China. �hal-02177061�
ANALYSIS OF NONLINEAR BEHAVIOR ON HONEYCOMB CORES
J.D.D. Rodríguez Ramírez1-a, B. Castanié1-b, C. Bouvet1-c
1 Institut Clément Ader (ICA), Université de Toulouse, CNRS UMR 5312-INSA-ISAE-Mines
Albi-UPS, 3 Rue Caroline Aigle, 31400 Toulouse, www.institut-clement-ader.org
a[email protected], b [email protected], c [email protected]
Keywords: Honeycomb, Shear testing, Buckling, Artificial neural network
ABSTRACT
This work presents the results of 21 shear tests on three types of honeycomb cores: the HRH-78-3/16-3.0, HRH-10-3/16-6.0 and an aluminium honeycomb core made of 5052 alloy with 3/8” cells. First, a benchmark of the different designs for shear testing of the honeycomb cores is made. Then, several double lap specimens were fabricated and tested while a 3D image correlation system was used to record the tests. An experimental analysis of the post-buckling phenomena of the HRH-78 W is presented. An artificial neural network is developed and used to visually identify the buckles of the test specimens. Finally, a detailed description of the behaviour of the structure including the postbuckling scenario is presented.
1 INTRODUCTION
Sandwich structures are widely used in many industrial applications like acclimated transportation, aircrafts, aerospace, naval, civil engineering, fluid storage, electronics, etc. These structures offer an exceptional benefit when they are used in aeronautics. The incorporation of this technology into the aircraft structures has proved to be a great solution for mass reduction problems due to their important bending stiffness and low weight, which allows to design lightweight parts.
When a bending load is applied to these panels, the core absorbs almost all the shear component of the force, therefore the shear properties of the core are indispensable for the sandwich design.
Several interesting publications have been made about the modelling of honeycomb cores [1],[2],[3]. This work is a contribution to the understanding of the nonlinear response of honeycomb cores under shear loads. Several experimental tests will be made to describe in detail the scenario before and after the buckling of the honeycomb cells.
2 BENCHMARK STUDY OF SHEAR SPECIMENS
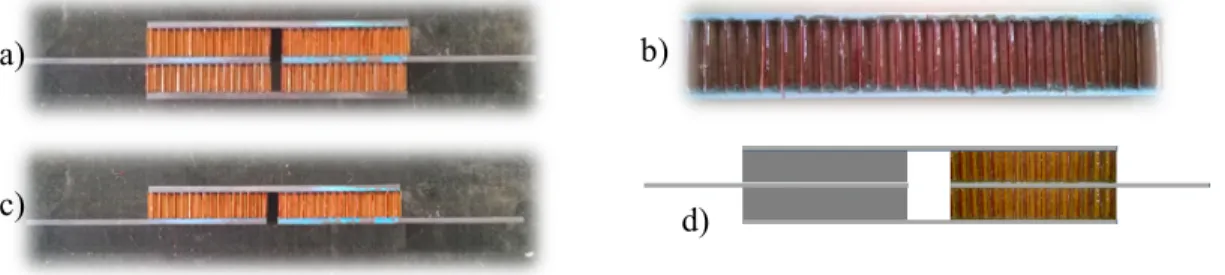
Four different types of specimens were fabricated and tested to observe the different advantages that each design offers to study the shear properties of a honeycomb material. The aim was to select a design that fits the best to obtain the following features: The average shear stress vs. gamma curve, the shear modulus of the core, the maximal average shear stress of the core, observe the evolution of the nonlinear behavior of the structure, observe the evolution of buckles in the structure, a specimen which fabrication is simple and allows to obtain repetitiveness of the results.
2.1 Tests specimens
All the specimens were fabricated using the HRH-78-3/16-3.0 Nomex honeycomb core. According to [4] the W direction shear modulus is 24.13 MPa and the shear strength is 0.558 MPa. For the L direction, the shear modulus is 31.71 MPa and the shear strength is 0.8549 MPa.
A sandwich beam three-point specimen (Fig. 1) was fabricated. When a load is applied to sandwich beam, the core is submitted almost entirely to shear stresses while the skins absorb the flexural components. Therefore three-point sandwich beams are very often used for shear testing of honeycomb cores. The core was made of the HRH-78-3/16-3.0 Nomex L direction of 20 mm of thickness, the skins where made of aluminum of two mm of thickness. The size of the specimen was of 20mm x 20 mm x 160 mm, finally the length span was of 140 mm.
A double single lap specimen (Fig. 1) was fabricated. This specimen submits the core to shear but also to flexural stresses due to the significant thickness of the core, however the fabrication is simple.
The core is made of HRH-78-3/16-3.0 Nomex W direction of 20 mm of thickness, the skins were made of aluminium of 5 mm of thickness to minimize the flexural deformations.
A double lap specimen (Fig. 1) was also fabricated. As for the previous specimen, this specimen submits the core to shear stress, while the flexural forces are dissipated due to the symmetry of the specimen. The core is made of HRH-78-3/16-3.0 Nomex W direction of 20 mm of thickness, the skins where made of aluminum of 5 mm of thickness.
A two materials double lap specimen (Fig. 1) was also fabricated. This specimen is very similar to the previous one, but two materials are used instead of only the Nomex core. The purpose is to use as secondary material a which is much stronger to concentrate the shear forces on the principal material. The used materials are the HRH-78-3/16-3.0 Nomex W direction honeycomb and plywood, both of 20 mm of thickness, the skins were made of aluminium of 5 mm of thickness.
Figure 1: Different types of specimens: a) Double lap, b) Three-point sandwich beam, c) Double single lap, d) Two-materials double lap
2.2 Results and discussion
All the specimens were tested using a 10 KN Instron machine. The force was recorded from the corresponding signal of the machine, the displacement was measured in two different ways; using a LDVT displacement sensor and using a 3D digital image correlation system (DIC). The average shear stress and gamma are calculated from the applied force, the dimensions of the specimens and the displacement field. The curves are shown in figure 2.
The beam specimen is very simple to fabricate but the results are not very accurate, this can be caused by several factors such as the positioning on the specimen in the setup, causing significant variations when the displacement is measured using the 3D correlation system. This can be compensated by using another technique to measure the displacements, but this should add more complexity to the test setup. The evolution of the buckles is visible, but the imposed displacement creates some difficulties when measuring the displacement field, thus the cells must be inspected one by one which is not practical. The cells near the applied loads are submitted also to compression forces, thus collapsing earlier.
The double single lap specimens are simple to fabricate but the results are not as expected, the effect of the flexural forces is very strong (Fig. 2) and the results are not significant. This effect can be avoided by adding articulations at each end of the specimen, however this will make add some complexity to the fabrication procedure and test setup.
The best results are obtained by the double lap and two-material double lap specimens, the experimental results are reasonably correct. Also, the displacement field can be easily measured. In the other hand, failure of the double lap specimen can aleatorily occur on both sides of the specimen.
For the two-material specimen, failure happens in the honeycomb side because the material is weaker. However, the global shear strength of the honeycomb is weaker than expected, this can be caused by the difference of shear modulus, thus the gamma evolution between the two materials.
b)
d) a)
Figure 2: Test results: a) Average shear stress vs gamma curves, b) Buckling of the double single lap specimen, c) Buckling of the sandwich beam, d) Buckling o the double lap specimen
In conclusion, the specimen design that fits the best for our research is the double lap specimen. To ensure the failure of the specimen in the desired section, one side will be fabricated whit a lightly inferior length, thus increasing the average shear stress in the short side and causing the failure without inducing a significant variation on the measurements.
3 SHEAR TESTING OF HONEYCOMBS
Once the specimen design was selected, the next step was to fabricate the specimens to study the properties of the HRH-78 3/16-3.0, HRH-10-3/16-6.0 and aluminum 5052 3/8. The study will be in both directions L and W. Additionally, two kinds of test are to be performed, a static test to determine the overall shear nonlinear response and a cyclic test to analyse the elastic and postbuckling domain and of the honeycomb structure under shear forces. To get reliable results and check the reproducibility of the obtained data, every experiment will be reproduced three times. This gives a total of 12 different test conditions (3 types of honeycombs x 2 directions x2 types of tests) reproduced three times resulting in a total of 36 tests.
3.1 Tests on the HRH78 Nomex core
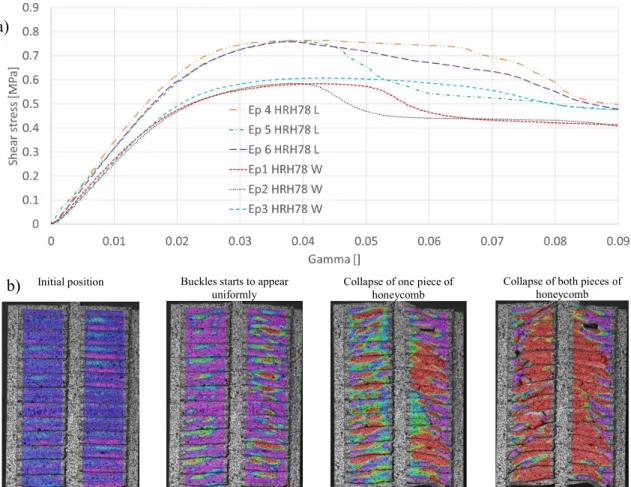
For this purpose, 3 specimens of each direction W and L of the honeycomb core HRH-78 were tested, the average shear stress and gamma are extracted and plotted in figure 3. The average shear modulus of the W and L directions where of 25 MPa and 32 MPa and the maximal shear stress were of 0.58 MPa and 0.75 MPa respectively. The failure scenario is shown in figure 3 and was the same for the 6 specimens, it begins with an accentuated deformation of the side whit the smaller area, then there is a big collapse of only one Nomex piece, finally the other one collapses too.
a)
Initial position Buckles starts to appear
uniformly Collapse of one piece of honeycomb
Collapse of both pieces of honeycomb
Figure 3: Test results: a) Average shear stress vs gamma curves, b) Failure scenario of the double lap specimen
Six more specimens were submitted to charging and discharging conditions. At every cycle the maximal imposed displacement was slightly increased to be able to identify the average shear stress when the material starts to be damaged. It is very difficult to show all the 6 curves of each specimen because of the amount of data, however the envelope curves are very similar to those of the figure 3, so only one curve is plotted in figure 4. The cyclic tests revealed that there is a significant decrement in the loading slope after passing the 0.52 MPa in the W direction and 0.65 MPa for the L direction. This could mean that at this point, the honeycomb structure is irreversibly damaged.
Figure 4: Average shear stress vs gamma of a cyclic tests Ep7 vs Ep3
a)
3.2 Tests on the HRH10 Nomex core
Twelve specimens were fabricated using the HRH-10-3/16-6.0 but only three specimens in the W direction were tested, the failure mode was the debonding of the honeycomb/skins interface, instead of the collapse of the cells as desired. This may be caused by the quality of the redux 609 that was used to fabricate the pieces, or due to the fact that several curing were made. The failure does not happen in the section with the smallest area. The test results don’t give any important information beside the shear modulus which is 45 MPa see figure 5.
Figure 5: Average shear stress vs gamma of the HRH-10 specimens, the failure mode was debonding. 3.3 Tests on the aluminum 5052 honeycomb core
Twelve specimens were fabricated using the aluminium honeycomb core, but only two specimens in the W direction were tested (Fig 6). The same failure mode of the tests on the HRH10 was found, debonding of the core/skin interface arrives before the collapse of the cells.
Figure 6: Average shear stress vs gamma of aluminum honeycomb specimens, the failure mode was debonding.
4 ANALYSIS OF THE POST-BUCKLING PHENOMENA OF THE HRH-78 IN W DIRECTION
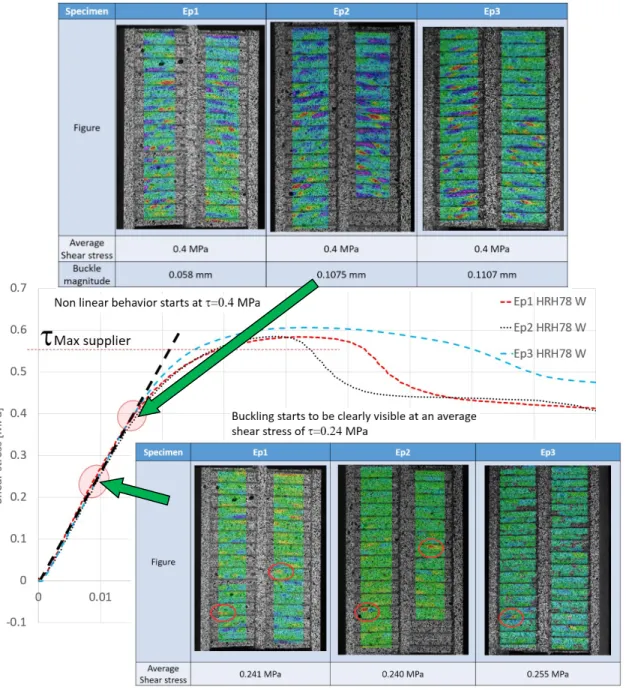
Using the 3D correlation system, it is possible to look from closer the buckling evolution at the exterior surface of the honeycomb cores. The magnitude of the deformation out of the plane of the buckles varies proportionally to gamma. Also, it can be seen that there are buckles that go out and others that go inside of the structure. The local buckles start to be visible at an average shear stress of 0.24 MPa, and they grow and expands until they are big enough to cause the nonlinear behavior of the curves, finally they are so big that cause the collapse of the cells (Fig. 7).
4.1 Setting the scale for the analysis
An inspection of the recorded images of the three specimens was made when the applied stress was 0.4 MPa (Fig 7), which is also where the nonlinear behaviour start. We made the hypothesis that the buckles that are formed at this point are big enough to affect the stability of the honeycomb, thus changing the loading slope, the average size of the buckles was 0.1054 mm. It was seen that the buckles that goes out of the structure doesn’t grow, while the buckles that go inside the structure continue to grow and propagate until the cells collapses.
Using the previous information, the scale of the recorded images of the three specimens was modified, the deformation was measured between 0 mm and -0.1024 mm. This allowed to see that the collapse of the cells is caused by the creation of local buckles but also due to the propagation of the collapse of the surrounding cells, thus the cells do not necessarily collapse all at the same time.
This could mean that the change in the slope is related to the collapse of the cells and not directly to the buckles, even if the collapse of the cells is related to the local buckles.
4.2 Analysis of the images by an artificial neural network
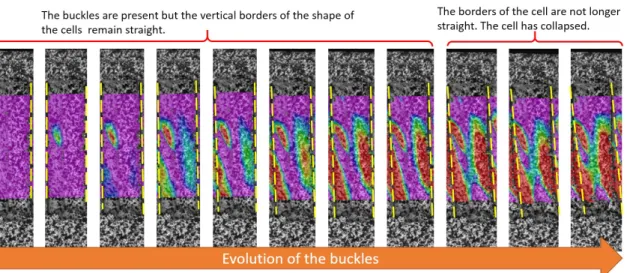
A more detailed analysis of the videos was necessary, the cells must be analysed to determine when they are collapsed and how much influence does this have on the global behavior of the structure. In figure 8 the evolution of the collapse of one cell is shown. The buckles stop to grow once when the vertical borders of the cell are no longer straight in the middle. We considered that the collapse of the cell can be determined by monitoring the growing of the buckles in the cell.
Figure 8: Buckling evolution of a cell
To study the collapse of the cells of the specimens approximately 13,334 images needed to be analysed to which represent a big complexity and could lead to subjective inaccuracies if the analysis is performed by a person.
An artificial neural network (ANN) was developed to do the task, this reduced the time of analysis and provides at the same time an objective method to detect when a cell is collapsed.
A pre-treatment of the images was performed on every frame of the videos. First, the cells were cut from all the frames. Then all the cells images where reshaped to the same number of pixels. After this, a color segmentation filter was applied to focalize the analysis in the red tonalities.
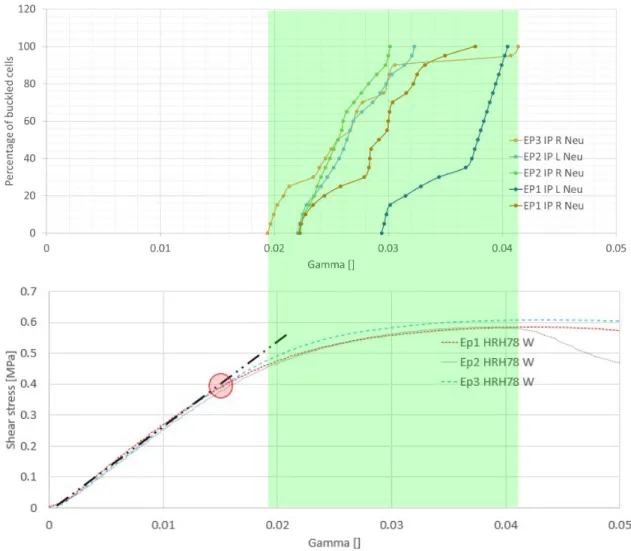
The ANR was trained with 29 examples of buckled cells and 50 examples of non-buckled cells that were selected by the author. The ANN was able to classify all of them correctly. The results of the analysis are shown in percentage of buckled cells vs gamma. Both sides of every specimen are analysed. The results are shown in figure 9. The analysis revealed that the nonlinear behavior is certainly related to the buckling of the cells. However, the nonlinear behaviour starts before any cell was detected to be collapsed.
5 CONCLUSIONS
The formation of buckles in the honeycomb walls is caused by two factors, the displacements of the skins, and because the honeycomb structure is stabilized (clamped) by the skins. A detailed description of the evolution of deformations of the HRH-78 Nomex honeycomb core can be made.
From 0 MPa to 0.24 MPa the magnitude of the buckles is very small, almost undetectable. Form 0.24 MPa to 0.4 MPa the buckles start to be clearly visible without affecting the linear behaviour of the honeycomb structure. The formations of buckles in the honeycomb could be seen as a way to store mechanical energy like a spring (if the buckles remain totally elastic).
Figure 9: The collapse of the cells is related to the reduction of the shear properties.
From 0.4 to 0.46 MPa the average shear stress vs. gamma curve indicates a strong nonlinear behavior. The cyclic tests presumably indicated that the honeycomb structure remains elastic even if the nonlinear behavior is present. No collapsed cells are detected at this point, so the start of nonlinear behavior can be attributed to the formation of local buckles in the cells.
From 0.46 MPa to 0.52 MPa the buckles are big enough to cause instability of some cells and they start to collapse. However, the cyclic test indicates that the structure remains elastic. This could mean that the buckles of the Nomex paper are still in the elastic domain or that the plastic deformations are very small or not important enough to cause a significant damage of the structure.
Form 0.52 MPa to 0.59 MPa the cyclic test indicates that the structure is permanently damaged. The deformation of the cells is propagated and they continue to collapse. The maximal average shear
stress is presumably reached when all the cells are collapsed. At this point the Nomex paper is teared at some regions.
ACKNOWLEDGEMENTS
This research was developed at the ICA laboratory at Toulouse France and was co-financed by the CONACYT form Mexico.
REFERENCES
[1] P. Bunyawanichakul, B. Castanié, and J.-J. Barrau, “Non-linear finite element analysis of inserts in composite sandwich structures,” Compos. Part B Eng., vol. 39, no. 7–8, pp. 1077– 1092, Oct. 2008.
[2] P. Bunyawanichakul, B. Castanie, and J. J. Barrau, “Experimental and numerical analysis of inserts in sandwich structures,” Appl. Compos. Mater., vol. 12, no. 3–4, pp. 177–191, 2005. [3] R. Seemann and D. Krause, “Numerical Modeling of Nomex Honeycomb Sandwich Cores at
Meso-Scale Level,” Compos. Struct., 2016.