HAL Id: tel-03131374
https://tel.archives-ouvertes.fr/tel-03131374
Submitted on 4 Feb 2021
HAL is a multi-disciplinary open access
archive for the deposit and dissemination of sci-entific research documents, whether they are pub-lished or not. The documents may come from teaching and research institutions in France or abroad, or from public or private research centers.
L’archive ouverte pluridisciplinaire HAL, est destinée au dépôt et à la diffusion de documents scientifiques de niveau recherche, publiés ou non, émanant des établissements d’enseignement et de recherche français ou étrangers, des laboratoires publics ou privés.
Leveraging genome-wide association studies data to
inform the biology behind the genetic risk for mitral
valve prolapse
Mengyao Yu
To cite this version:
Mengyao Yu. Leveraging genome-wide association studies data to inform the biology behind the genetic risk for mitral valve prolapse. Genetics. Université Sorbonne Paris Cité, 2019. English. �NNT : 2019USPCB043�. �tel-03131374�
Université Paris Descartes
ED562Paris-Cardiovascular Research Center (PARCC)
Equipe : « Approches génétiques pour comprendre les maladies artérielles »
Exploitation des données issues d'études d'association
pangénomiques pour caractériser les voies biologiques associées au
risque génétique du prolapsus de la valve mitrale
Leveraging genome-wide association studies data to inform the biology
behind the genetic risk for mitral valve prolapse
Par Mengyao Yu
Doctorat en Génétique
Dirigée par Nabila BOUATIA-NAJI
Présentée et soutenue publiquement le 18 Juin 2019 Devant un jury composé de :
Dr. Jean-Charles LAMBERT Rapporteur
Dr. Stéphane ZAFFRAN Rapporteur
Dr. Fabienne LESUEUR Examinateur
Pr. Elisabeth TOURNIER-LASSERVE Examinateur
1 | P a g e
Acknowledgment
Firstly, I would like to acknowledge my supervisor Dr. Nabila Bouatia-Naji who offered the precious opportunity to me to start an interesting topic in human genetics on cardiovascular diseases. I am lucky to have such a responsible, affinitive and brilliant researcher as my supervisor. During the Ph.D. study, she trained me with the target of being a good researcher with her broad vision and rich experience. She kept me in the right direction during my study with her great patience, by sharing many valuable ideas and placing her great trust in me. I appreciate all the chances that she has offered to learn how to think and behave like a scientist, such as supporting me to attend international conferences during my training, teaching me how to share my work with the experts in the field and guiding me to write a qualified research article. She has always been a great supporter of my research work and life.
I am grateful to Dr. Lambert Jean-Charles and Dr. Zaffran Stéphane for accepting to review my thesis and for carefully reading and commenting on the manuscript. I thank Fabienne Lesueur and Elisabeth Tournier-Lasserve for taking the time to examine my work.
I would like to thank Dr. Adrien Georges and Dr. Sergiy Kyryachenko, who helped me to overcome difficulties in my work with their valuable opinions. Thank many discussions with Pr. Xavier Jeunemaitre, Dr. Aurelie Morin, Ms. Judith Goncalves, Ms. Yujiao Zhang, my presentation skills got improved. I would like to thank Dr. Soto Romuald Kiando, who helped me to start the GWAS analysis at the beginning of my thesis. I would like to express my gratitude to the collaborators in the MVP project, especially Dr. Russell A. Norris and Dr. Francesca N. Delling, who provided me a great opportunity to participate in other MVP related works. I would like to thank Pr. Albert A. HAGEGE for providing me a recommendation letter. Of course, the success of my work in the Paris Cardiovascular Research Center (PARCC) is inseparable from the wonderful people I have met in the past four years. I would never forget how my friends helped me when I first came to French, I would remember every “soirée” after the work and “retrait”. All the valuable experiences that happened in PARCC are deeply printed in my memory and they will always be with me.
2 | P a g e In the end, I would like to thank my husband for his meticulous care and support. Without him, I would not come to Paris, I would not have the opportunity to become a young researcher and would not encounter so many excellent people and things. It is him who makes our life wonderful. We are looking forward to a new chapter of our lives, but we will never forget the life in Paris.
3 | P a g e
Abstract
Mitral valve prolapse (MVP) is a common heart valve disease affecting nearly 1 in 40 individuals in the general population. It is the first indication for valve repair and/or replacement and moreover, a risk factor for mitral regurgitation, an established cause of endocarditis and sudden death. MVP is characterized by excess extracellular matrix secretion and cellular disorganization which leads to bulky valves that are unable to coapt correctly during ventricular systole. Even though several genes including FLNA, DCHS1 TNS1, and LMCD1 were reported to be associated with MVP, these explain partially its heritability. However, understanding the biological mechanisms underlying the genetic susceptibility to MVP is necessary to characterize its triggering mechanisms.
In this thesis, I aimed 1) to characterize globally the biological mechanisms involved in the genetic risk for MVP in the context of genome-wide association studies (GWAS), and 2) improve the genotyping resolution using genetic imputation, which allowed the discovery of additional risk genes for MVP.
In the first part of my study, I applied pathway enrichment tools (i-GSEA4GWAS, DEPICT) to the GWAS data. I was able to show that genes at risk loci are involved in biological functions relevant to actin filament organization, cytoskeleton biology, and cardiac development. The enrichment for positive regulation of transcription, cell proliferation, and migration motivated the follow-up of GLIS1, a transcription factor that regulates Hedgehog signaling. I followed up the association with MVP in a dataset of cases and controls from the UK Biobank and, in combination with previously available data, I found a genome-wide significant association with MVP (OR=1.22, P=4.36 ×10⁻¹⁰). Through collaborative efforts, immunohistochemistry experiments in mouse indicated that Glis1 is expressed during embryonic development predominantly in nuclei of endothelial and interstitial cells of mitral valves, while Glis1 knockdown using morpholinos caused atrioventricular regurgitation in zebrafish.
In the second part of my work, I generated larger genotyping datasets using an imputation based on HRC and TOPMed, two large and highly dense imputation panels that were recently made available. I first compared the imputation accuracy between data using HRC and TopMED and found that both panels have low imputation accuracy for the rare allele (MAF<0.01). However, the imputation accuracy increased with the input sample size for common variants (MAF>0.05), especially when genotyping platforms were harmonized. I was able to fine map established loci (e.g Chr 2) and also able to identify six novel and promising associated loci. All new loci are driven by common variants that I confirmed as high profile regulatory variants through extensive computationally-based functional annotations at promising loci that pointed at several candidate genes for valve biology and development (e.g PDGFD and ACTN4).
In summary, my Ph.D. work applied up-to-date high throughput genetic association methods and functional enrichment and annotation to GWAS data. My results provide novel insights into the genetics, molecular and cellular basis of valve disease. Further genetic confirmation through replication, but also through biological experiments are expected to consolidate these statistically and computationally supported results.
Keywords: GWAS, heart valve disease, valve development, mitral valve prolapse, enrichment analysis, imputation
5 | P a g e
Résumé
Le prolapsus de la valve mitrale (MVP) est une valvulopathie fréquente qui touche près de 1 personne sur 40 dans la population générale. De nombreux gènes comme FLNA, DCHS1 pour les formes familiales et TNS1 et LMCD1 pour les formes sporadiques ont récemment été décrit comme associés au MVP. Cependant, les défauts génétiques touchant ces gènes n’expliquent pas tous les cas du MVP. De plus, les mécanismes biologiques expliquant la susceptibilité génétique au MVP, notamment pour les formes sporadiques les plus fréquentes restent mal compris.
Dans cette thèse, mon objectif était 1) de caractériser globalement les mécanismes biologiques impliqués dans le risque génétique du MVP dans le contexte des études d'association pangénomique (GWAS), et 2) d’améliorer la résolution du génotypage par l’imputation génétique et par l’addition d’une nouvelle étude cas témoins, (UKBioBank) afin de permettre la découverte de nouveaux loci de prédisposition.
Dans la première partie de mon travail de thèse, j'ai appliqué des outils d'enrichissement de voies biologiques ou sets de gènes aux données GWAS. J'ai pu montrer que les gènes présents autour des loci GWAS sont impliqués dans l'organisation des filaments d'actine, l’organisation du cytosquelette et le développement cardiaque, ce qui était attendu. Nous avons également décrits le gène GLIS1. Afin de confirmer le rôle de GLIS1 dans l'association avec le MVP, j’ai réalisé une analyse génétique dans une étude case témoins (UKBiobank) et, en combinaison avec les données françaises, l’association a atteint le seuil de significativité génomique (P = 4,36 × 10 -10). En collaboration avec des équipes américaines, des expériences d'immunohistochimie ont indiqué que Glis1, la protéine orthologue de la souris est exprimée au cours du développement embryonnaire. D’autre part, l’inactivation de Glis1 à l'aide d’oligonucléotides de type Morpholinos ont été l’origine d’une régurgitation atrio-ventriculaire chez le poisson zèbre.
Dans la deuxième partie de mon travail, j'ai généré des données de génotypage plus dense à l’aide d’une imputation basée sur HRC et TOPMed, deux panels d’imputation ultra-dense récemment mis à disposition de la communauté internationale. J’ai d’abord comparé la précision d’imputation entre les données utilisant les différents panels et constaté qu’aucun panel n’atteignait une précision optimale pour les variants rares (MAF <0,01) dans nos échantillons. La précision d'imputation s’améliorait pour les variants fréquents (MAF> 0,05), en particulier pour les cohortes dont le génotypage étaient réalisé avec des puces identiques. J'ai pu ainsi cartographier avec plus de précision les loci déjà confirmés (ex. Chr 2 autour de TNS1). J’ai également identifié 6 nouveaux loci associés au MVP prometteurs. L’annotation fonctionnelle fine à l’aide de données publiques a indiqué leurs rôle potentiels dans la régulation transcriptionnelle de plusieurs gènes candidats en (ex. PDGFD et ACTN4).
En résumé, mes travaux de thèse ont apporté des résultats génétiques originaux mettant en lumière de nouveaux mécanismes biologiques en rapport avec la biologie et le développement de la valve. Mes travaux ont également été renforcés par des validations dans des modèles animaux en collaboration. Il sera nécessaire toutefois de confirmer par réplication, et potentiellement par des expériences biologiques, les résultats nouveaux issus des travaux d’imputation haute densité afin de déclarer ces nouveaux gènes de prédispositions au MVP. Mots-clés: GWAS, maladie de la valve cardiaque, développement de la valve, prolapsus de la valve mitrale, analyse d'enrichissement, imputation
7 | P a g e
Table of Contents
Acknowledgment ... 1 Abstract ... 3 Résumé ... 5 Publications ... 11List of Abbreviations and Acronyms ... 13
List of Figures ... 15
List of Tables ... 16
Part I – General introduction... 17
1 Chapter 1 – The study of Human genetics ... 19
1.1 Detecting human genetic variability ... 19
1.1.1 The human genome and related sequencing projects ... 19
1.1.2 Next-generation sequencing and its applications ... 21
1.1.3 SNPs genotyping ... 23
1.2 Population genetics ... 24
1.3 Genetic epidemiology ... 25
1.3.1 Linkage analysis ... 25
1.3.2 Genetic association analysis -- Population studies ... 27
1.3.2.1 Select SNPs for genotyping... 28
1.3.2.2 Key steps in GWAS -- Phasing and imputation ... 30
1.3.2.3 Phasing and pre-phasing... 31
1.3.2.4 Reference panels ... 32
1.3.2.5 Imputation ... 32
1.3.3 Association analyses and applications ... 34
1.3.4 Multiple testing ... 35
1.3.5 GWAS based Meta-analyses ... 36
8 | P a g e
1.4 Strategies to extract biological functions from GWAS findings ... 38
1.4.1 In silico annotations and enhancers annotations, eQTLs …etc ... 38
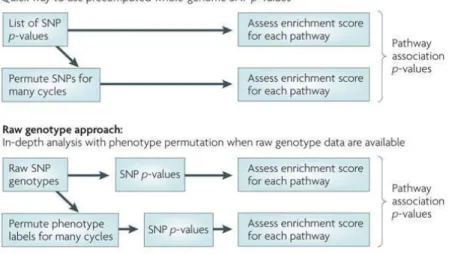
1.4.2 Pathway-based analysis using GWAS summary data ... 40
1.4.2.1 Pathway databases ... 41
1.4.2.2 Input data for pathway analysis ... 42
1.4.2.3 Gene mapping ... 43
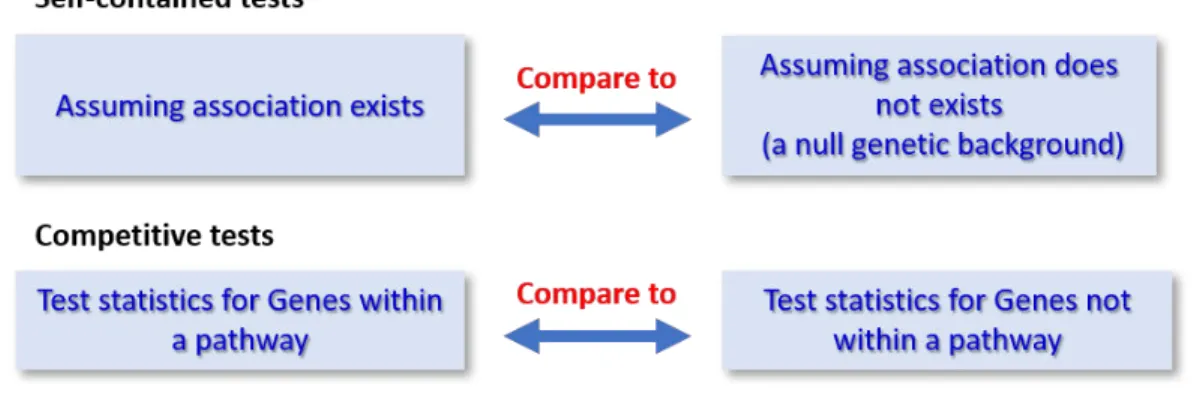
1.4.2.4 Calculations methods of statistics in pathway enrichment analyses ... 44
1.4.2.5 Multi-omics data based pathway analysis ... 45
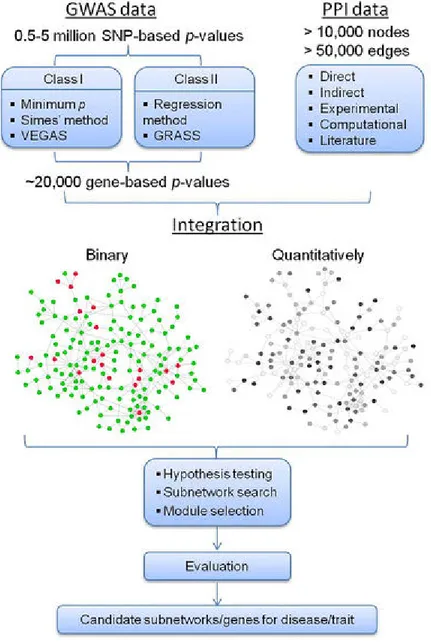
1.4.3 Network analysis for GWAS data ... 46
2 CHAPTER II – The studies of heart valve diseases ... 49
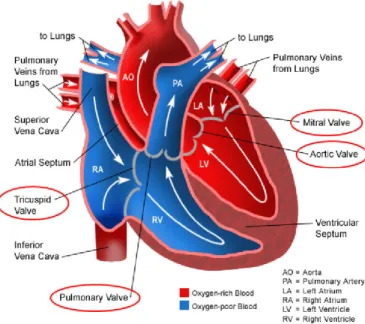
2.1 The structure of human heart valves ... 49
2.2 Aortic valve diseases ... 51
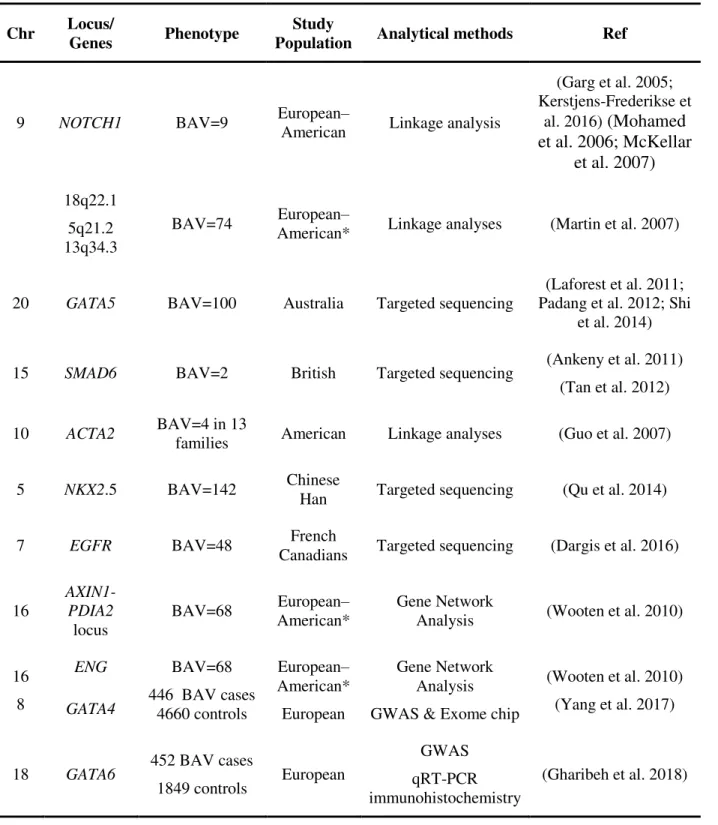
2.2.1 Genetics of bicuspid aortic valve ... 52
2.2.2 Genetics of calcific aortic valve stenosis ... 54
2.3 Mitral valve Diseases ... 56
2.3.1 Diagnosis approaches ... 58
2.3.2 Mitral valve structure ... 58
2.3.3 Mitral valve development, growth, and aging... 61
2.3.4 Genetics of MVP ... 63
2.3.4.1 Genetics of syndromic MVP ... 64
2.3.4.2 Family studies on non-syndromic MVP... 66
2.3.4.3 Genetics of non-syndromic MVP -- GWAS ... 67
Objectives of the thesis ... 73
PART II ... 75
Leveraging genome-wide association studies data to inform the biology behind the genetic risk for mitral valve prolapse ... 75
1 CHAPTER 1 – GWAS-Driven enrichment analyses to understand the biology behind genetic association with MVP ... 77
9 | P a g e
1.2 Article 1 ... 79
2 CHAPTER 2 – Using imputation and UKBiobank to identify new MVP risk loci ... 81
2.1 Main results ... 81
2.2 Article 2 ... 83
PART III -- General discussion and Perspectives... 85
1 CHAPTER 1 – Discussion ... 87
1.1 From GWAS to diseases related pathways (pathway-driven results) ... 87
1.2 Improve the resolution of GWAS by fine mapping using imputation ... 90
1.3 Gene-based association analysis ... 90
1.4 Functional annotations ... 91
1.5 Limitations of GWAS analysis ... 92
2 CHAPTER 2 -- Perspectives ... 95
REFERENCES ... 97
Appendix A ... 115
Appendix B ... 156
11 | P a g e
Publications
*Joint first authors.
1. Mengyao Yu, Adrien Georges, Nathan R Tucker, Sergiy Kyryachenko, Katelyn Toomer, Jean-Jacques Schott, Francesca N Delling, Patrick T Ellinor, Robert A Levine, Susan A Slaugenhaupt, Albert A Hagege, Christian Dina, Xavier Jeunemaitre, David J Milan, Russell A Norris, Nabila Bouatia-Naji. GWAS-driven Pathway Analyses and Functional Validation Suggest GLIS1 as a Susceptibility Gene for Mitral Valve Prolapse. Circulation: Genomic and Precision Medicine; accepted to published online 23rd April (https://www.ahajournals.org/doi/10.1161/CIRCGEN.119.002497) Other publication: bioRxiv 433268; doi: https://doi.org/10.1101/433268
2. Katelynn Toomer*, Mengyao Yu*, Diana Fulmer*, Lilong Guo, Kelsey Moore, Reece Moore, Ka’la Drayton, Janiece Glover, Neal Peterson, Sandra Ramos-Ortiz, Alex Drohan, Breiona J. Catching, Rebecca Stairley, Andy Wessels, Joshua H. Lipschutz, Francesca N. Delling, Xavier Jeunemaitre, Christian Dina, Ryan L. Collins, Harrison Brand, Michael E. Talkowski, Federica del Monte, Rupak Mukherjee, Alexander Awgulewitsch, Simon Body, Gary Hardiman, Starr E. Hazard, Willian Da Silveira, Baolin Wang, Maire Leyne, Ronen Durst, Roger Markwald, Solena Le Scouarnec, Albert Hagege, Thierry Le Tourneau, Peter Kohl, Eva Rog-Zielinska, Patrick T. Ellinor, Robert A. Levine, David Milan, Jean-Jacques Schott,Nabila Bouatia-Naji, Susan Slaugenhaupt, Russell A. Norris. Primary Cilia Defects Cause Mitral Valve Prolapse; Science Translational Medicine; accepted in principle.
3. Hafid Ait-Oufella*, Mengyao Yu*, Adrien Georges, Jeremie Joffre, Maire Vandestienne, Amir Boufenzer, Sébastien Gibot; Marc Derive, Nicolas Danchin, Tabassome Simon, Nabila-Bouatia-Naji. Genetic determinants of soluble TREM-1 plasma levels in major adverse cardiovascular events prediction: FAST-MI 2010 study, in preparation to Circulation: Genomic and Precision Medicine
Communications
Invited presentation
• The European Society of Cardiology (ESC)Congress. 25-29 August 2018. Munich, Germany
12 | P a g e Oral and poster presentations
• M. Yu, C. Dina, N. Tucker, F. Delling, S.A. Slaugenhaupt, R.A. Levine, A.A. Hagège, J. Schott, X. Jeunemaitre, D. Milan, R. Norris, N. Bouatia-Naji: GWAS-driven Pathway Analyses and Functional Validation Reveals GLIS1 Predisposes to Mitral Valve Prolapse. American Heart Association (AHA) Scientific Sessions, New Orleans, Louisiana, United States, 2016 (Oral Presentation)
• M. Yu, C. Dina, N. Tucker, F. Delling, S.A. Slaugenhaupt, R.A. Levine, A.A. Hagège, J. Schott, X. Jeunemaitre, D. Milan, R. Norris, N. Bouatia-Naji: GWAS-driven pathway analyses and functional studies reveals GLIS1 to predispose to mitral valve prolapse. 27th European Days of the French Cardiology Society, Paris, France, 2016 (Poster)
• M. Yu, C. Dina, N. Tucker, F. Delling, S. Slaugenhaupt, R. A. Levine, A. A. Hagège, J. Schott, X. Jeunemaitre1, D. Milan, R. Norris, N. Bouatia-Naji: GWAS-driven pathway analyses and functional studies reveal GLIS1 to predispose to mitral valve prolapsed. The American Society of Human Genetics (ASHG) 2017 Annual Meeting, Orlando, United States, 2017 (Poster)
• M. Yu, Z. Alsalman, J. Schott, A. Hagege, X. Jeunemaitre, C. Dina, N. Bouatia-Naji: Up-dated Genome-Wide Association Study and Functional Annotation Reveal New Risk Loci for Mitral Valve Prolapse. The American Society of Human Genetics (ASHG) 2017 Annual Meeting, Orlando, United States, 2017 (Poster)
• Mengyao Yu, Adrien Georges, Nathan R. Tucker, Sergiy Kyryachenko, Patrick T. Ellinor, David J. Milan, Russell (Chip) Norris, Nabila Bouatia-Naji. GWAS-driven Pathway Analyses and Functional Validation Suggest GLIS1 as a Susceptibility Gene for Mitral Valve Prolapse. Heart Valve Society (HVS) Annual Meeting, Sitges(Barcelona), Spain, 2019 (Oral Presentation)
13 | P a g e
List of Abbreviations and Acronyms
DNA Deoxyribonucleic acid
SNP Single nucleotide polymorphisms GWAS Genome-wide association analysis HRC Haplotype Reference Consortium TOPMed Trans-Omics for Precision Medicine NGS Next generation sequencing
WGS Whole genome sequencing LD Linkage disequilibrium OR Odds ratio
CI Confidence interval MAF Minor allele frequency HWE Hardy–weinberg equilibrium QC Quality control
eQTLs Expression quantitative trait loci AS Aortic valve
MV Mitral valve
RVHDs Right-sided valvular heart diseases LVHDs Left-sided valvular heart diseases AVS or AS Aortic valve stenosis
MR Mitral regurgitation MVP Mitral valve prolapse BAV Bicuspid aortic valve
14 | P a g e CAVS Calcific aortic valve stenosis
ECM Extracellular matrix
EMT Endothelial to mesenchymal transition VICs Valvular interstitial cells
MFS Marfan syndrome IBD Identical by descent TF Transcription factor
15 | P a g e
List of Figures
Figure 1. Direct and indirect association.. ... 28
Figure 2. The selection of ‘tag’ SNPs.. ... 29
Figure 3. Genotype imputation in unrelated individuals.. ... 30
Figure 4. Functional annotation of the detected genetic associations for the diseases/trait. ... 39
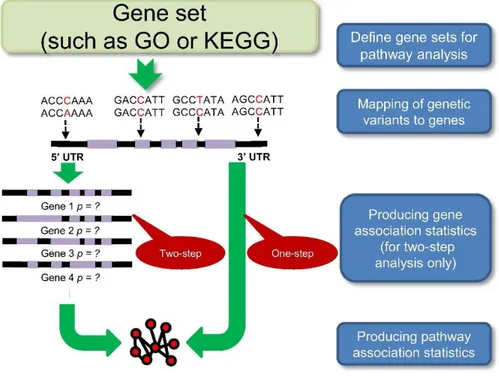
Figure 5.A general workflow for pathway analysis. ... 41
Figure 6. Input data for pathway analysis. ... 42
Figure 7. Competitive and self-contained approaches.. ... 45
Figure 8. Overview of the network analysis. ... 47
Figure 9. Drawing of a normal heart illustrating chambers and valves locations... 51
Figure 10. Mitral valve prolapse and Mitral Regurgitation. ... 57
Figure 11. Anatomical structure and leaflet composition of the mitral valve.. ... 59
Figure 12. Normal mitral valve structure. ... 60
Figure 13. Mitral valve growth and development.. ... 62
Figure 14. Study design of current GWAS and the filter strategy of SNPs... 68
Figure 15. Quantile-Quantile (QQ-plot) (a) and Manhattan plot (b) of the discovery genome-wide meta-analysis.. ... 69
Figure 16. Morpholino-mediated knockdown of orthologs to tns1 in zebrafish embryos and Tensin 1 expression and knockout phenotype in mouse model. ... 70
Figure 17. The association signals at LMCD1 locus and morpholino-mediated knockdown of orthologs to lmcd1 in zebrafish embryos.. ... 71
16 | P a g e
List of Tables
Table 1. Genes at associated loci in BAV... 53 Table 2. Genes at associated loci in CAVS. ... 55
Part I – Genenral Introduction
17 | P a g e
Part I – General introduction
Part I – General Introduction --Chapter 1 – Human genetic study
Part I – General Introduction --Chapter 1 – Human genetic study
19 | P a g e
1
Chapter 1 – The study of Human genetics
In this chapter, the human genome and related sequencing projects are first summarized with an emphasis on the Human Genome Project and to give an overview of human genetic variants. The sequencing technologies are outlined which were developed for revealing the DNA structure. Then, the SNP genotyping, an efficient and economical approach to determine the genetic variations of SNPs among individuals, is introduced. The basic concepts in population genetics are also presented. the two important analyses in genetic epidemiology, linkage analysis, and association analysis, are summarized. I put more stress on the introduction of genome-wide association analysis, as it is the approach that we used to study non-syndromic mitral valve prolapse. Finally, the functional strategies to extract biological functions from GWAS findings, including in silico annotations, pathway-based analysis using GWAS summary data, and network analysis for GWAS data, are summarized.
1.1
Detecting human genetic variability
1.1.1 The human genome and related sequencing projects
The human genome contains 23 pairs of chromosomes, in which approximately 3 billion of these base pairs reside. According to recent database, 20,805 and 20,418 estimated protein-coding genes were identified in GRCh37.p13 and GRCh38.p12, respectively. Coding DNA sequences are defined as the sequences that can be transcribed into mRNA and then translated into proteins. Coding DNA sequences account for only a very small fraction of the genome (< 2%). More than 98% of human genomes is composed of noncoding DNA sequences (Lander et al. 2001), which are not found within protein-coding exons and are never represented within the amino acid sequence of expressed proteins. Various classes of noncoding DNA have been identified, e.g., genes for noncoding RNA (e.g. tRNA and rRNA), pseudogenes, introns, untranslated regions of mRNA, regulatory DNA sequences, repetitive DNA sequences, and sequences related to mobile genetic elements.
Part I – General Introduction --Chapter 1 – Human genetic study
20 | P a g e To determine DNA sequences and map all of the genes of the entire human genome from a physical and functional point of view, the Human Genome Project (HGP) has made the effort to reveal about 20,500 human genes (Lander et al. 2001). Having the complete sequence of the human genome is essentially similar to having a manual making a human body. The challenge to researchers now is to determine how to interpret the manual to discover the genetic basis for health and of the pathology of human diseases. Based on this project, some online tools, such as UCSC Genome Browser (Kent et al. 2002) and Ensembl (Zerbino et al. 2018) which have added additional data, provide a powerful function to visualize and search in the human genome. Taking advantage of this project, the sequence of DNA helps us to study genetic variants in the human genome which enables a better understanding of human diseases and personalized precision medicine.
In DNA sequences, there are many different types of genetic variants which can be classified in three forms in general, 1) single nucleotide polymorphisms (SNPs), 2) structural variation (indel (insertion or deletion), duplications, copy number variation, inversions) and 3) chromosome abnormality (Burton et al. 2005). Structural variation is used to describe the genetic variation that occurs over a larger DNA sequence compared to SNP which represents a variation in a single nucleotide. The number of currently known SNPs in the human genome is 655,379,774 (dbSNP Build 152). According to whether SNPs modify the aminoacidic sequence in the gene product, they are classified into non-synonymous and synonymous (Burton et al. 2005). Non-synonymous SNPs in the protein-coding regions can be called coding SNPs (Burton et al. 2005) and those SNPs are more likely to affect the function of a protein (Carlson et al. 2004). However, disease-associated variants with modest effects should be distributed proportionately between noncoding and coding sequences (Carlson et al. 2004) and all kinds of SNPs including synonymous SNPs can cause diseases through different ways, e.g., through changing the regulation of transcription (Burton et al. 2005).
To address most genetic variants, the 1000 genome project (Consortium et al. 2015) provides highly accurate assignment of the genotypes from 2,504 samples, which contains 84.4 million variants in 26 populations (Phase 3). On the other hand, to determine the haplotype map of the human genome and the LD patterns of DNA sequence variation, the HapMap project
Part I – General Introduction --Chapter 1 – Human genetic study
21 | P a g e (Consortium 2003) genotyped 5000,000 “tagSNPs” and provides a powerful source for studying the genetic variations. HapMap might be replaced by the 1,000 genomes, as the latter has become a research standard for population genetics and genomics gradually with an increasing number of novel variants.
1.1.2 Next-generation sequencing and its applications
As was started for discovering DNA structure, sequencing is widely used to understand the complexity and diversity of human genomes (Goodwin et al. 2016). Compared to the Sanger sequencing, the “next generation” sequencing (NGS) technologies enable rapid generation of a large amount of data by sequencing enormous amounts of DNA or RNA samples in parallel using diverse methodologies with lower costs (Rizzo et al. 2012).
NGS sequencing can be divided into short-read NGS and long-read NGS. SOLiD, Complete Genomics platforms, Illumina, Qiagen GeneReader, Ion Torrent, and Roche 454 platforms use short-read sequencing approaches (Tomkinson et al. 2006) (Goodwin et al. 2016). Both SOLiD and Complete Genomics platforms offer a very high accuracy (~99.99%) (Liu et al. 2012), but the maximum read length is only 75bp for SOLiD and 28-100bp for Complete Genomics, which limits their use for genome assembly and structural variant detection applications (Goodwin et al. 2016). Illumina has a series of platforms and dominates the short-read sequencing industry. HiSeq X as the newest and highest throughput instrument is still limited to whole genome sequencing (WGS) and whole-genome bisulfite sequencing. Qiagen GeneReader focuses on cancer gene panels (Goodwin et al. 2016). Both the Ion Torrent systems and the 454 platforms have longer read lengths, up to an average of 400bp and 700bp, respectively. Unfortunately, the 454 platforms had been discontinued in 2016 as they were unable to adapt to the rapid development in the NGS field.
The complexity of genomes lies in their long repetitive elements, structural variations and copy number variants (CNVs), which are too long to be sequenced by short-read paired-end technologies. Long-read sequencing enables a single continuous read, which is useful for complex or repetitive regions and transcriptomic (entire mRNA transcripts) research (Goodwin
Part I – General Introduction --Chapter 1 – Human genetic study
22 | P a g e et al. 2016). Several platforms can be used to sequence long read, such as Pacific Biosciences (PacBio) (Eid et al. 2009), MinION (nanopore sequencer) and Illumina platforms. The PacBio RS II can generate single polymerase reads over 50kb with average read lengths of 10-15kb for a long-insert library. However, the single-pass error is as high as 15%, especially indel errors (~14%) with few apparent miscalls (~1%) (Carneiro et al. 2012). Even though this limitation can be overcome by increasing the coverage (Koren et al. 2012), the high cost (around $1,000 per Gb) and limited throughput still hinder the wide use of PacBio RS II. MinION can directly detect the DNA composition of a native ssDNA molecule, but it has a large error rate (up to 30% for a 1D read) (Goodwin et al. 2016). Nevertheless, the accuracy limitation may be overcome by using good calling algorithms (Jain et al. 2015). The Illumina synthetic long-read sequencing platform and the 10X Genomics emulsion-based platform are now available for generating more than 100kb long-reads (Goodwin et al. 2016).
A wide range of applications based on NGS suite includes genome sequencing through WGS, whole-exome and targeted sequencing (Hodges et al. 2007), epigenomics applications through chromatin immunoprecipitation followed by sequencing (CHIP-seq) (Park 2009), ATAC–seq (assay for transposase-accessible chromatin using sequencing) (Buenrostro et al. 2013), DNA methylation sequencing (methylseq) (Brunner et al. 2009), and transcriptomics applications through RNA sequencing (RNA-Seq) (Wang et al. 2009). Long-read sequencing approaches are more effective in identifying clinically relevant structural variation than short-read approaches but are less used.
Using NGS technology, a large number of sequencing data were generated. Web-accessible databases like Encyclopedia of DNA Elements (ENCODE) (Consortium 2012) and UCSC (Kent et al. 2002), integrating the approaches and sequencing data to provide a comprehensive annotation of functional elements in the human genome and offer a visualization framework. With the increasing number of sequencing data, one challenge now is how to analyze and store this wealth of data (Pop et al. 2008; Goodwin et al. 2016). The transformation of this vast genetic database into a biological context associated with genomic information remains challenging. One important difficulty is that, as the cost per sample is still high, the sequencing technology cannot be applied for large scale population studies, such as GWAS.
Part I – General Introduction --Chapter 1 – Human genetic study
23 | P a g e
1.1.3 SNPs genotyping
SNPs, as a type of genetic markers, defined as a DNA sequence that is sufficiently heterogeneous to identify differences between individuals and between homologous chromosomes in an individual, exist in the human genome and were found to be the contributors to the etiology of many human diseases. SNP genotyping is the process to determine the genetic variations of SNPs among individuals. A variety of approaches can be used to perform SNP genotyping, such as SNP array and sequencing.
SNP array, a type of DNA microarray, is used to detect the SNPs within a population. In high-density oligonucleotide, SNP arrays, by generalizing to a very large number of immobilized probes on a small chip, can be used to detect a large number of SNPs simultaneously. The most successful and commonly used SNPs genotyping arrays mostly come from Affymetrix and Illumina (Bumgarner 2013). Nowadays, SNP arrays can detect more than 1 million different human SNPs. Call rates and reproducibility of SNP calls exceed 99.5% (Bumgarner 2013). One important application of SNP arrays is to determine disease susceptibility loci/genes, using the genome-wide association analysis studies (GWAS). The genome-wide SNP genotyping using fix SNP panel provides high data quality, accurate genotyping results to detect markers for genetic diseases with complex traits in a cost-effective way. However, SNP genotyping arrays are not designed for detecting rare variants. When there are no suitable assays, target sequencing can be used for SNP analysis and detection. Moreover, genome-wide SNP genotyping array only contains a small fraction of human genetic variants. The ungenotyped variants can be detected by genetic imputation.
Sequencing can be carried out for SNP genotyping as well, such as WGS and restriction-site-associated DNA sequencing (RAD-seq) (Davey et al. 2010). WGS is an efficient approach to detect SNPs, but the cost is overwhelming as a huge amount of data is generated. RAD-seq can identify genetic variants in a short fragmental region of the genome using a restriction nuclease and an NGS platform. It is useful to detect SNP genotypes in a specific region than sequencing large regions, but not applicable to do genome-wide SNP genotyping.
Part I – General Introduction --Chapter 1 – Human genetic study
24 | P a g e
1.2
Population genetics
Population genetics is the study of genetic variation within populations. It aims to understand the changes in the genetic composition by detecting changes in the frequencies of genes and alleles in populations. In an ideal situation, the genotypic proportions are constant from generation to generation. For example, a single locus with two alleles denotes A and a with frequencies f(A) = p and f(a) = q. The expected genotype frequencies for AA, Aa and aa should be f(AA) = p2, f(aa) = q2, and f(Aa) = 2pq, respectively. After several generations, the frequencies of allele A and a should still be p and q, which suggests that the subsequent generations have reached the equilibrium, called Hardy-Weinberg equilibrium (HWE) (Wigginton et al. 2005). However, the genetic composition can be changed by various factors, including natural selection, mutation, random genetic drift, and migration into or out of the population. The individuals composing a given generation have unequal chances of transmitting their gametes to the next generation and some genotypic variants are more likely to survive or reproduce than others. This natural selection may be due to differences in mortality before reproductive age, or reduced fertility. Mutations in the population keep the population from homogeneous. It is the source of genetic variation and ensures that the allele will not be fixed in the population and a degree of polymorphism will be maintained. When genetic drift happens, allele frequencies in a population will be changed. This change can make genetic variants to disappear or more common depending on their reproductive success. The genetic composition of the population can be changed as well when migration occurs between or among different populations (Okasha et al.2016).
If any of these conditions happened during the evolution, the HWE will be broken which causes deviations from the expectations. HWE test is usually used to test the difference between observed genotype frequencies obtained from the data and the expected genotype frequencies obtained. The deviation from HWE at particular markers may suggest an association between the marker and susceptibility disease (Wigginton et al. 2005).
Part I – General Introduction --Chapter 1 – Human genetic study
25 | P a g e
1.3
Genetic epidemiology
Genetic epidemiology is a discipline closely related to traditional epidemiology, focusing on the genetic determinants of human diseases, and the combined effects of genes and non-genetic determinants (Burton et al. 2005). Before the boost of genomic sequencing, a great breakthrough was made on monogenetic diseases. These diseases are affected by a mutation in a single gene and they are recurrent in the familial following the laws of Mendelian inheritance (Burton et al. 2005). However, with a better understanding of human genomes and the development of sequencing and genotyping technologies, we are able to detect multiple genetic determinants in a family or in the population that is associated with the disease or trait, referred as complex disease. In this part, we introduce the genetic linkage analysis, which estimates whether a given marker or a marker close to a causal variant is shared within a family. Then, we focus on association analysis, which looks for the association between variants and the disease or trait of interest in the general population.
1.3.1 Linkage analysis
Genetic linkage analysis is used to map genetic loci for the Mendelian and complex traits with familial aggregation (Dawn Teare et al. 2005; Bush et al. 2010). Genetic linkage analysis aims to detect a chromosomal region that is likely to contain disease/trait-related genes. In the genome, especially in the same chromosome, the closet loci are more likely to segregate together through pedigrees, offering the opportunity to map genetic markers and infer the position within a locus. Linkage analysis can be either parametric or non-parametric. Parametric linkage analysis is a traditional approach used when an inheritance model for the trait locus (e.g. dominant or recessive), allele frequencies, mutation rate, and penetrance is specified (Dawn Teare et al. 2005; Bush et al. 2010). The linkage can be measured by the logarithm of the odds (LOD) score, developed by Newton Morton (Morton 1955). This score mostly depends on the recombination fraction (θ), which measures the probability of recombination of the gametes by parents. If the gametes are transmitted independently, θ=0.5. Otherwise, the parenteral gametes are more likely
Part I – General Introduction --Chapter 1 – Human genetic study
26 | P a g e to be transmitted preferentially to the recombined gametes, then θ < 0.5 in which case those two loci are in the linkage. With the null hypothesis that there is no linkage between a putative disease locus and the marker locus (a single or multiple markers), the LOD score ranges from 3 to -2. Higher LOD score represents greater linkage. A score of -2 means there is no linkage between the disease locus and the maker.
Without accurate parameter estimates, the setting of different parameters for linkage studies will lead to confusion. It is hard to decide which set of parameters provides better results than another. In addition, false positive results may appear in multiple tests without adjustment (Bush et al. 2010).
For polygenic diseases, the inheritance model is not that clear anymore. Model-free (non-parametric) linkage analysis was developed to deal with these unspecified disease models. Affected relatives always share haplotypes that are identical by descent (IBD) in the region of a disease-causing gene without the mode of inheritance (Dawn Teare et al. 2005). Under the null hypothesis of no linkage, various methods were employed to test whether IBD sharing at a locus is greater than expected. The study of the affected sibling pairs is helpful to solve the problem caused by incomplete penetrance by using definitively affected individuals. But the distinction of IBD and identical by descent (IBS) is not easy when the markers are not sufficiently polymorphic, and the proper sibling with a disease is hard to find, which limits the application of this approach (Dawn Teare et al. 2005). Alternative methods have been developed to analyze families with a large number of affected relatives. Estimated IBD sharing score can be calculated by pairwise comparisons, then compared to the expected score to get the linkage relationship. The IBD sharing can be more accurately calculated by more multipoint analyses. Using several thousand SNPs, whole genome screens were created for a wide range of complex diseases (John et al. 2004) and MERLIN, a wide and popular software can be used to handle such data easily (Abecasis et al. 2002).
Linkage analysis is limited to complex disease studies so far due to the small sample size, and hence it cannot detect modest effect genes. Besides, whether identify a region linked to a disease gene or discover a shared region between affected individuals, only a region that shows linkage with a disease, a causal gene or loci cannot be detected (Dawn Teare et al. 2005; Hirschhorn et al.
Part I – General Introduction --Chapter 1 – Human genetic study
27 | P a g e 2005). However, detecting a particular region of the genome using linkage analysis can be a proper prior step for target sequencing (Teare et al. 2014). Additionally, genes discovered by linkage analysis usually explain only a small part of the heritability of the diseases, even though linkage analysis might be more productive by using dense markers, larger pedigree and larger sample sizes (Hirschhorn et al. 2005). Recently, linkage analysis coupled with filtering approaches turned to be a powerful method dealing with WGS data, especially for rare variants in a complex trait with high penetrance (Ott et al. 2015). Nevertheless, common variants with modest effects on diseases are difficult to identify by linkage study. Those limitations may give us additional clues to association analysis.
1.3.2 Genetic association analysis -- Population studies
Extensive genetic variants in large, population-based samples detected in human genome sequencing give us the opportunity to understand the pathogenesis of common diseases. Differ from linkage analysis, association analysis studies the relationships between one or more common genetic variants and diseases (Cordell et al. 2005). Rather than other types of genetic polymorphism, SNP is widely studied in the association analysis. There are more than 84.7 million SNPs in the human genome. At least 99% of SNP variants have a frequency greater than 1% (Consortium et al. 2015).
Association study can be used as candidate genes association study if the associated region is well predicted. This study heavily relies on biological literature or the location provided by the linkage study. An alternative association study is GWAS, which is, in theory, expected to identify the causal genetic variants by testing the association between a large number of variants and the trait (Hirschhorn et al. 2005). In GWAS, compared to linkage analysis, there is no need to guess the location of the potential risk loci which may cause bias. Chances to discover the risk variants and genes are also increased as a few hundred thousand positions are tested.
Part I – General Introduction --Chapter 1 – Human genetic study
28 | P a g e
1.3.2.1 Select SNPs for genotyping
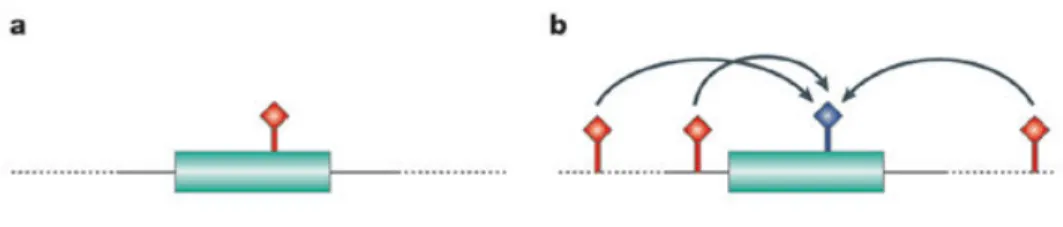
The tested association can be classified into direct and indirect association (Cordell et al. 2005) (Figure 1). The direct association is powerful but difficult to determine the candidate SNP (Figure 1a). The selected SNPs for direct testing for the association are always functionally known by previous knowledge. When an association happens in the codon region, it may alter the DNA sequence directly and affect the candidate gene, such as missense SNPs (Cordell et al. 2005; Hirschhorn et al. 2005). However, most of the association are located in the non-coding region. Variants in the non-coding region may be responsible for the heritability of common complex disorders as well as the coding region (Cordell et al. 2005). Thus, the direct association has a limited potential to discover genetic causes in GWAS.
The second type of association is indirect association (Figure 1b), which has no causal role but is linked to a nearby causal variant. It is difficult to analyze the indirect association because they are less powerful than direct associations (Cordell et al. 2005). A large number of SNPs can be genotyped to increase the possibility to find the indirect association. However, the high cost in genotyping lots of SNP kept researchers away (Halldórsson et al. 2004). Fortunately, based on the special haplotypic structure in the human genome, only a small number of SNPs need to be genotyped (Flint 2013).
Figure 1. Direct and indirect association. a) candidate SNP (red) is directly tested for association with a
disease phenotype. b) The SNPs to be genotyped (red) are in the linkage disequilibrium (LD) with the tested SNPs (blue). Adapted from (Hirschhorn et al. 2005).
Part I – General Introduction --Chapter 1 – Human genetic study
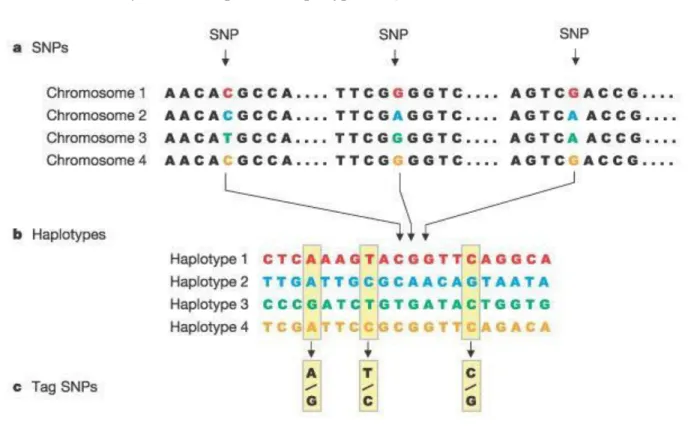
29 | P a g e In the population, alleles at different loci are more likely to be inherited together than by chance. The set of the special allele called haplotype and alleles inherited together in the haplotype is in the LD (Consortium 2003) (Figure 2a,b). In the same chromosome or different chromosomes, the level of LD between alleles mostly depends on the recombination rate (Slatkin 2008). The distance between genes is proportional to recombination rate but is inversely proportional to the linkage score. Of course, when the two loci are in a complete linkage state, there is a strong LD between the alleles (Slatkin 2008). LD can be measured by calculating D’ (Lewontin 1964) and r2 (Hill et al. 1968). When LD happens in alleles or genes, it suggests that they are in a potential association. The strong association can represent measurable haplotypes in many chromosome regions which can explain most of the variation in those regions (Daly et al. 2001; Gabriel et al. 2002). By using this strong association, a set of carefully selected SNPs, ‘tag’ SNPs, contains most information for that region. Therefore, genotyping a few ‘tag’ SNPs in those regions is sufficient to identify their correspondent haplotypes (Figure 2c).
Figure 2. The selection of ‘tag’ SNPs. a) In different populations, there are SNPs in the chromosome; b)
a set of alleles form haplotypes; c) several SNPs can be selected to represent those SNPs. Adapted from (Consortium 2003).
Part I – General Introduction --Chapter 1 – Human genetic study
30 | P a g e Taking advantage of the LD patterns, the HapMap project helps to identify a set of ‘tag’ SNPs to improve the efficiency by not genotyping all markers in the genome. The tag SNPs contain most of the information of the common variation within the region according to the LD (Johnson et al. 2001; Gabriel et al. 2002).
1.3.2.2 Key steps in GWAS -- Phasing and imputation
As expected, a set of genotyped polymorphisms provided by different GWA arrays achieves a modest power to detect the association. However, variants not being directly genotyped may play a role in the disease. Using imputation, which aims to predict the genotypes that are not directly assayed in the studied individuals and fill in missing genotype data, can lead to a boost of the association signaling and an improvement in the detection of associations (Marchini et al. 2007).S Haplotypes are related to each other because IBD exists among the unrelated individuals. By identifying the sharing between the haplotypes of the studied individuals and the haplotypes in the reference panel, imputation can infer the missing alleles that are not included in the commercial arrays (Figure 3).
Figure 3. Genotype imputation in unrelated individuals. a) The genotyped data still has missing
genotypes. However, the reference panel with a large number of haplotypes is available. b) Identify the sharing region between study samples and the reference panel. c) Combine the study sample with reference haplotypes to filling the missing genotypes in the study sample. Adapted from Li et al. (Li et al. 2009).
Part I – General Introduction --Chapter 1 – Human genetic study
31 | P a g e
1.3.2.3 Phasing and pre-phasing
Phasing is the process that uses genotype data to estimate haplotypes for an individual from the reference panels (phasing) or GWAS sample (pre-phasing) (Figure I-3a,b), which can improve the imputation speed and accuracy (Delaneau et al. 2012; Howie et al. 2012). Phasing unrelated individuals considers the haplotype frequencies. The more individual samples there are, the better the phasing estimation is (Browning et al. 2011). Haplotype phase plays an important role in the imputation of untyped genetic variation. Generally, the more haplotypes the panel have, the higher the accuracy in the imputation is. However, imputing from a large reference panel is computationally challenging. Computational methods were developed to handle the large genotyped data. The most popular computational phasing method uses hidden Markov models (HMM) based on approximate coalescent models (McVean et al. 2005).
Under the HMM, approaches were designed to deal with population-based statistical phasing, like PHASE (Stephens et al. 2001; Stephens et al. 2005), SHAPE-IT (Delaneau et al. 2008), fastPHASE (Scheet et al. 2006), IMPUTE2 (Howie et al. 2009), and MACH (Li et al. 2010). PHASE provides accurate phasing in small numbers of markers with small sample sizes, but it is slow in large data size. fastPHASE is less computationally costly and can handle large unphased genotype data at the expenses of losing accuracy compared to PHASE. MACH and IMPUTE2 are imputation programs but can be used for phasing observed genotypes as well. Both methods have a high accuracy as the sample size increases. But IMPUTE2 is more time-consuming. SHAPE-IT was developed based on PHASE. This tool provides the same phasing accuracy but runs faster than PHASE. The updated SHAPEIT2 combined the advantages of SHAPEIT1 and IMPUTE2 and can deal with GWAS data. Moreover, it has better computational performance, accuracy, and less switch error rate compared to other methods for the sample sizes ~9,000 (Delaneau et al. 2013). Additionally, Eagle2 was reported to have faster speed and better accuracy compared to SHAPEIT2 with a lower switch error rate in the European-ancestry (Loh et al. 2016).
Due to large genotype databases, the phasing haplotypes of reference panels or GWAS samples need only to be done once. Matching a phased GWAS haplotype to one reference haplotype is
Part I – General Introduction --Chapter 1 – Human genetic study
32 | P a g e faster compared to matching the unphased GWAS genotypes (Howie et al. 2012). All these efforts are meant for a proper imputation.
1.3.2.4 Reference panels
Selecting a good reference panel is important to a successful imputation. Available reference panels include HapMap3 (Consortium et al. 2010), 1000 genomes phase 3 (Consortium et al. 2015), UK10K(Huang et al. 2015), The Haplotype Reference Consortium (HRC) (McCarthy et al. 2016), and The Trans-Omics for Precision Medicine (TOPMed) (Taliun et al. 2019). HAPMAP3 has 2,368 haplotypes from the genotyped 1.6 million common SNPs in 1,184 reference individuals from 11 global populations. Compared to HAPMAP3, 1000 genomes phase 3 provides a more comprehensive map of the genetic variations, which was used as the imputation reference panel in the current GWAS of MVP (Dina et al. 2015). This project combined data from deep exome sequencing, low-coverage whole-genome sequencing, and dense microarray genotyping. Finally, 5,008 haplotypes were predicted from 49 million SNPs in 2,504 individuals from 26 populations. Recently, HRC combined 20 low-coverage whole-genome sequencing data (including the UK10K) and created a large reference panel of 64,976 haplotypes that has over 39 million variants from European and 26 worldwide populations. TOPMed provides deep WGS data (39 X) and other omics data to get more than 400 million single nucleotide and short insertion/deletion variants (97% have frequency <1%) on ~53k samples.
Large reference panel contains more genetic variants, which increases the imputation accuracy and improve the imputation density. This leads to an improvement in the power of association analysis which increases the possibility to detect causal variants.
1.3.2.5 Imputation
Imputation is a cost-efficient way to map the variants that are not directly genotyped in the SNP genotyping (Figure I-3c). A high-resolution map provided by imputation increases the chance to detect causal SNPs, even non-SNPs (e.g. indels/deletions, CNV) (Marchini et al. 2010). With the emerging of large reference panels, tools with a low computational cost, but have high
Part I – General Introduction --Chapter 1 – Human genetic study
33 | P a g e imputation accuracy are indispensable. Several methods can achieve this goal, such as minimac3 (Das et al. 2016), IMPUTE2 (Howie et al. 2009), Beagle 4.1(Browning et al. 2016) and MaCH (Li et al. 2010). Using different reference panels, Das et al. (Das et al. 2016) reported that minimac3 has the best performance among the aforementioned tools in imputation speed, computational consuming and imputation accuracy (especially in rare variants (minor allele frequency (MAF) = 0.0001-0.5%)).
Based on the correlation between the true and the imputed dose of allele, r2 (RSQ) measure is used to interpret the imputation accuracy (Howie et al. 2012). For Minimac and Beagle, the RSQ measure is based on the correlation between true and estimated haploid dosages across all haplotypes. Another measure, MaCH RSQ measure, is based on diploid dosages across all samples (Das et al. 2018).
Although using the aforementioned large reference panels is valuable in phasing and imputation, a few limitations need to be mentioned. A number of factors, e.g., sample size, marker density, genotype accuracy, relatedness in the sample, ethnicity and allele frequency (Browning et al. 2011) influence the computational phasing and imputation accuracy. Phasing on the different reference panels for imputation may cause different effects on association results. Meanwhile, phasing accuracy in the reference panel and the GWAS SNPs used for imputation can affect the imputation accuracy.
Imputation usually requires high computational cost and time consumption. In addition, direct access to large reference panels like HRC and TOPMed is limited. Instead, one needs to access a web-based imputation server to upload the genotyping data. Those servers perform the imputation with the predefined quality control process, such as checking and transforming the genome build between hg19 and hg38, flipping the strand, switching the allele, filtering the SNP with low call rate, removing multiallelic and duplicated sites. We also can select the interested reference panel. After the imputation, the imputed data and detailed information files can be downloaded. Thus, one can focus on analyzing the imputed data and interpreting the results, rather than on learning how to do the imputation. Currently, two imputation servers are broadly used, Michigan Imputation Server (Das et al. 2016) and Sanger Imputation Server (McCarthy et al. 2016).
Part I – General Introduction --Chapter 1 – Human genetic study
34 | P a g e
1.3.3 Association analyses and applications
As long as well-mapped SNPs are genotyped or imputed, a genetic association that compares alleles or genotypes at the genetic markers becomes important to identify the genetic risks. In a case-control study, the strength of an association can be measured by the odds ratio (OR), which is calculated from the allele or genotype frequencies. OR is the ratio of odds of the disease group to the odds of the control group. There are two alleles (A, a) and three possible genotypes (a/a, a/A, A/A). By comparing the odds of disease in an individual carrying allele A to the odds of disease in an individual carrying allele a, the allelic OR describes the association between the disease and allele. The genotypic ORs represent the association between the disease and genotype by comparing the odds of disease carrying different genotypes. Usually, there are two genotypic ORs, A/A vs a/a and a/A vs a/a (Clarke et al. 2011).
For disease penetrance, several models (additive, recessive, dominant and multiplicative models) (Lewis 2002) imply the relationship between the genotype and phenotype. Chi-squared (χ2) test, Cochran-Armitage trend test, and logistic regression are the widely used association tests in the models. A single test can be used to calculate for each individual SNP. Usually, the null hypothesis is that there is no association between allele (or genotype) and the disease. The frequencies of allele or genotype in cases are supposed to equal to controls.
In a χ2 test for association, the frequencies of allelic or the genotype can be collected into a two-dim or three-two-dim contingency table (Clarke et al. 2011). To test a dominant model of penetrance, only allele A increases the risk. To test the recessive model of penetrance, two copies of A are required for the increased risk. For a multiplicative model of penetrance, there is an r-fold risk for Aa, r2-fold risk for aa. It is necessary to analyze using alleles rather than using genotypes in the multiplicative model. However, genetic penetrance of many complex diseases is unknown. The additive model is likely to perform well and is commonly used (McCarthy et al. 2008; Clarke et al. 2011). For the additive model, there is an r-fold increased risk for Aa, 2r-fold increased risk for aa, which is always examined using the Cochran-Armitage trend test (Clarke et al. 2011).
Part I – General Introduction --Chapter 1 – Human genetic study
35 | P a g e Logistic regression models of association are used when additional covariates are needed to handle complex traits and environmental interactions or covariates, such as sex or age of onset (Balding 2006; Clarke et al. 2011). We can calculate the transformation logit (p) ~ β0 + β1X, where p is the expected value of phenotype given by the genotype X of the individual. When the potential confounders, such as ethnicity (E), genotyping batch (G), age (A), or sex (S) are needed to adjust the association, we can use the logistic transformation logit f(p) ~ β0 + β1X + β1E + β1G + β1A + β1S…. In the logistical model, the value of β1 is estimated. If β1 significantly differs from zero, it indicates the association between the SNP and disease (Clarke et al. 2011). PLINK and SNPTEST can be used to perform association analyses. PLINK (http://zzz.bwh.harvard.edu/plink/) is a free, open source, genome association analysis toolset, which can rapidly manipulate and analyze large data sets comprising thousands of markers genotyped for thousands of individuals (Purcell et al. 2007). PLINK has five main functions: data management, summary statistics, assessment of population stratification, association analysis, and IBD estimation. All of these functions are applicable to GWAS. Different from PLINK, SNPTEST is a program for the analysis of SNP association in GWAS with frequentist association test and Bayesian association test (Marchini et al. 2007). SNPTEST can be carried out for both quantitative and binary traits and can work on user-specified covariates.
1.3.4 Multiple testing
Using GWAS, millions of SNPs have been tested. The proportion of false positive (type I error) results will be increased if P-value is still set to 0.05. To control the accuracy of multiple testing, the determination of a proper significance threshold is a very important aspect in GWA studies. For association tests applied at each of n SNPs, the significance levels α* for a given family-wise error rate of α (for example, α = 0.05) can be simply approximated using Bonferroni adjustments (α* = α/n). Assuming independence between markers, Bonferroni adjustments provide a simple way to adjust for multiple testing. Permutation testing (Dudbridge et al. 2008) is an accurate correction, which applies only to the genotyped data set. Therefore, the permutation approaches cannot generate truly genome-wide significance thresholds unless the entire genome is
Part I – General Introduction --Chapter 1 – Human genetic study
36 | P a g e sequenced. The empirical genome-wide significance threshold as strong evidence for association accepted was 5×10⁻⁷ and recently, 5×10⁻⁸ (Consortium 2007; Pe'er et al. 2008). Further, a quantile-quantile plot is used to assess whether the observed P-values are consistent with or deviate from expected P-values (Weir et al. 2004). Nevertheless, a significant result in an association test does not imply that the SNP directly affects the disease risk. A direct, or causal association occurs when different alleles at the marker locus are directly involved in the etiology of the disease through one or more biological pathways.
1.3.5 GWAS based Meta-analyses
To guarantee the outcome of the association analysis, a multi-stage approach to minimize sample size and reduce the amount of required genotyping can be used. In stage one, the full set of SNPs are genotyped and the second stage is to type and analyze SNPs that seem promising from the first stage. The third stage can be used as well to re-test the selected SNPs and improve the stringency. This strategy would minimize the chance of false associations (Hirschhorn et al. 2005). However, the common alleles own small genetic effects and the detection of association signal needs a large sample size (Moonesinghe et al. 2008; Evangelou et al. 2013). Using a single GWAS is insufficient even if we use a multi-stage approach.
Meta-analysis, a statistical synthesis of information from multiple independent GWASs can increase the power of association signal and reduce false-positive findings. Large meta-analyses have dramatically increased the yield of discovered and validated genetic risk loci. Several approaches exist for GWAS meta-analysis and they are classified into P-value and Z-scores, fixed effects, random effect, optimal weights, and Bayesian-based meta-analysis (Evangelou et al. 2013). P-values based meta-analysis was used in different fields but hardly provides an overall estimation of effect size and finds heterogeneity issues. Z-scores based approaches, however, take the direction of the effect into account. Heterogeneity resulting from differences in study designs, differences due to interactions with other SNPs or differences due to environmental or lifestyle factors that influence the effects of genes is a potential issue in meta-analysis. (Schaid et al. 2018).
Part I – General Introduction --Chapter 1 – Human genetic study
37 | P a g e
1.3.6 Important factors for a good genetic association study
A good GWAS is affected by several factors. The sample size is the key determinant. But a large sample size may lead to population structure, which is another risk factor in GWAS (Marchini et al. 2004). When genetic markers in cases and controls have different frequencies due to systematic ancestry differences, it can cause false-positive association, spurious associations or over-representation in association analysis (Hirschhorn et al. 2005). The principal-components analysis provides a fast and effective way to detect and correct the population structure (Patterson et al. 2006). Alternatively, mixed-model approaches can meet the requirements in mixed populations studies (Rosenberg et al. 2010). However, a good study design and the proper study sample size is not the only guarantee for a good GWAS. The quality of genotyping, imputation accuracy, the quality control process affect the association results also. Besides, a success GWAS also depends on the number of the segregated loci that affect the trait in the population, the effect size and allele frequency of these loci and the heterogeneous rate of the interested trait or disease (Visscher et al. 2017).
In summary, GWAS has achieved great success in many fields and has reported hundreds of complex traits (Visscher et al. 2017). According to the NHGRI-EBI GWAS Catalog, about 5687 studies and 71673 variant-trait associations from 3567 publications have been reported between genetic variants and one or more complex traits (Buniello et al. 2019). There is a boost of the discovery of new loci and the power of recent GWAS using larger sample sizes (Buniello et al. 2019). About 702 strong associations have been reported between genetic variants and cardiovascular disease, where “strong” is defined as statistically significant at the genome-wide P-value threshold of 5× 10⁻⁸ (NHGRI-EBI GWAS Catalog).
Nevertheless, most genetic variants detected by GWAS are common in the population and have a MAF larger than 1%. The debate that whether a few variants with strong effects or a large number of variants with small effect lead to the inherited component has lasted for a long time. A large number of findings observed in the GWAS on the complex diseases, including most of the cardiovascular disease, are common variants with small effect (Schunkert et al. 2018). For complex traits, a possible combination of the sets of alleles that can increase or decrease the
Part I – General Introduction --Chapter 1 – Human genetic study
38 | P a g e disease risk plays a critical role. Moreover, many studied traits associated with variants at hundreds to thousands of loci in the genome strongly suggest that different traits may share the same underlying causal variants (Visscher et al. 2017). This so-called pleiotropy is a common characteristic and is identified as the phenomenon that one gene affects more than one phenotype (Erdmann et al. 2018).
1.4
Strategies to extract biological functions from GWAS findings
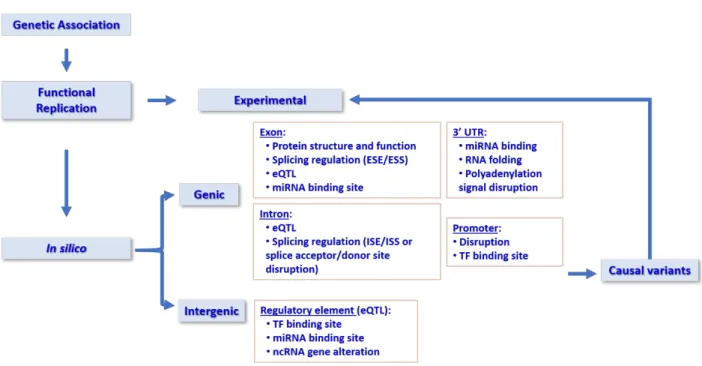
1.4.1 In silico annotations and enhancers annotations, eQTLs …etc
As GWAS has identified disease or trait associated loci, questions are arisen, 1) As most of the leading associations are located in the non-coding regions, what are their functions and how do they affect the disease? 2) Are those lead SNPs causal SNPs? If not, which one will be the potential causal SNPs? To answer the first two questions, functional annotations need to be carried out. As we know, only a small number of disease-associated SNPs lies in protein-coding regions and 88% of the associated SNPs are either intronic or intergenic (Hindorff et al. 2009). Depending on the location, the associated SNPs can influence gene activity through different mechanisms (Figure 4). Most SNPs identified by GWAS located in the non-coding region showed strong evidence of enrichment for regulatory elements, such as enhancers, promoters, insulators and silencers (Schaid et al. 2018). Those SNPs might act as “cis-regulatory elements” (CREs) that influence the gene expression by transcriptional, posttranscriptional, and posttranslational mechanisms (Edwards et al. 2013). It has been shown that disease-related variants are enriched in CREs, typically defined by transcription factor (TF) binding, open chromatin (DNase-seq, FAIRE-seq), and histone modifications known to be associated with transcriptional regulatory activity, such as H3K27ac, H3K4me1, and H3K4me3 (Edwards et al. 2013; Gallagher et al. 2018). Some regulatory elements are located far away from their target genes (>1000 kb), and the regulation of the transcription goes through the long-range interactions by the chromatin loops (Sexton et al. 2009). With the development of chromosome conformation capture methods such as Hi-C, the analysis of the role of genome-wide chromatin interaction progresses rapidly. The Encyclopedia of DNA Element (ENCODE) delineates all of the