018
SDN/18
/01
I M F S T A F F D I S C U S S I O N N O T E
Inequality and Poverty
Across Generations in the
European Union
Tingyun Chen, Jean-Jacques Hallaert,
Alexander Pitt, Haonan Qu, Maximilien Queyranne,
Alaina Rhee, Anna Shabunina,
Jérôme Vandenbussche, and Irene Yackovlev
DISCLAIMER: Staff Discussion Notes (SDNs) showcase policy-related analysis and research being developed by IMF staff members and are published to elicit comments and to encourage debate. The views expressed in Staff Discussion Notes are those of the author(s) and do not necessarily represent the views of the IMF, its Executive Board, or IMF management.
Inequality and Poverty Across Generations in the European Union Prepared by Tingyun Chen, Jean-Jacques Hallaert, Haonan Qu, Maximilien Queyranne, Alexander Pitt, Alaina Rhee, Anna Shabunina, Jérôme Vandenbussche, and Irene Yackovlev1
Authorized for distribution by Poul M. Thomsen January 24, 2018
DISCLAIMER: Staff Discussion Notes (SDNs) showcase policy-related analysis and research being developed by IMF staff members and are published to elicit comments and to encourage debate. The views expressed in Staff Discussion Notes are those of the author(s) and do not necessarily represent the views of the IMF, its Executive Board, or IMF management.
JEL Classification Numbers: E24, H23, H53, H55, I32, I38, O15
Keywords:
Inequality, Poverty, Europe, Labor market policy, Redistribution
Authors’ E-mail Address:
Please contact Jean-Jacques Hallaert [email protected] ; Maximilien Queyranne [email protected] or
Irene Yackovlev [email protected]
1 The project was led by Jean-Jacques Hallaert, Maximilien Queyranne, and Irene Yackovlev under the guidance of Jörg Decressin. The authors wish to thank Antonio Spilimbergo for the guidance, support, and suggestions, as well as the participants in the EUR seminar, COM brown bag lunch, and IMF Inequality Working Group seminar for their comments.
CONTENTS
EXECUTIVE SUMMARY ______________________________________________________________________________ 4 INTRODUCTION _____________________________________________________________________________________ 5 RECENT TRENDS IN POVERTY AND INEQUALITY ACROSS GENERATIONS IN THE EU __________ 5 QUANTIFYING THE ROLE OF THE LABOR MARKET AND FISCAL REDISTRIBUTION ___________ 11 LABOR MARKET POLICIES _________________________________________________________________________ 13 FISCAL REDISTRIBUTION __________________________________________________________________________ 17 CONCLUSION: POLICY IMPLICATIONS ___________________________________________________________ 24
REFERENCES ________________________________________________________________________________________ 46
BOXES
1. Germany: A Within-Cohort Perspective on Inequality _____________________________________________ 7
2. Labor Market Institutions, Youth Unemployment, and Income Inequality in Germany ___________ 10
3. Czech Republic: Reforming the Targeting of Social Spending ____________________________________ 22
4. Ireland: Increasing the Targeting of Social Spending _____________________________________________ 23 FIGURES
1. EU: Risk of Poverty Across Generations ____________________________________________________________ 7
2. Income Inequality Across Generations in Europe __________________________________________________ 8
3. The Young and the Labor Market __________________________________________________________________ 9
4. Decomposing Fiscal Redistribution by Instrument ________________________________________________ 19 TABLES
1. Income Inequality Panel Regressions _____________________________________________________________ 13
2. Absolute Poverty Panel Regressions ______________________________________________________________ 13
3. Unemployment Rate Panel Regressions __________________________________________________________ 15 APPENDICES
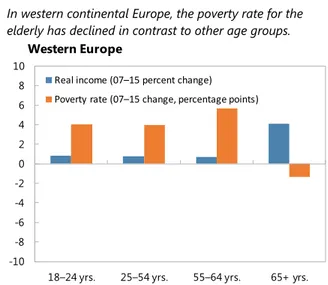
I. Regional Disparities in Poverty and Real Income Across Europe __________________________________ 27
II. The Econometrics of Assessing the Effects on Inequality, Poverty, and Labor Market Outcomes _ 29
III. Data Quality and Comparability __________________________________________________________________ 37
EXECUTIVE SUMMARY
The adverse consequences of inequality—social, economic, and political—have been increasingly recognized and under scrutiny. While global inequality has declined significantly over the past three decades, the evolution of inequality within countries is mixed. During the last decade, overall income inequality in the European Union (EU) has remained stable, but a closer look reveals that this
reflected opposing developments between the real incomes of the young and the elderly. Before the global financial crisis, the young and the elderly had broadly similar risk of relative poverty in the EU. More recently, the risk of poverty increased significantly for the young and, to a lesser extent, for the rest of the working age population, while it declined sharply for the elderly.
Labor market developments as well as the design of both social protection and fiscal consolidation likely contributed to this outcome. The crisis exacerbated preexisting high youth unemployment and a trend toward less stable jobs. High youth unemployment is associated with lower youth incomes and greater risk of youth poverty. Social protection systems are ill-equipped to address rising youth poverty. They shield the elderly’s real incomes from the impact of the crisis but offer only limited assistance to young unemployed individuals. Moreover, the latest fiscal consolidation efforts were more focused on programs helping the working age population rather than the elderly.
High and prolonged youth unemployment and poverty have long-lasting effects on young people’s productivity and incomes, as well as their social prospects. The problems of youth unemployment and poverty are reaching macroeconomic proportions in several European economies. While the ongoing cyclical upturn improves job opportunities for the young, policymakers need to do more to ensure that today’s young do not fall further behind the rest of the population.
To lower the chances of young people becoming poor and suffering lifetime income losses, facilitating their integration into the labor market is essential. To that effect, employers could be given incentives to hire young people, including through targeted reductions in the labor tax wedge or tax credits at the lower end of the wage scale. A better integration of the young into the labor market also requires improving and adapting their skills. Thus, spending on education and training needs to be protected from fiscal consolidation and its efficiency needs to be raised, including through better cooperation on the delivery of programs among employers, employee
representatives, and governments.
Better access to social protection systems for workers in less stable jobs could help preserve labor market flexibility, while significantly reducing youth poverty and income inequality. Policymakers could achieve this goal with reforms of unemployment and non-pension benefits. For example, eligibility requirements could be reviewed as well as the design, age targeting, and efficiency of transfers. A more uniform approach to indexation across benefits could also help along with, more generally, better consideration of the distributional impact across age groups of public expenditure policy. Finally, tax reform could rebalance the tax burden across generations and increase the
redistributive impact of taxation, by increasing progressivity on income taxes and by giving a greater redistributive role to taxes on capital income and wealth.
INTRODUCTION
1. There is growing recognition of the adverse economic, social, and political
consequences of inequality. Both efficient market mechanisms as well as market failures can lead
to inequality. While rewards for innovation, entrepreneurial activity, and job creation in competitive markets exacerbate inequality, they can also have a positive impact. Conversely, rent seeking, abuse of market power, and inequality of opportunity can negatively impact overall welfare. There is a growing body of empirical evidence that highlights the detrimental effects of market failures and, accordingly, findings suggest that lower net income inequality can be associated with faster and more sustained growth (Berg and Ostry, 2011; Ostry, Berg, and Tsangarides, 2014).
2. Over the last decade, overall income inequality has remained stable in the EU, but a closer look reveals that inequality across generations has increased markedly. Income
convergence between advanced and developing countries has contributed to a decline in inequality across countries, even as the evolution of inequality within countries, including some advanced countries, is mixed (IMF, 2017). In Europe, the increase has been driven by growing inequality across generations. This reflects higher poverty and joblessness among the young, which have adverse and long-lasting consequences for today’s youth, as well as for tomorrow’s economic prospects.
Inequality across generations also erodes social cohesion and polarizes political preferences, and may ultimately undermine confidence in political institutions.
3. This Staff Discussion Note (SDN) analyzes poverty and inequality across generations in Europe and discusses policy implications. During the last decade, the relative poverty rate of the
working age population, especially the young, rose while that of the elderly declined markedly. The crisis has exacerbated preexisting high youth unemployment and a structural trend toward less stable jobs. This outcome has hurt real incomes of the working age population, especially the young. Social protection systems are ill-equipped to mitigate the impact of the crisis on the working age population, notably the young. Reversing the trend toward youth poverty requires, in addition to macro-economic policies that avoid large shocks, concerted labor market and fiscal policies, including social protection and fiscal redistribution.
4. This SDN paper is organized as follows. The first section takes stock of recent trends in
inequality and poverty across generations in Europe. The second section quantifies the importance of labor market developments and fiscal redistribution for income inequality and poverty across generations. The following two sections discuss how labor market policies and fiscal redistribution affect inequality and poverty across age groups. The SDN concludes with policy implications.
RECENT TRENDS IN POVERTY AND INEQUALITY
ACROSS GENERATIONS IN THE EU
Over the past decade, poverty and inequality across generations increased. Today, the young are the age group most at risk of poverty. This generation has been adversely affected by economic stagnation and labor market developments, as well as by gaps in the social safety net.
5. The risk of youth poverty is on the rise in Europe.1 In the years leading up to the global
financial crisis, the relative poverty of the young (those 18 to 24 years old) and elderly (those older than 65) was broadly similar.2 With the financial crisis
came a significant rise in the risk of relative poverty for the young because they suffered
disproportionately from unemployment. Meanwhile, the risk for the rest of the working age population increased only modestly, and the risk for the elderly declined precipitously since their incomes,
particularly pensions, were better protected than those of workers.Today, the young are the age group most likely to be poor—in both relative and absolute terms (Figure 1).3
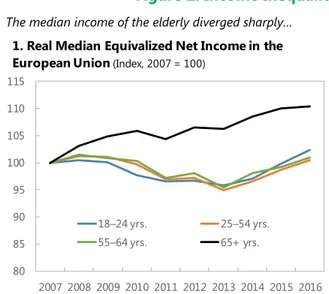
6. Income inequality in Europe has remained stable at the aggregate level but income
developments have diverged across generations and countries. Some of the countries hardest hit by
the global financial crisis also experienced sharp increases in the Gini coefficient of market income between 2007 and 2016, driving some of the differences across European regions; however, this topic is not the focus of this SDN (Appendix I). Rather, the focus here is on measures of income inequality by age groups, which are available for the period since the mid-2000s. We find that income inequality across
generations increased markedly (Figure 2). The median equivalized net income of the working age population—after accounting for taxes and transfers, including pension benefits—stagnated following the crisis, while it grew for the elderly by nearly 10 percent. Notably, the ratio of median net income
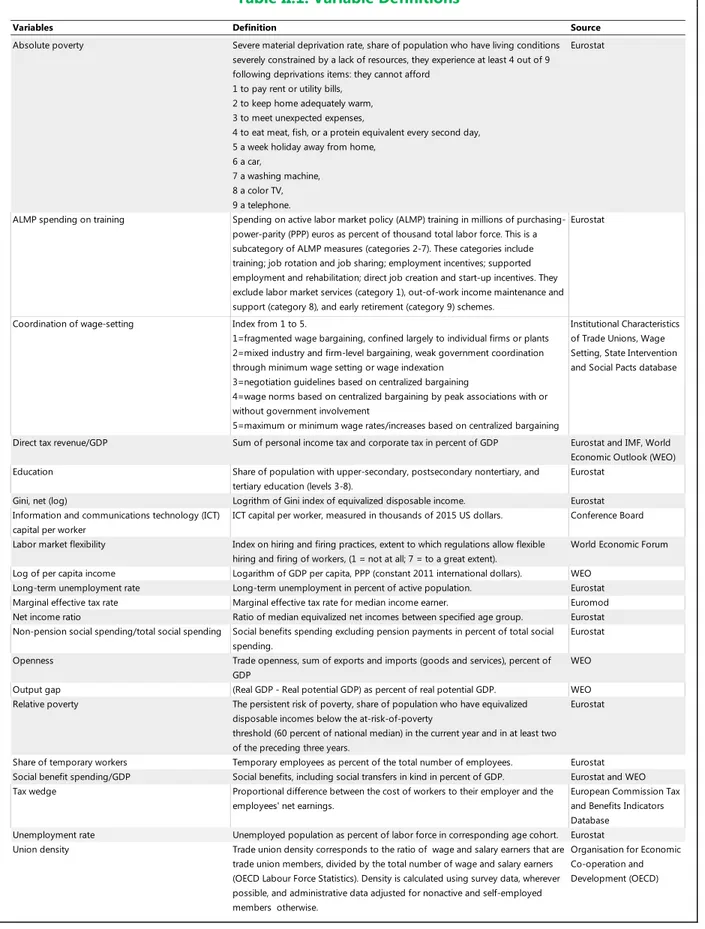
1 We use the Eurostat definition for the at-risk-of-poverty rate: the share of people with equivalized disposable income (after taxes and social transfers) below the at-risk-of-poverty threshold, which is set at 60 percent of the national median equivalized disposable income. The median equivalized disposable income is the total income of a household that is available for spending or saving, divided by the number of household members weighted by age. If the main breadwinners in a household are over age 25, measures of youth poverty (18–24) based on equivalized household income would likely underestimate youth poverty; if the young are the main breadwinners, then youth poverty would be overestimated. EU-aggregated estimates are calculated as the population-weighted arithmetic average of individual national figures. See Appendix III for data sources and definitions.
2 The time series for poverty and inequality data disaggregated by age group begins only in 2005, which limits the analysis of longer-term structural trends. The young are defined as those aged 18 to 24 years old and the elderly as those older than 65.
3 The persistent at-risk-of poverty rate is the share of the population living in households in which the equivalized disposable income was below the at-risk-of-poverty threshold (60 percent of the national median equivalized disposable income) for the current year and for at least two out of the three preceding years.
EU27: At-Risk-of-Poverty Rate
(Percent of total)
Source: Eurostat.
EU27: Gini Coefficient of Disposable Income
(Index, 0–100)
Sources: Eurostat and IMF staff calculations.
1 Or latest available. 13 14 15 16 17 18 19 20 21 22 23 24 25 2005 2006 2007 2008 2009 2010 2011 2012 2013 2014 2015 2016 18–24 yrs. 25–54 yrs. 55–64 yrs. 65+ yrs.
of the elderly to the youth rose in most countries. In Germany, the ratio has been stable but income inequality within young cohorts is higher than it was when their parents were young (Box 1).
7. The stagnation of workers’ incomes fundamentally changed the profile of inequality across generations, and left the youth with the lowest median income of any age group.
Inequality within age cohorts is also markedly different; the ratio of the top and lower quintiles is much lower among those aged 65 and older than in the working age population. Further, the concentration of income tilted markedly in favor of the elderly in the years since the crisis (Figure 2).
Figure 1. EU: Risk of Poverty Across Generations
The young now have the highest persistent at-risk-of poverty rate among all age groups.
The share of youth experiencing absolute poverty (as measured by severe material deprivation) is almost twice as high as the share of elderly.
Sources: Eurostat and IMF staff estimates.
1 2008 used due to lack of data in 2007.
Box 1. Germany: A Within-Cohort Perspective on Inequality The median net income and the poverty rate of different age
groups have been evolving rather uniformly in Germany over the past decade, suggesting a broadly stable picture in terms of intergenerational inequality. This perspective can be usefully complemented by an analysis of the evolution of within-cohort income inequality for various age groups. Such an analysis show that younger cohorts are facing a more unequal within-cohort distribution of income than older cohorts when they were young.
The within-cohort Gini index of disposable income of individuals born in the same decade displays a clear upward drift at any given age. The drift is particularly pronounced for the income received during the time individuals are 15–35 years old. For example, whereas the Gini index of those born in the 1970s when their oldest member was 25 years old was
0.24, it was close to 0.30 for those born in the 1980s and the 1990s at the same age. This finding is
reminiscent of the results of Bönke and others (2015), who identified a secular increase in lifetime earnings inequality among men born in West Germany between 1935 and 1969, a pattern which they attributed for the most part to the evolution of the cohort-specific wage structure.
0 2 4 6 8 10 12 < 18 yrs. 18–24 yrs. 25–54 yrs. 55–64 yrs. 65+ yrs. 20152007
2. EU27: Severe Material Deprivation (Percent of total) 0 3 6 9 12 15
18–24 yrs. 25–49 yrs. 50–64 yrs. 65+ yrs.
2008¹ 2015
1. EU27: Persistent at-Risk-of-Poverty Rate (Percent of total) 0.20 0.22 0.24 0.26 0.28 0.30 0.32 15 20 25 30 35 40 45 50 55 60 65 W ith in -c oh or t G in i c oe ffic ie nt Age (years) 1990–1999 1980–1989 1970–1979 1960–1969 1950–1959 Younger generations Older generations
Germany: Within-Cohort Gini Coefficient of Disposable Income, 1991-2014(Index between 0 and 1)
Sources: Socio-Economic Panel v32; and IMF staff calculations. Note: Each line represents the evolution of the within-cohort Gini index as a function of the age of the cohort's oldest member. Cohorts are tagged by birth years.
8. The young are more likely to fall into poverty in the event of an income shock in part because they typically lack asset wealth that acts as a buffer. As the accumulation of assets is
gradual over the life cycle, younger generations (measured here as 16–34 years old) hold less than 5 percent of net wealth in Europe, and their median wealth is one-tenth of the median for 65-year-olds. They also have the highest debt-to-assets ratio (49 percent) across age groups and are most likely to form part of a credit-constrained household (12.4 percent) (Household Finance and Consumption Survey, 2016).4 Intergenerational transfers and gifts within families are important for
household wealth accumulation and could be an important source for mitigating intergenerational inequality, but matter to a smaller extent in reducing overall inequality (Mathä and others, 2014).5
4 The Household Finance and Consumption Survey data covers Euro Area countries only.
5 While these transfers could play an important role in reducing inequality across generations, data is not available.
Figure 2. Income Inequality Across Generations in Europe
The median income of the elderly diverged sharply… ...especially compared to the young.
The population aged 65 and over faces lower income
inequality… …and a growing share of those over 65 have relatively high income.
Sources: Eurostat; IMF World Economic Outlook; and IMF staff calculations.
Note: Data labels use International Organization for Standardization (ISO) country codes. pps = percentage points; rhs = right-hand scale. 80 85 90 95 100 105 110 115 2007 2008 2009 2010 2011 2012 2013 2014 2015 2016 18–24 yrs. 25–54 yrs. 55–64 yrs. 65+ yrs.
1. Real Median Equivalized Net Income in the European Union (Index, 2007 = 100)
3.0 3.5 4.0 4.5 5.0 5.5 6.0 2007 2008 2009 2010 2011 2012 2013 2014 2015 <65 yrs. 65+ yrs.
3. EU27: Inequality of Income Distribution (Share of top to lower quintile, ratio)
-2 -1 0 1 2 3 4 5 6 7 -10 -5 0 5 10 15 20 25 30 35 <18 yrs. 18–64 65+ yrs.
Percent of total, 2015 Change in pps, 2007-15 (rhs)
4. EU27: Concentration of Income (Population having 130% or more of national median net income)
AUT BELBGRHRV CYP CZE DNK ESP EST FIN FRA GBR GRC HUN LTU LVA MLT NLD POL PRT ROU SVKSVN SWE 0.5 0.6 0.7 0.8 0.9 1.0 1.1 1.2 1.3 1.4 0.5 0.6 0.7 0.8 0.9 1.0 1.1 1.2 1.3 1.4 2016 2007 2. Median Net Income Ratio (Ratio, 65+ / 18–24)
9. Income inequality and poverty across generations are closely related to developments in the labor market. Youth employment prospects
were especially hard hit by the global financial crisis. Although labor force participation among the young has fallen, youth unemployment remains well above overall unemployment rates across EU countries (despite a modest decline since 2013) and is correlated with higher poverty rates. Moreover, the prevalence of in-work poverty, involuntarily part-time employment, and temporary work contracts has risen over the last decade and most among the young (Figure 3). One important exception is Germany, where youth unemployment, temporary contracts, and part-time work have declined, and the
increase in youth in-work poverty has been more limited than for older age groups (Box 2). Net Wealth Distribution by Age Group, EA-17
(Thousands of euros)
Source: ECB HFCS wave 2.
Note: P25 and P75 refer to the 25th and 75th percentile
ranges.
Figure 3. The Young and the Labor Market
The young not only face higher unemployment than other age groups (Chart 1), but even when in work, poverty has increased most for them (Chart 2), they are more often involuntarily employed part-time (Chart 3), and they face lower job security (Chart 4).
Sources: Eurostat and IMF staff calculations. 1 Data for age group 25–64 is unavailable.
0 50 100 150 200 250 300 350 400 0 50 100 150 200 250 300 350 400 16-34 35-44 45-54 55-64 65-74 75+ P25-P75 Range Median AUT BEL BGR CYP CZE DNK EST FIN FRA DEU GRC HUN IRL ITA LVA LTU LUX MLT NLD POL PRT ROU SVK SVN SWE GBR EU avg. AUT BEL CZE DNK EST FIN GRC HUN IRL ITA LVA LTU LUX NLD POL ROU ESP GBR EU avg. -5 0 5 10 15 0 5 10 15 20 25 Ch an ge , 2007 -1 5 (p ps ) Level, 2007 (percent)
2. In-Work At-Risk-of-Poverty Rate
(Percent) 15–24 yrs. 25–54 yrs.¹ BEL HRV CYP FIN FRA DEU GRC HUN IRL ITA POL PRT SVK ESP EU avg. AUT BELBGR HRV CYP CZE DEU GRC HUN IRL ITA LUX MLT NLD POL PRT ROU SVK SVN ESP GBR EU avg. -10 0 10 20 30 0 5 10 15 20 25 30 Ch an ge , 2 007-15 (p ps ) Level, 2007 (percent) 1. Unemployment Rate (Percent) 15–24 yrs. 25–64 yrs. BEL CYP DEU GRC IRL ITA PRT ROU ESP SWE EU avg. FRA DEU GRC ITA LVA PRT ESP EU avg. -4 -2 0 2 4 6 8 10 12 14 16 0 5 10 15 Ch an ge , 2007-15 (p ps ) Level, 2007 (percent)
3. Involuntary Part-Time Employment
(Percent of total employment)
15–24 yrs. 25–64 yrs. AUT BEL HRV CYP CZE DNK FIN FRA DEU GRC HUN IRL ITA LTU LUX NLD POL PRT SVK SVN ESP SWE GBR EU avg. HRV CYP FINPRTPOL SVK ESP EU avg. -10 -5 0 5 10 15 20 25 0 5 10 15 20 25 30 35 40 45 50 55 60 65 70 Ch an ge , 200 7-15 (p ps ) Level, 2007 (percent) 4. Temporary Employees
(Percent of total employment) 15–24 yrs. 25–64 yrs.
Box 2. Labor Market Institutions, Youth Unemployment, and Income Inequality in Germany The German labor market has become more flexible over the past 20 years. Starting in the mid-1990s, and in the context of greater offshoring opportunities in neighboring Central, Eastern, and Southern European countries after the fall of the iron curtain (Dustmann and others, 2014), wage-setting became gradually more decentralized. Through the Hartz reforms implemented in 2003–05, employment protection legislation (EPL) for fixed-term contracts and regulation of temporary agency work were loosened, and unemployment benefits became less generous, while active labor market policies were expanded and targeting improved, and job placement services restructured (Engbom and others, 2015).1 The reforms boosted labor demand as well as supply, and matching efficiency (Weber, 2015). Other policy measures have further encouraged higher female labor force participation, including a reform of parental leave legislation in 2007, and an increase of subsidized child care (Geyer and others, 2014). As a result, both labor market participation and employment increased spectacularly over the past decade.
This greater flexibility has served young Germans well relative to their European peers. It helped the German economy weather the severe 2009 recession with minimum costs in terms of overall unemployment (Weber, 2015; Scheffel and Krebs, 2017) and, combined with an effective vocational training system (Cahuc and others, 2013), it has contributed to make the German youth unemployment rate the lowest in Europe from 2011 on. Regarding job quality, while the share of employed young people in atypical forms of employment (including so-called mini-jobs) increased sharply after the Hartz reforms, it decreased again strongly in recent years.
The good performance of the young on the labor market in recent years is also visible in the evolution of their income relative to that of older workers. Median wages of full-time employees aged 15–24 have increased faster than those of all full-time employees between 2009 and 2015. Furthermore, while the overall poverty rate has been slowly creeping up in Germany and is slightly below the EU average both for the whole population and for young adults (Vandenbussche and Grevenbrock, 2017), the in-work at-risk-of-poverty rate of individuals aged 15–24 barely changed between 2006 and 2014, while that of individuals aged 25–54 increased. This suggests that the very good shape of the labor market has benefited the young.
___________________________________
1 The effectiveness of active labor market policies is regularly assessed. The Federal Employment Agency’s research institute finds that “occupational training and measures taking place directly at employers have distinctly more positive effects on the labor market prospects of participants [than short training and placement services] conducted by private providers” (IAB, 2015).
0 2 4 6 8 10 12 14 0 2 4 6 8 10 12 14 2000 2002 2004 2006 2008 2010 2012 2014 Germany
Euro area (EA 17)
Difference in Unemployment Rate Between 15-24 Years Old and 25-59 Years Old, 2000-2015 (percent)
Sources: Eurostat and IMF staff calculations.
1.2 1.3 1.4 1.5 1.6 0 1 2 3 4 5
In-work poverty rate (pps) Median wage (ratio; rhs)
Difference in In-Work Poverty Rates and Relative Wages Between 15-24 Years Old and 25-54 Years Old
Sources: Eurostat, German Federal Labor Agency, and IMF staff calculations.
2006
2014
2009
QUANTIFYING THE ROLE OF THE LABOR MARKET AND
FISCAL REDISTRIBUTION
10. Labor market developments and fiscal policy play a key role in poverty and income inequality. The labor market can affect poverty and income inequality through its impact on the
distribution of wages (Salverda and Checchi, 2015) and unemployment. This section focuses on unemployment because differences in nominal wage growth across age groups have not been significant.6 Fiscal redistribution also affects poverty and income inequality, for example, through
generosity and comprehensiveness of social safety nets, taxation, and social insurance contributions (IMF, 2017; Marx and others, 2015).
11. Labor market developments and fiscal redistribution have different impacts across age groups. This section attempts to establish some basic associations between labor market outcome
and fiscal policy choice variables on the one hand, and income and poverty variables for different age groups on the other. Specifically, we run regressions using an annual panel data set of EU countries between 2007 and 2015, similar to the empirical approach from Jaumotte and others (2013) and Dabla-Norris and others (2015).7 The main results are presented in Tables 1 and 2.8
Control variables are included to account for other factors that could affect poverty and inequality, including globalization and technological progress (Pavcnik 2011; Kanbur 2015).9 The data feature
harmonized measurements of income inequality and poverty. This helps overcome limitations on data comparability faced by other cross-country studies (Clements and others, 2015).
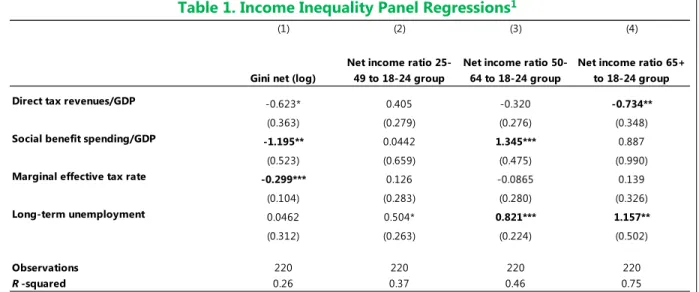
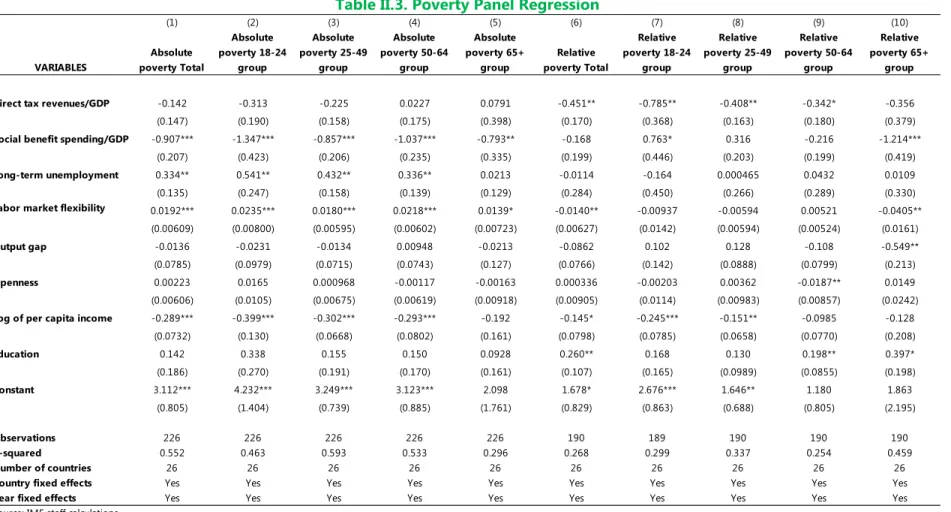
12. A key finding from the regressions is a strong and positive association between inequality across generations and long-term unemployment. The reason is that long-term
unemployment disproportionally affects the young, driving losses in their incomes relative to those of other age groups. Based on our estimates, a 1 percentage point increase in the long-term unemployment rate is associated with an increase of 0.5 percentage points in the income ratio for the 25- to 49-year-old relative to the 18- to 24-year-old; for those older than 65 the increase is 1.2 percent (Table 1, columns 2–4).10 Furthermore, such an increase in unemployment is associated
6 Cross-country data on wage levels by different age groups are limited. Based on the survey data from Eurostat (conducted every four years and available at http://ec.europa.eu/eurostat/web/labour-market/earnings/database), there is no significant difference of nominal wage growth across age groups in Europe between 2006 and 2014. 7 The sample cover only 2007 and onward because of data availability.
8 Appendix II provides full set of results, including robustness tests.
9 The parameter estimates of these control variables are reported in the Appendix II.
10 The empirical analysis did not detect a statistically significant relationship between long-term unemployment and the net Gini coefficient, after controlling for other factors including country and year fixed effects (Table 1, column 1). The result, however, should not be treated as definitive evidence of the general link between income inequality and unemployment. For example, the net Gini coefficient is only one of many measures for income inequality, and the sample covers a relatively short period. Also, there can be income developments among the employed and others that offset the impact on inequality from income developments of the young. Europe’s experience is instructive in this regard because over the course of the crisis the Gini coefficient has not systematically gone up, while incomes of the young relative to retirees have declined.
with an increase in the risk of absolute poverty among the 18- to 24-year-old by 0.5 percentage points versus only 0.3 percentage point for the 50- to 64-year-old and no significant increase for those 65 or older (Table 2, columns 2 and 4). This may reflect lower access to unemployment benefits and minimum income schemes for younger generations. The impact of labor market flexibility on absolute poverty is positive but more uniform across working age groups (Table 2, columns 2–5).11, 12 13. Higher public social spending is associated with lower income inequality and poverty at the aggregate level and with higher incomes for older generations relative to the
18–24 age group. The estimation shows that increasing social spending by 1 percentage point of
GDP is associated with a lower Gini index of net income by 1.2 percent (Table 1, column 1).13 Higher
social spending is associated with significantly higher incomes for the 50–64 age group relative to the 18–24 age group (Table 1, column 3), possibly reflecting support from early retirement or disability schemes for older workers as well as spending on health care. The negative association between social spending and absolute poverty across age groups suggests a more uniform impact of such spending on poverty than relative incomes (Table 2, columns 2–5).14
14. Direct taxation appears to be effective in combatting income inequality and poverty, especially for the young.15 Raising direct tax revenue by 1 percentage point of GDP is associated with a reduction of the Gini index of net income by 0.6 percent (or 0.2 percentage points of Gini index on average; Table 1, column 1). The estimation also shows that a higher marginal effective tax rate is linked to a lower Gini index, which may reflect the impact from a more progressive tax system. More importantly, coefficient estimates show that a 1 percentage point increase in direct taxes relative to GDP on average associated with a reduction of more than 0.7 percentage points in the income ratio between the older-than-65 and 18–24 age groups (Table 1, column 4). The
estimates on the income ratio are not significant for the other age groups. This suggests that income of the elderly is likely to be more affected by an increase in direct tax revenue, for example through higher taxes on pension income. As expected, the estimate of the impact of direct taxes on the risk of absolute poverty is insignificant across all age groups as higher direct taxes do not help reduce absolute poverty (Table 2); however, they reduce measures of relative poverty by bringing down the incomes of wealthier individuals (Table II.3).16
11 Labor market flexibility is measured by the index of flexibility on firing and hiring procedure from World Economic Forum’s Global Competitiveness Indicator database. The variable is excluded from the income inequality regressions as the estimated coefficients are statistically insignificant (see Appendix II).
12 The analysis, however, does not detect a similar pattern when a relative poverty measure is used (see Appendix II). 13 This corresponds to 0.4 percentage points of Gini index on average, given the Gini sample mean of about 0.3. 14 When relative poverty measure is used, the results show that social spending reduces poverty only for the elderly, but increases poverty for the young. Additionally, the impact of composition of social spending is also examined. The estimates are statistically insignificant, and they do not materially affect the rest of the results (see Appendix II). 15 This conclusion is also reached by Ciminelli and others (2017).
16 The impact estimates of direct taxes on relative poverty diminish from 0.8 percentage point for the young to statistically insignificant 0.4 percentage point for the older-than-65 age group (see Appendix II).
Table 1. Income Inequality Panel Regressions1
Table 2. Absolute Poverty Panel Regressions1
LABOR MARKET POLICIES
Employment is key to reducing gaps in opportunity, incomes, and poverty of the young relative to older generations. A major finding in the previous section is a strong and positive association between inequality across generations and unemployment, which affects the young disproportionately. Our analysis indicates that the labor tax wedge, labor institutions, and the economy’s overall performance are closely associated with youth unemployment.
(1) (2) (3) (4)
Gini net (log)
Net income ratio 25-49 to 18-24 group
Net income ratio 50-64 to 18-24 group
Net income ratio 65+ to 18-24 group -0.623* 0.405 -0.320 -0.734** (0.363) (0.279) (0.276) (0.348) -1.195** 0.0442 1.345*** 0.887 (0.523) (0.659) (0.475) (0.990) -0.299*** 0.126 -0.0865 0.139 (0.104) (0.283) (0.280) (0.326) 0.0462 0.504* 0.821*** 1.157** (0.312) (0.263) (0.224) (0.502) Observations 220 220 220 220 R -squared 0.26 0.37 0.46 0.75 Source: IMF staff calculations.
¹ Labor market flexibility is excluded from the income inequality regressions as the estimated coefficients are statistically insignificant. Other control variables include output gap, per capita income, education, trade openness, constant, year and country fixed effects.
Direct tax revenues/GDP Social benefit spending/GDP Marginal effective tax rate Long-term unemployment
Note: Robust standard errors in parentheses, *** p<0.01, ** p<0.05, * p<0.1.
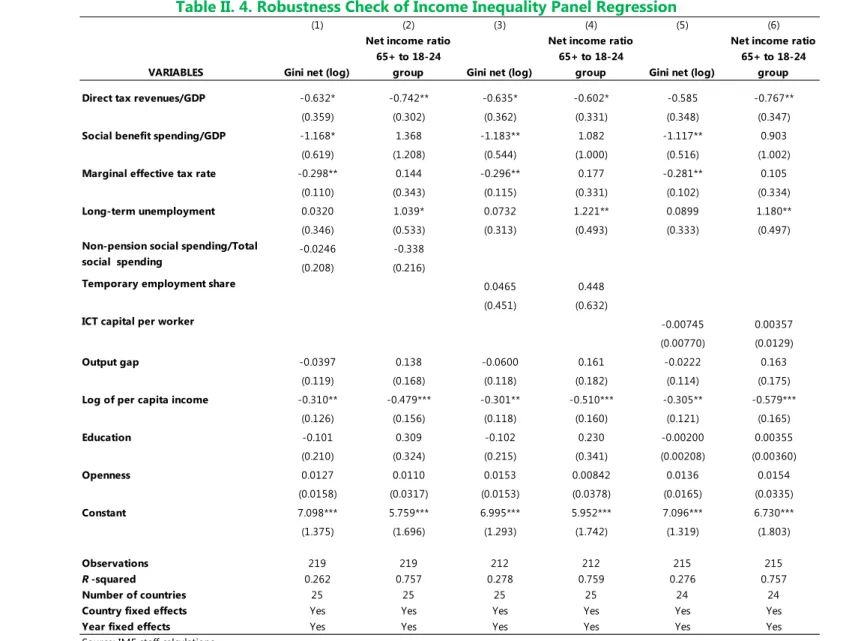
(1) (2) (3) (4) (5) Absolute poverty Absolute poverty 18-24 group Absolute poverty 25-49 group Absolute poverty 50-64 group Absolute poverty 65+ group -0.142 -0.313 -0.225 0.0227 0.0791 (0.147) (0.190) (0.158) (0.175) (0.398) -0.907*** -1.347*** -0.857*** -1.037*** -0.793** (0.207) (0.423) (0.206) (0.235) (0.335) 0.334** 0.541** 0.432** 0.336** 0.0213 (0.135) (0.247) (0.158) (0.139) (0.129) 0.0192*** 0.0235*** 0.0180*** 0.0218*** 0.0139* (0.00609) (0.00800) (0.00595) (0.00602) (0.00723) Observations 226 226 226 226 226 R -squared 0.55 0.46 0.59 0.53 0.30
¹ Absolute poverty is measured by the severe deprivation rate. Other control variables include output gap, per capita income, education, trade openness, constant, year and country fixed effects.
Source: IMF staff calculations. Direct tax revenues/GDP Social benefit spending/GDP Long term unemployment Labor market flexibility
16. Unemployment is the result of a broad range of macroeconomic, structural, and institutional factors. The key explanatory variable is GDP growth (or the output gap)—confirming
Okun’s law (Banerji and others, 2014, 2015). Structural conditions, including demographic variables such as migration flows (Pissarides and McMaster, 1990), as well as the production structure of the economy (Destefanis and Mastromatteo, 2010), also affect unemployment. Institutional factors such as the functioning of the labor market, product market liberalization, and housing policies are also believed to have an impact on unemployment (Boeri and Jimeno, 2016).
17. Youth unemployment is affected by trends in overall unemployment, as well as by additional structural and institutional factors. Studies that examine youth unemployment generally
focus specifically on education and training, labor market institutions, and activation policies.
Education and training. Specific elements of education and training systems seem to have a
larger impact on youth unemployment than overall educational attainment. Dual-education apprenticeships that link work-based and school-based programs are helpful in reducing youth unemployment (ILO, 2013; Zimmerman and others, 2013). It is also important to strengthen education systems, including through intensified individual support, lengthened compulsory schooling, and more labor-market- oriented curricula.
Labor market institutions. The effects of employment protection legislation (EPL) and temporary
contracts—which contribute to labor market duality—on youth unemployment are mixed. The young are more likely to work under temporary contracts than older workers, which could leave them more vulnerable to losing their jobs during a recession (Choudhry and others, 2012). Conversely, countries with stronger EPL—which tend to have a higher prevalence of temporary contracts—appear to have suffered fewer job losses among the young during the great
recession (O’Higgins, 2012).
Active labor market policies (ALMPs). ALMPs share the common goal of putting people to work,
but vary widely in scope and funding. It is therefore no surprise that finding an empirical link between this broad category of policies and youth unemployment has proven elusive. Some studies find that ALMPs have a larger impact on youth than on overall unemployment
(Choudhry, and others, 2012), whereas others find only limited effect (Crépon and van den Berg, 2016). There is some evidence that the effectiveness of ALMPs is dependent on program design, with wage subsidies, services, and sanctions deemed most effective (Kluve, 2006).
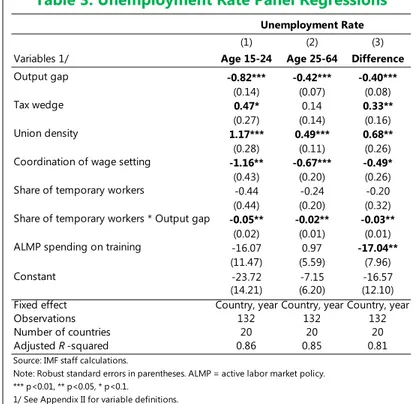
18. To assess the impact of labor market policies on youth poverty and inequality across generations, this section seeks to identify the drivers of unemployment rates of young and older workers, as well as the difference across age groups (Table 3 and Appendix II).17 We use a
panel regression covering the period 2007–14 to be consistent with the previous set of regressions. A regression covering a longer period (2001–14) suggests that the results are robust. Results suggest that, in addition to the output gap, taxation, specific labor market institutions, and policies are closely associated with youth unemployment.
17 We use a panel regression covering the period 2007–14 (for consistency with the analysis in Section II). A
Output gap. The output gap is
significantly negatively associated with unemployment, that is, recovery or boom times are associated with falling
unemployment and vice versa for recession times. However, the changes in the economic cycle affect young workers more than their older counterparts—almost twice as strongly, and so also help explain the unemployment gap between younger and older workers. This could be due to a host of factors: younger workers’ more limited job-specific skills; lower protection through EPL with a greater share of the young in temporary and part-time jobs
(Figure 3); or even perceptions of social fairness, in which the young are considered more easily able to cope with unemployment compared to, say, older workers who may support families.
Taxation. A higher labor tax wedge is associated with higher unemployment (Bassanini and
Duval, 2007; OECD, 2006). Our findings suggest that the change in the tax wedge is significant in explaining the unemployment rates of young workers (though not that of older workers). Young workers generally have less accumulated human capital, their productivity is lower than that of more experienced workers, and the marginal cost of taxation is higher, especially where progressivity of taxation is low (as is the case with most social security contributions).
Labor market institutions—unionization. Higher union density appears to be associated with
higher unemployment levels, particularly for younger workers.18 This outcome may have arisen
because unions may be less attentive to the specific challenges facing the young who have trouble entering the labor market. It could also reflect other factors that have driven both union density and unemployment and that are not among the explanatory variables––indeed, in most EU countries, unionization rates declined during 2004–13, particularly among the young even as youth unemployment rose.19
18 However, Jaumotte and Buitron (2015) find that lower union density is associated with higher inequality as workers’ bargaining power is reduced. This is not inconsistent with our findings: raising the remuneration of those in
employment should reduce overall inequality, since it narrows the gap with the top earners. However, it may not preempt or even increase inequality across generations if unemployment in a specific age group, such as the young, therefore rises.
19 Data on union density by age group are difficult to obtain. However, it appears that union density for younger workers has declined faster than for older workers in recent years. A notable exception is Germany, where union density of the young has risen faster than overall unionization since 2004 (after a significant decline over the preceding decade, though).
Table 3. Unemployment Rate Panel Regressions
(1) (2) (3)
Variables 1/ Age 15-24 Age 25-64 Difference
Output gap -0.82*** -0.42*** -0.40*** (0.14) (0.07) (0.08) Tax wedge 0.47* 0.14 0.33** (0.27) (0.14) (0.16) Union density 1.17*** 0.49*** 0.68** (0.28) (0.11) (0.26) Coordination of wage setting -1.16** -0.67*** -0.49* (0.43) (0.20) (0.26) Share of temporary workers -0.44 -0.24 -0.20 (0.44) (0.20) (0.32) Share of temporary workers * Output gap -0.05** -0.02** -0.03**
(0.02) (0.01) (0.01) ALMP spending on training -16.07 0.97 -17.04**
(11.47) (5.59) (7.96)
Constant -23.72 -7.15 -16.57
(14.21) (6.20) (12.10) Fixed effect Country, year Country, year Country, year
Observations 132 132 132
Number of countries 20 20 20
Adjusted R -squared 0.86 0.85 0.81
Source: IMF staff calculations.
Note: Robust standard errors in parentheses. ALMP = active labor market policy. *** p<0.01, ** p<0.05, * p<0.1.
1/ See Appendix II for variable definitions.
Labor market institutions—wage setting mechanisms. The union density variable does not fully
capture the role of unions in labor market functioning and in enabling outcomes that address both unemployment as well as inequality: for example, cooperative industrial relations that foster collective bargaining agreements that take the overall macroeconomic situation and unemployment into account can play an important role in lowering unemployment
(Siebert, 1997). Whether such strong relations exist is not a function of union density. Here the explanatory variable that captures the degree of coordination in the wage setting process is negatively associated with the level of unemployment, particularly for the young.20 Unions can
also contribute significantly to designing effective apprenticeships and training programs for workers (see below).
Labor market institutions—temporary contracts.21 Temporary work contracts are
more frequent where permanent contracts are subject to more stringent employment protection legislation. While the negative effect on job security is evident, the impact on youth unemployment is more ambiguous. The young, who are typically much more likely to have temporary contracts than older workers, can become more easily
unemployed in a downturn (Carmeci and Mauro, 2003). On the other hand, temporary contracts may also make it easier for
employers to resume hiring once growth returns. Our findings are consistent with a stronger cyclical response of the youth unemployment rate because a higher share of the young hold temporary jobs.
Training and education. Changes in spending
on ALMPs that focus on training and education appear to affect the difference in unemployment rates between the young and rest of the working age population (though they are not significant in explaining the
20 For a third variable measuring the functioning of the labor market, union contract coverage, data points are insufficient to be included in the regressions.
21 An indicator of the strength of employment protection legislation is not available for many of the countries in the sample.
Employment Protection and Temporary Jobs, 2013
Sources: Eurostat and OECD.
Training and Youth Unemployment, 20151
Source: Eurostat.
1 Countries with available data.
AUT DEU DNK SWE FIN NLD BEL LUX GBR IRL FRA ITA ESP PRT GRC 0 5 10 15 20 25 30 35 40 45 0.5 1.5 2.5 3.5 Sh ar e of tem por ar y em pl oy ees in a ge g ro up 25 -29 ye ar s
Employment protection legislation index for permanent contracts
unemployment rates themselves).22, 23 However, the effectiveness of ALMPs also depends
crucially on design features: early intervention, targeting and tailoring to counteract specific disadvantages, imparting of skills, and responsiveness to labor market needs (ILO 2011, 2013). Programs outside of ALMPs that systematically build skills of labor market entrants (for example, young workers) such as the dual-education apprenticeships in Austria, Denmark, or Germany can also play a significant role in lowering youth employment (Brunello and others, 2007; Checchi, 2006; Zimmerman and others, 2013).24
FISCAL REDISTRIBUTION
European social protection systems have better protected the elderly from the impact of the global financial crisis than the young. Owing to fiscal constraints, non-pension social benefits have often been curtailed, not indexed to inflation, or more narrowly targeted. As a result, the young were not
adequately covered against unemployment risk and the impact of precarious jobs.
19. Europeans’ demand for fiscal redistribution is associated with both income inequality and poverty but not with youth poverty (Appendix IV). This may partly explain why social
protection does not adequately protect the young, notably during severe economic shocks. This, in turn, can marginalize the young and have long-lasting social and political consequences (Flash Barometer of the European Parliament, 2014). Moreover, social protection systems were historically designed to address old age risks—a practice that has been reinforced by the political economy of an aging population.
22 We have also considered other commonly used labor market policy variables such as the net replacement rate of social benefits, the ratio of minimum to median wages, and others (see Appendix II).
23 This hypothesis cannot be estimated as ALMP spending is not available by age group.
24 This variable is not included in our regression, since data availability on school- and work-based vocational programs is limited, reducing the sample size. Broader-based indicators of education levels are not significant.
Preferences for Redistribution and Gini of Net Income, Total, 2002–14
Preferences for Redistribution and At- Persistent-Risk-of-Poverty Rate, Total, 2002–14
Sources: European Social Survey; SWIID; and IMF staff
calculations. Sources: European Social Survey; SWIID; and IMF staff calculations.
2.5 3.0 3.5 4.0 4.5 5.0 0 5 10 15 20 At-persistent-risk-of-poverty rate Correl. = 0.59 In fa vo r o f re di st rib ut io n( sc ore fr om 1– 5) 2.5 3.0 3.5 4.0 4.5 5.0 20 25 30 35 40 45
Gini of net income
Correl. = 0.47 In fa vo r o f re di st rib ut io n( sc or e f ro m 1– 5)
A. Social Protection Systems Shielded the Elderly from the Impact of the
Crisis and Fiscal Consolidation…
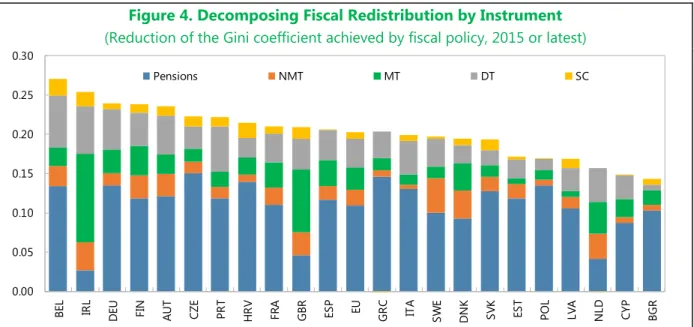
20. Fiscal redistribution in Europe is mainly achieved by focusing on the elderly. This
situation reflects two main factors. First, there is the sheer size and large redistributive impact of pension spending. Except for Ireland (Box 4), the Netherlands, and the United Kingdom, most of the reduction in income inequality is achieved through public pension spending (Figure 4).25 Market
income inequality among the elderly is significantly larger than among the working-age population but becomes smaller after redistribution, owing to the large share of social spending on pensions (old age spending accounted for 53 percent of EU countries social spending in 2015; Eurostat, 2017), the redistributive impact of minimum pensions and, in many countries, caps on benefits (Avram and others, 2014). In other words, it is through the reduction of inequality among the elderly that most of the reduction of income inequality is achieved in Europe. While the impact of in-kind benefits on inequality across generations is not considered in this analysis, it is likely to be significant as health spending generally increases with the age of a person (European Commission, 2015a), especially toward the end of life. Second, pensioners benefit from a more favorable tax treatment than the rest of the population at the same level of income, such as extra tax allowances and full or partial relief on taxes and social security contributions on pension income (OECD, 2015b). However, the impact of taxes on reducing inequality plays a much smaller role than that of transfers.
25 As the focus is on fiscal redistribution, the impact of privately managed pension schemes is not taken into account.
OECD EU Average Redistributive Effect, 2014
(Gini score)
Personal Income Taxes and Social Security Contributions Paid by Pensioners and Workers
(Percent of earnings)
Source: OECD. Sources: OECD Pensions at a Glance and IMF staff calculations.
Note: Data labels use International Organization for Standardization (ISO) country codes.
0.0 0.1 0.2 0.3 0.4 0.5 0.6 0.7 0.8 0.9
Gini (market income, before taxes and transfers)
Gini (disposable income, after taxes and transfers) Total population Working-age population: 18-65 Retirement-age population: above 65 AUT BEL DNK EST FIN FRA GBR GRC ITA LUX NLD POL PRT SVN SWE DEU CZE ESP IRL EU Median 5 10 15 20 25 30 35 40 45 5 15 25 35 45 Pe ns io ne rs (I nc om e = a ver ag e ea rn in gs )
Worker at average earnings 45°
21. Pension reforms adopted during the global financial crisis protected current pensioners, while shifting most of the adjustment burden to future generations of retirees. Cuts in pension payments were
temporary and more limited than for other social benefits, to protect acquired rights. Minimum pensions were preserved to avoid increasing old-age poverty. Pension reforms were primarily implemented for sustainability reasons. In many countries, most of the reductions in benefit ratios will be implemented after 2025, protecting workers close to retirement, although nearly 60 percent of the changes in eligibility ratio (share of public pensioners to population aged 65 and older) will take place by that date. Thus, though pension reforms make the system more
sustainable and will reduce the burden on future
working-age population, they also imply lower replacement rates and longer contribution periods for today’s young. These are more difficult to meet as high unemployment and precarious jobs affect their contribution history. When they retire, today’s youth may well face a higher risk of
poverty than current pensioners.26 They may also face higher burdens on their disposable income on
26 Social Protection Committee (2015) describes the treatment of unemployment periods.
Figure 4. Decomposing Fiscal Redistribution by Instrument
(Reduction of the Gini coefficient achieved by fiscal policy, 2015 or latest)
Sources: EUROMOD and IMF staff calculations.
Note: Pension spending includes old age, disability and survivors. DT = Direct taxes, MT= means-tested spending, NMT = non-means-tested spending, SC = Social contributions. Data labels use International Organization for Standardization (ISO) country codes.
Projected Reductions in Benefit Ratios (2013–60) and Share of Reductions Achieved by 2025 (Percent)
Sources: European Commission, 2015a Ageing Report, and IMF staff estimates.
Note: Data labels use International Organization for Standardization (ISO) country codes.
0.00 0.05 0.10 0.15 0.20 0.25 0.30 BEL IRL DEU FIN AUT CZE PRT HRV FRA GBR ESP EU GRC ITA SW E DN K SV K ES T PO L LV A NL D CYP BGR Pensions NMT MT DT SC BEL BGR CZE DNK DEU EST IRL GRC ESP FRA HRV ITA CYP LTU HUN MLT NLD AUT POL PRT ROU SVN SVK FIN SWE GBR -20% 0% 20% 40% 60% 80% 100% 120% 140% 0% 10% 20% 30% 40% Sh ar e o f r ed uc ti on o ve r 2013 -2 0 25
Percent reduction in benefit ratio 2013-2060 EU median
account of higher public debt; analyzing the long-term consequences of recent fiscal policy, however, lies beyond the scope of this paper.27
22. Finally, in most countries, indexation of pensions insulated elderly citizens’ purchasing power from the impact of the crisis. The statutory indexation of pensions,28 though weakened on
a temporary or permanent basis in many countries (European Commission, 2015b), contributed to real income increases for pensioners (Figure 2).
B. … But not the Working Age Population and, Notably, the Young
23. In contrast, owing to fiscal constraints, non-pension benefits were: not systematically indexed. In many countries, non-pension benefits adjustments lagged
inflation, reducing their real value (Bargain and others, 2015; De Agostini and others, 2014; McKnight and others, 2016) and contributing to the decline in real incomes of the working age population (Figure 2). This is the case of the Czech Republic where all social benefits were de-indexed except pensions and housing benefits (Box 3) increasing the already high share of redistribution achieved through pensions (Figure 4).
cut or curtailed in some countries. Family allowances, which play a crucial role in income
support of the parents, in most cases regardless of their working status or of the young’s involvement in education and training, were reduced in several countries such as the United Kingdom in 2013 and France in 2014–15 (OECD, 2014a; Social Protection Committee, 2015). Spending on youth work was reduced in many EU countries and more targeted on the needs of disadvantaged people (Social Protection Committee, 2015; Dunne and others, 2014). Thus, Hüttl and others (2015) argue that the growing inequality and poverty gap across generations was in part due to policy decisions because at a time when “youth unemployment and youth poverty rates increased, government spending shifted away from education, families and children towards pensioners.”
more targeted/means tested. As universalist programs often seem too expensive when public
budget constraints become more binding, there is a tendency to increase the targeting of social spending and reduce universal benefits (Gugushvili and Hirst, 2014; van Oorschot and Roosma, 2015). The global financial crisis reinforced this shift. The impact on poverty and inequality critically depends on the design of the targeting such as eligibility criteria and limited take-up. This is illustrated with two cases, the Czech Republic and Ireland; each has high fiscal redistribution and has increased it in the past decade; Ireland by increasing means testing and the Czech
Republic by moving from means testing to another way of targeting benefits based on variables correlated with poverty (notably the number of children) that avoid stigma, reduce administrative
27 Similarly, analyzing whether today’s wealth differentials may contribute to widening income differential between young and old in the future lies beyond the scope of this paper.
28 Pensions in the EU are linked to wages or prices (or to both) but recently there has been a trend to move toward price indexation (European Commission, 2015b).
costs and burdens, and minimize work disincentives (Boxes 3 and 4). Both approaches were successful. Their experiences show that redistribution can be improved in different ways.
24. Thus, old-age spending grew faster than other benefits, including automatic stabilizers.
They contributed to more than 60 percent of the increase in social spending in Europe during the last decade. This is not driven by the aging of the population. Between 2006 and 2012, the number of pension beneficiaries in the EU increased by 3 percent, while real pension expenditure rose by 11.7 percent (Eurostat, 2016).29
25. The design of unemployment benefit systems also contributed to increased youth poverty. The share of young unemployed
receiving unemployment benefits has declined since 2007 and is significantly smaller than the share for older unemployed (Leschke, 2015). Unemployment benefit systems offer less generous protection for the young than for the rest of the working age population mainly because of eligibility criteria and duration of
unemployment benefits. Regarding eligibility, because unemployment benefits are insurance-based, they require a minimum contribution period (which varies across Europe), a criterion that the young have difficulty meeting, either because they are unemployed after leaving school or because precarious and short-term job
contracts limit their contribution periods. In 2012, youth without employment histories were eligible for unemployment benefits or unemployment assistance in 10 of the 21 European Union
members of the OECD. For those not eligible, social assistance was available everywhere except in two countries that had a minimum age requirement (Carcillo and others, 2015). Moreover, duration of unemployment benefits is often linked to a contribution period or the age of the unemployed (Arnold and others, 2015; Queyranne, 2017), leading to a shorter effective duration of
unemployment benefits for the young.
29 Nonetheless, the fiscal consolidation resulted in the slowdown in the growth of pensions as “the growth in the number of beneficiaries was broadly constant each year over the period while most of the increase in expenditure was concentrated between 2006 and 2009 (9 percent rise) and only small increases were noted from 2010 to 2012” (Eurostat, 2016).
Composition of the Changes in Social Spending (2007–14, percentage points of GDP)
Source: Eurostat.
Note: Social assistance covers family/children, social exclusion, and housing. Data labels use International Organization for Standardization (ISO) country codes.
Beneficiaries of Unemployment Benefits in the EU by Age Group and Type of Contract
(in percent of unemployed)
Source: Janine Leschke. -4.0 -2.0 0.0 2.0 4.0 6.0 8.0 AU T BEL CZE DEN FIN FRA DEU HUN LIR ITA NDL POL PRT SVK SVN ES P SW E GB R EU a vg .
Old age Survivors Disability Sickness/health care Unemployment Social assistance
0 10 20 30 40 50 60 70 A job of limited duration has ended Dismissed or made redundant A job of limited duration has ended Dismissed or made redundant 15-24 30-64 2007 2013
C. Taxes Could Play a Larger Role in Reducing Income Inequality
26. Taxes play a much smaller role inreducing inequalities in Europe (Figure 4).
This is also evident in the findings above (Tables 1 and 2). First, indirect taxes (35.1 percent of total tax revenues), which are generally considered regressive (IMF, 2017), contribute more than direct taxes (33.8 percent) to revenue. In addition, social security contributions (SSC) are generally levied at flat rates, except in some countries which reduce SSC for low income earners (OECD, 2014). Progressivity of direct taxes (personal income tax and SSC) remains low in many countries at both lower and higher income levels, especially in Eastern Europe, contributing to their limited redistributive impact (IMF, 2017). However, many advanced European economies improved personal income tax progressivity for low-income earners through in-work benefits (Joumard and others 2012), and family benefits for low-income families with children (OECD, 2014b).
Taxes on capital income and wealth, which are mostly borne by older generations, play a marginal role (both in terms of GDP and as a share of total taxes) including taxes on inheritances and gifts which could help limit intergenerational inequality. Importantly, there has been a sharp decline in taxes levied on capital and financial transactions in Europe during 2007–15 (Clements and others, 2015; IMF, 2017).
Box 3. Czech Republic: Reforming the Targeting of Social Spending
The Czech Republic has one of the lowest inequality and at-risk-of-poverty rates in the EU and OECD, while its social spending as a share of GDP remains below the average and heavily focused on pensions. The low inequality level can be explained by the redistributive policies targeted at low-income groups and most at-risk-of-poverty groups: the unemployed, single parent families, and families with two and more children. In the 2007–08 tax and welfare reform, the Czech Republic moved away from income testing of family benefits to a single eligibility threshold, and simultaneously increased tax credits (basic and per child).1 The
objectives were to address some of the well-known drawbacks of means testing i.e., to make the social system simpler, cheaper and more user friendly by reducing the paperwork for the social service users. In addition, families with children enjoy a significantly lower effective tax wedge. Finally, all social benefits, except for pensions and housing benefits, ceased to be automatically indexed to cost of living measures, and the unemployment benefit was tightened.
Personal Income Tax and Social Security Contribution Progressivity, 2015
Sources: OECD and IMF staff calculations.
Sources: OECD and IMF staff calculations.
Note: Progressivity at low (high) income level is calculated as the difference between the average rate of income tax and the employees' social security contributions for a single person (without children) at 67 percent of average earnings (at 167 percent of average earnings) and at average earnings. Data labels use International Organization for Standardization (ISO) country codes. IRL SWE ITA GRC NLD LUX PRT FIN BEL GBR ESP DNK EU avg. FRA SVN AUT DEU CZE SVK EST LVA POL HUN -13 -12 -11 -10 -9 -8 -7 -6 -5 -4 -3 -2 -1 0 0 1 2 3 4 5 6 7 8 9 10 11 12 13 Pr og re ss iv ity a t L ow In co m e
Progressivity at High Income
High progressivity Low progressivity
Box 4. Ireland: Increasing the Targeting of Social Spending
The Irish social protection system mainly targets the neediest through highly means-tested social transfers. Ireland combines a progressive tax system with a high share of means-testing of social benefits: about a third of social protection and about 55 percent of pensions, which play a limited redistributive role in Ireland, are excluded (Giustiniani, 2017).
During the global financial crisis, the share of means-tested benefits increased. Aimed at improving the social conditions of the most disadvantaged, while keeping adequate incentives to return to work, the system of social benefits was significantly recalibrated: eligibility criteria were tightened, means testing was strengthened, the duration of some benefits was shortened, and allowances were in some cases reduced, while back-to-work/school programs were reinforced. Recently, Ireland has sought to address work disincentives created by the tax benefit system by tapering the withdrawal of benefits when beneficiaries return to work.
Ireland’s welfare system performs strongly in mitigating income inequality and poverty. Social benefit spending in cash (in purchasing power and per capita) is in line with the EU average but its welfare system seems to be more focused on poverty reduction (measured by the difference between the share of
population at risk of poverty before and after transfers) than on income redistribution. However, if pensions are excluded, Ireland’s efficiency in redistributing income and fighting poverty is well-above EU peers. This suggests that the degree of income redistribution that other EU countries achieve through pension spending, is achieved through social benefits in Ireland and direct taxes.
Box 3. Czech Republic: Reforming the Targeting of Social Spending (Concluded) Social benefits became more efficient at reducing
inequalities and alleviating poverty. In contrast to many other countries in Europe, the risk of poverty of the young has declined in the Czech Republic while total spending on family benefits remained almost unchanged. Fiscal
redistribution is reducing income inequality by the same amount in 2015 as in 2007 (a reduction of the Gini of 0.22). At the same time, pensions continue to play the biggest role in fiscal redistribution and were safeguarded at the time of post-crisis fiscal consolidation. However, unlike other European countries, it did not result in the increase in inequality across generations. Real incomes of the elderly grew slower than for other age groups and the ratio of 65+/18–24 incomes stayed below 1 (at 0.85 and unchanged).
Recent fiscal measures adopted in 2016–17 include further increases in income tax credits for families with children. While these measures help reduce poverty and inequality, their design could be improved to bring down very high marginal effective tax rate on secondary earners, which is one of the key factors constraining labor force participation of women with young children.
__________________
1 Key measures included the introduction of a higher standard tax credit (2008), the change in housing allowance and the social
assistance supplement for housing (2007), the changes in family benefits (2007–08), the reform of the minimum living standard and the introduction of the single personal income tax rate. The first four of these reforms apply primarily to households with earnings below the average wage (Dalsgaard, 2008).
BEL CZE DNK DEU EST IRL GRC ESP FRA ITA HUN NLD AUT PRT SVN SVK FIN SWE GBR ISL NOR CHE -4 -2 0 2 4 6 8 10 -20 -15 -10 -5 0 Ch an ge in p ov ert y ra te , < 18, 2007 –1 5
Difference in tax wedge for families with kids Tax wedge Difference and Change in Youth Poverty (percentage points)
Sources: Eurostat; OECD; and IMF staff calculations. Note: Data labels use International Organization for Standardization (ISO) country codes.
Box 4. Ireland: Increasing the Targeting of Social Spending (Concluded)
Contributor: Alessandro Giustiniani.
Sources: EUROMOD, Eurostat, and IMF staff calculations.
1 Positive values indicate a lower Gini coefficient after social transfers and hence a more equitable income distribution. 2 Positive values indicate a decline in the at-risk-of-poverty ratio due to social transfers.
Note: Data labels use International Organization for Standardization (ISO) country codes.
CONCLUSION: POLICY IMPLICATIONS
27. Overall income inequality has remained broadly stable in the EU over the past decade but disparities in poverty and income inequality across generations have increased markedly.
Developments and drivers of overall inequality are well documented but the generational dimension of inequality has received much less attention. In Europe, real disposable incomes of the young have fallen behind those of other generations. Also, the young are facing increasing risks of poverty relative to those faced by other generations. This SDN is a first step in documenting these widening income and poverty gaps across generations in Europe and in discussing the role of labor market developments and public policies.
28. The ongoing cyclical upturn is likely to improve opportunities for the young, but policy measures aimed at labor markets, social protection, and fiscal redistribution are nonetheless needed to stop the young from falling further behind over time. Low youth
incomes and youth poverty are rooted in high youth unemployment and weaknesses in public
BEL CZE DNK DEU IRL ESP FRA ITA NLD AUS PRT FIN SWE GBR 8 10 12 14 16 18 20 8 10 12 14 16 18 20 0 2,000 4,000 6,000 8,000 10,000 Im pr ov em en t of G in i du e to S B (pps ) 1
Income Redistribution and Social Benefits, 2007-14 (averages) lo w er in co m e in eq ua lit y
Social benefits per person (in purchasing power standard)
BEL CZE DNK DEU IRL ESP FRA ITA NLD AUS PRT FIN SWE GBR 0 2 4 6 8 10 12 14 16 0 2 4 6 8 10 12 14 16 0 1,000 2,000 3,000 4,000 Im pr ov em en t of G in i du e to S B (pps ) 1
Income Redistribution and Social Benefits, 2007-14 (excl. pensions, averages)
lo w er in co m e in eq ua lit y
Social benefits per person (in purchasing power standard)
BEL CZE DNK DEU IRL ESP FRA ITA NLD AUS PRT FIN SWE GBR 10 15 20 25 30 35 40 10 15 20 25 30 35 40 0 2,000 4,000 6,000 8,000 10,000 At-Risk-of-Poverty and Social Benefits, 2007-14 (averages) le ss r isk o f p ov er ty
Social benefits per person (in purchasing power standard)
Re du cti on in r is k of pov er ty du e to S B (pps ) 2 BEL CZE DNK DEU IRL ESP FRA ITA NLD AUS PRT FIN SWE GBR 0 5 10 15 20 25 0 5 10 15 20 25 0 1,000 2,000 3,000 4,000
At-Risk-of-Poverty and Social Benefits, 2007-14 (excl. pensions, averages)
le ss r isk o f p ov er ty
Social benefits per person (in purchasing power standard)
Re du cti on in r is k of pov er ty du e to SB (pps ) 2