Master in Management - Major Finance
Master Research Paper
Academic Year 2018-19
Impact of trade credit reduction on economic indicators
Impact of LME regulation on employment creation, revenues and
assets growth
Author: Supervisor:
Omar Ibrahim Pr. Jean-Noël Barrot
[email protected]
Abstract: This paper evaluates the impact of the reduction of inter-companies’ trade credit due to the implementation of the LME law (2008) on the French economy. First, through this study, we succeeded in concluding that trade credit reduction has a positive effect on employment creation, revenues growth, and assets growth. Second, during the last decade, the application of the LME law helped to create around 0.7% additional employment opportunities compared to the possible 1.7% if the regulation was strictly followed and generates limited growth in revenues and assets. Finally, in 2017, some companies were still not fully compliant with the law. The strict application of the regulation in 2017 could have created around 165 thousand new employment for the French companies, generated a 0.3% growth in revenues and increased assets by around 0.2%.
Keywords: trade credit reduction, employment creation, revenues growth, assets growth, LME regulation
Summary
Introduction ... 6
The law and its background ... 7
A. The French economic context ... 7
B. The modernization of the economy Law - LME ... 7
C. Overview of the payment delays in France ... 8
Literature review ... 12
Theoretical model ... 14
A. Understanding the LME regulation ... 14
B. Hypothesis ... 14
C. Implementation strategy ... 15
Empirical analysis ... 16
A. The data – Diane database ... 16
B. Extraction of financial information ... 17
C. Data cleaning ... 18
D. Summary statistics - Global ... 18
Results ... 20
A. Validate the instrumental variable ... 20
B. Impact of change in the trade balance ... 21
Analysis of the benefit of the LME regulation on our companies’ sample ... 22
A. The expected benefit from the introduction of the LME law in 2008 ... 22
B. The real benefit from the introduction of LME law during the last decade ... 24
C. The potential benefit from a strict application of LME regulation in 2017 ... 27
D. Analysis of the benefit of the LME regulation on the French economy ... 28
Limits and potential extensions ... 30
Conclusion ... 31
Figures summary
Figure 1- Trade payment terms in France (2002-2017) (Prost, 2019) ... 8
Figure 2- Evolution of trade debt payment without delay (2002-2017) (Prost, 2019) ... 9
Figure 3- Large companies payment delays distribution ... 10
Figure 4- Medium companies payment delays distribution ... 11
Tables summary
Table 1- Payment deadlines by companies’ size in 2017 (Prost, 2019) ... 9
Table 2- Financial information Diane codification ... 17
Table 3- Data summary for 2007 ... 18
Table 4- Data summary for 2017 ... 19
Table 5- Average trade credit for 2007 and 2017 ... 19
Table 6- OLS regressions results testing the validity of trade balance surplus as IV ... 20
Table 7- Regression of the impact of change in trade balance ... 21
Table 8- Main economic indicator by companies' category in 2007 (Size) ... 23
Table 9- Impact of the strict application of the LME law ... 24
Table 10- Main economic indicator by companies' category (Size) in 2017 ... 25
Table 11- Impact of the LME regulation between 2007 and 2017 ... 26
Table 12 - comparison between expected vs realised performances between 2007 - 2017 ... 26
Table 13- Impact of the strict application of the LME law in 2017 ... 28
Table 14- LME surplus transfer in 2017 for the overall French economy ... 29
Introduction
Companies use trade credit to finance part of their operations. This means of financing consists of a deferred payment of bills and helps companies paying their suppliers after generating part of their revenues.
Most companies benefit from and provide trade credit to suppliers. Determining the right balance between the consumers’ receivable debt and the suppliers’ payable debt is crucial for a great performance of any business. However, these deferred payment practices have strongly increased creating increasingly longer trade credit for transactions between companies. Scholars and governmental authorities believe that longer trade credit will hurt the economy, companies’ operations and most importantly SMEs. Thus, many countries are implementing regulations aiming to reduce the effect of late or deferred payments between companies. For instance, French authorities introduced the LME regulation in 2008 aiming to impose a limit of 60 days on inter-companies’ trade credit.
In this paper, we will assess the effectiveness of such regulation on the French economy and most importantly measure the impact that it will have on employment creation, revenues growth, and assets growth.
Section 1 introduces the LME regulation and provides an overview of the French economic context at the time of the introduction of the LME law and during the decade that follows. Also, it will analyse the evolution of trade credit between 2002 and 2017.
Section 2 reviews the impact of a reduction of inter-companies’ trade credit discussed in the economic literature.
Section 3 aims to present a theoretical model that simulates the impact of any payment period reduction on economic indicators such as employment growth, revenues growth, and assets growth.
Sections 4 and 5 describes the results of our empirical analysis and explains the real impact of a reduction of trade credit.
Section 6 aims to measure the real impact of the regulation on the French economy if strictly and fully applied: first at the introduction of the law and second a decade later. It will also measure the real impact of the LME regulation in the last decade.
The law and its background
A.
The French economic context
The difficult economic situation in France in the last two decades was reflected in tensions over corporate cash flow and payment difficulties leading companies to have a strong temptation of imposing longer trade credit. However, according to (Lorenzi, 2014), allowing such practices will in the long term destabilize the structure and trade mechanism within a sector or an economy.
Starting from 2008, the French government aimed to reduce the impact of payment delays on the economy by implementing a 60 days limit for companies to pay their suppliers through the newly announced LME law (“Loi de modernization de l’économie”). The year 2013 was also particularly important in commitments and decisions on the issue of payment delays, particularly with the announcement of the plan for corporate treasury, and then the discussion of the law on consumption. (Lorenzi, 2014)
B.
The modernization of the economy Law - LME
The limit imposed on trade credit, introduced by the law of 4 August 2008 on the modernization of the economy (LME), is set by Article L441-6 of the Commercial Code:
“Unless otherwise agreed by the parties, the payment period shall be set on the thirtieth day following the date of receipt of the goods or performance of the service. The period agreed between the parties cannot exceed 60 days from the date of issue of the invoice by way of derogation, a maximum period of forty-five days end of month from the date of issue of the invoice may be agreed by contract between the parties in the event of a periodic invoice, the agreed period may not exceed forty-five days from the date of issue of the invoice, in accordance with Article 123 of Law No. 2014-344 of 17 March 2014.
The method of computation of the period of 45 days end of month is not imposed by the law; the operators have the freedom to calculate it in two ways: either by adding 45 days at the end of the month of issue of the invoice, or by adding 45 days to the date of issue and then until the end of the month. month. The method of calculation used must, however, be agreed beforehand between the commercial partners to avoid any ambiguity”. (CEDEF, 2019)
C.
Overview of the payment delays in France
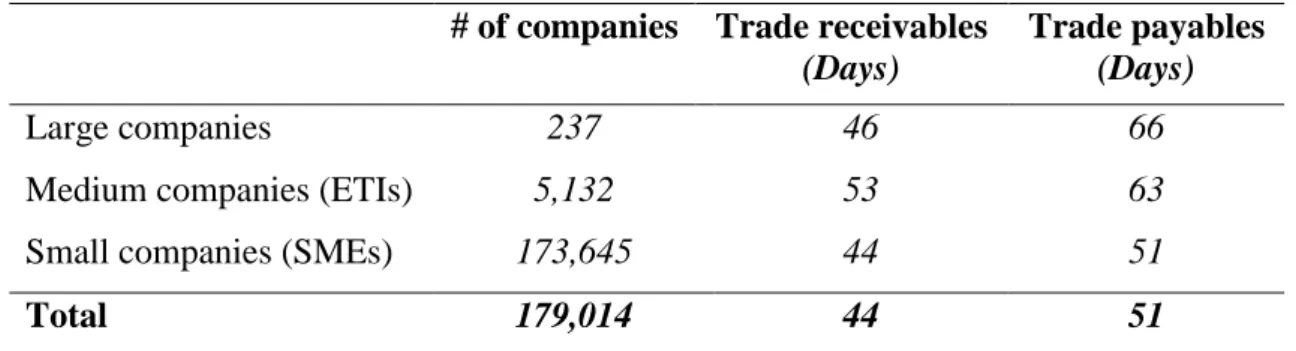
According to “Banque de France”, trade credit payments are below the limit of 60 days imposed by the LME law. Trade receivables were stable for the last years reaching 44 days (days of revenues) in 2017 when the trade payables decreased by three days (days of purchase costs) reaching 51 days. (Prost, 2019)
According to Figure 1, the efforts made by companies these last years were modest compared to the decrease that happened after the implementation of the LME law in 2008.
However, the payment delays are not uniform within the pool of the French companies. Large companies are benefitting from larger payables trade credit (66 days) while the medium-sized companies (ETI) are the ones characterized by the larger receivable’s trade credit (53 days) according to Table 1. 40 45 50 55 60 65 2002 2005 2008 2011 2014 2017
Trade receivables (days) Trade payables (days)
Figure 1- Trade payment terms in France (2002-2017) (Prost, 2019)
This _gure
shows the distribution of total government contracts (Panel A) and government contracts
eligible to acceleration (Panel B) aggregated at the county level in the two years prior to
the reform, normalized by total county payrolls. Darker shades indicate larger intensity
county level exposure.
This graph displays the evolution of clients and suppliers payment delays between 2002 and 2017 in France. Trade receivables delays are expressed in terms of days of sales and trade payables delays are expressed in terms of days of purchase cost
Table 1- Payment deadlines by companies’ size in 2017 (Prost, 2019) # of companies Trade receivables
(Days)
Trade payables
(Days)
Large companies 237 46 66
Medium companies (ETIs) 5,132 53 63
Small companies (SMEs) 173,645 44 51
Total 179,014 44 51
Also, we noticed during the last decade that the proportion of companies that are paying their trade debt within 60 days has strongly increased reaching 68% by 2014 for their receivables and 71% for their payables. However, following 2014 these proportions remained flat and slightly decreased in the last few years. These dynamics are emphasizing the fading of the LME impact seen after 2008. (Figure 2)
Figure 2- Evolution of trade debt payment without delay (2002-2017) (Prost, 2019)
45 50 55 60 65 70 75 2002 2005 2008 2011 2014 2017 (% )
Receivables payment Payables payment
This table displays the level of trade receivables and payables for the year 2017 in France by size of companies. Trade receivables delays are expressed in terms of days of sales and trade payables delays are expressed in terms of days of purchase cost
Source : « Banque de France » –FIBEN Database, octobre 2018.
This graph displays the evolution of the proportion of companies paying their trade receivables and payables without delay beyond 60 days between 2002 and 2017 in France.
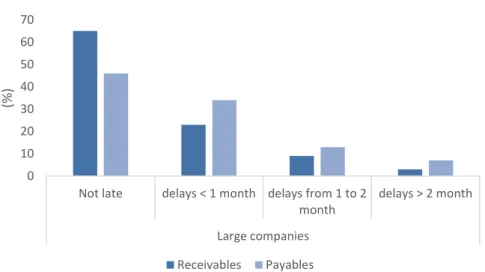
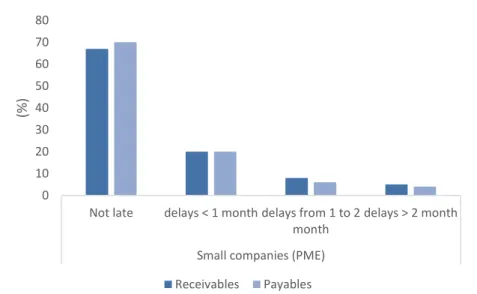
The proportion of companies paying their suppliers on average without delay decreases significantly with size. While it appears that 70% of SMEs respect deadlines of less than 60 days, this figure is only 53% if we consider medium sized companies and drops to 46% for large companies (figure 3,4,5). This situation reflects a favorable balance of power among large companies that seems to be perpetuated. Receivables payment rates without delay seem to corroborate this situation. Indeed, large companies register a rate of collection without delay comparable to that of SMEs (respectively 65% and 67% of companies below 60 days). Large companies, therefore, seem to have more control over their trade receivables, as confirmed by the small proportion of delays greater than a month (12% of companies concerned, compared to 13% for SMEs and 14% for mid-market companies).
Figure 3- Large companies payment delays distribution
0 10 20 30 40 50 60 70
Not late delays < 1 month delays from 1 to 2
month delays > 2 month Large companies (% ) Receivables Payables
This figure shows the distribution of large companies’ payment delays over the 60 days limit in 2017: Not late refers to companies with trade credit below 60 days
Figure 4- Medium companies payment delays distribution
Figure 5- Small companies payment delays distribution 0 10 20 30 40 50 60 70
Not late delays < 1 month delays from 1 to 2
month
delays > 2 month Medium companies (ETI)
(% ) Receivables Payables 0 10 20 30 40 50 60 70 80
Not late delays < 1 month delays from 1 to 2
month
delays > 2 month Small companies (PME)
(%
)
Receivables Payables
This figure shows the distribution of medium companies’ payment delays over the 60 days limit in 2017: Not late refers to companies with trade credit below 60 days
Source : « Banque de France » –FIBEN Database, octobre 2018.
This figure shows the distribution of small companies’ payment delays over the 60 days limit in 2017: Not late refers to companies with trade credit below 60 days
Literature review
This is not the first paper to document the impact of the change of trade credit on companies’ growth and economic performances. Many recent studies have used empirical analysis to measure the effectiveness of recent governmental policies regarding payment delays reduction and predict the future impact of the implementation of payment delays reduction policies in different regions of the world.
Many other studies were performed by governmental authorities and agencies analysing the possible impact of governmental policies and the negative effect that can emerge from increasingly longer payment delays, especially during an economic crisis.
These studies have shown that greater trade credit could harm the existence of multiple economic actors within a country and could increase their bankruptcy risk (Connell, 2014). Other studies have mainly measured the cost of an increase in payment delays on economic performances of companies characterized by a high level of trade credit.
Impact of late payment on companies’ bankruptcy risk
In 2014, the European Commission (Connell, 2014) has studied the Economic Impact of late payments assessing the danger they represent during an economic and financial crisis when access to credit is restricted. The need for restoring balance sheets during the post-financial crisis era has strongly increased creating an urgency to deal with late payments. The study showed that late payments were more harmful and critical to SMEs business due to the importance of maintaining stable cashflows for their survival.
According to the European Commission, late payments could play a significant role in the survival of firms as their liquidity could be severely affected, even forcing some firms to exit the market (Connell, 2014).
The commission has focused its studies on the negative impact of late payments and avoided to analyse the potential positive impact of the payment period reduction. It assesses that late payments will certainly hurt cash flows reducing the investment opportunities for companies as well as increasing the uncertainty for many creditors leading to tighter financial conditions and higher administrative and financial costs. The commission believes that a high level of payment delays will ultimately increase insolvency and bankruptcy risks.
Another paper published in 2016 by (Barrot, 2016) studied the impact of a reduction in trade credit (restriction on companies’ ability to extend payment terms in excess of 30 days to their customers) on the bankruptcy risk in the trucking industry.
The results of this study proved that companies’ default probability decreases by 25% in the trucking sector following the trade credit restriction.
Impact of trade credit reduction on employment growth
In 2015, a first work performed by (Barrot & Sauvagnat, 2015) provides an estimation of the potential impact of a reduction of trade credit on employment creation within the French economy. This analysis helped to measure the impact of a strict application of the LME law in 2012.
Through their work, (Barrot & Sauvagnat, 2015) have analysed the impact of a strict application of the LME regulation on the French economy. They started by measuring the impact of the trade balance transfer that companies would have to make to comply with the 60 days limit. They concluded then that any reduction in the trade credit will hurt the trade balance of companies. Then, they analysed the impact of a variation of trade balance between 2007 and 2012 on employment creation.
In 2018, (Barrot & Nanda, 2018) studied the effect of the federal reform “Quickpay” introduced in 2011 on employment growth. “Quickpay” aims to accelerate the payments to small business contractors of the U.S government. This work proved a strong direct effect of the reform on the employment market: the 15 days of trade credit reduction have helped companies to improve their liquidity and increase consistency in paying their suppliers leading to greater employment growth relative to firms that did not benefit from the reform.
Also, the study revealed that even if the impact on the overall net employment is positive, a difference between the markets initially having high levels of unemployment and the markets of talents exists: the impact of a reduction of trade credit is smaller in tight labour markets. Impact of trade credit reduction on companies’ growth
In their recent work, (Beaumont & Lenoir, 2018) analysed the impact of the presence of financing constraints and the provision of trade credit to existing customers on export behavior and expansion of the customer base.
The paper concluded that excessive payment delays from French customers negatively impact the international development of liquidity-constrained firms. Concretely, a decrease in payment
delays will impact positively the growth of firm exports, increase the probability of exiting a country and decrease the probability of entering a new country.
Impact of a change in trade credit on companies’ investments
Furthermore, (Murfin & Njoroge, 2014) have studied the trade credit relationships between large investment-grade buyers and their smaller suppliers. The study aimed to measure the impact of a reduction of trade payables on investments.
The paper showed that a one-month extension of trade credit will lead to a decrease in capital expenditures level. This trade credit extension is mainly financed via a reduction in cash holdings and spending.
Theoretical model
A.
Understanding the LME regulation
In this paper, due to the difficulty to analyse the trade credit of all the bills for all the companies, we will simplify our understanding of the LME regulation and will focus our analysis on the global trade credit for each company.
To reach this objective we will consider two main indicators that are trade payables (in days) and trade receivables (in days):
• To analyse the ability of a company to pay its suppliers within 60 days as per the LME regulation we will study the indicator: trade payables/purchase cost
• To analyse the ability of a company’s customers to pay their debt within 60 days as per the LME regulation we will study the indicator: trade receivables/revenues
B.
Hypothesis
We borrow from (Barrot & Sauvagnat, 2015) to derive the hypotheses tested in this paper. In this setting, the impact of intra-companies’ trade credit reduction on the economy is studied through the impact of the change of trade balance on employment creation.
In this paper, we will extend this study not only to employment creation but also to revenues growth, and assets growth. Furthermore, we will take into consideration the potential impact of a strict application of trade credit to a 60 days limit.
To simplify the writing and understanding of this report, we will refer to employment creation, revenues growth, and assets growth as economic indicators.
During this study, we will study three hypotheses aiming to measure the impact of intra-companies’ payment period reduction on three economic indicators as below:
Hypothesis #1: a positive impact of a reduction of intra-companies’ trade credit on employment creation considering the surplus relative to LME levels
Hypothesis #2: a positive impact of a reduction of intra-companies’ trade credit on revenues growth considering the surplus relative to LME levels
Hypothesis #3: a positive impact of a reduction of intra-companies’ trade credit on assets growth considering the surplus relative to LME levels.
C.
Implementation strategy
To measure the elasticity of employment, revenues, and assets creation based on the change in the trade balance, we will use the technique of instrumental variables. This methodology allows us to get the causal effect of a change in the trade balance on employment creation, revenues growth, and assets growth between 2007, before the implementation of the LME law, and 2017, a decade after.
To take into consideration the inter-companies’ payment surplus relative to LME levels, we will use the LME surplus transfer as the instrumental variable for the change in the trade balance between 2007 and 2017, the trade balance surplus.
We will also use control variables: the logarithm of assets’ size, number of employees and revenues’ level in 2017.
Trade balance surplus calculation
The trade balance surplus represents the transfer needed to reach the trade credit levels (60 days) as per the LME law. We could also explain it as the difference between the trade receivables surplus and the trade payables surplus:
𝑡𝑟𝑎𝑑𝑒 𝑏𝑎𝑙𝑎𝑛𝑐𝑒 𝑠𝑢𝑟𝑝𝑙𝑢𝑠 = 𝑡𝑟𝑎𝑑𝑒 𝑟𝑒𝑐𝑒𝑖𝑣𝑎𝑏𝑙𝑒𝑠 𝑠𝑢𝑟𝑝𝑙𝑢𝑠 − 𝑡𝑟𝑎𝑑𝑒 𝑝𝑎𝑦𝑎𝑏𝑙𝑒𝑠 𝑠𝑢𝑟𝑝𝑙𝑢𝑠
The trade receivables surplus represents the trade receivables transfer needed to comply with the LME level (maximum of 60 days):
𝑡𝑟𝑎𝑑𝑒 𝑟𝑒𝑐𝑒𝑖𝑣𝑎𝑏𝑙𝑒𝑠 𝑠𝑢𝑟𝑝𝑙𝑢𝑠 = 𝑡𝑟𝑎𝑑𝑒 𝑟𝑒𝑐𝑒𝑖𝑣𝑎𝑏𝑙𝑒𝑠 − 𝑡𝑟𝑎𝑑𝑒 𝑟𝑒𝑐𝑒𝑖𝑣𝑎𝑏𝑙𝑒𝑠 𝑎𝑡 𝐿𝑀𝐸 𝑙𝑒𝑣𝑒𝑙 If 𝑡𝑟𝑎𝑑𝑒 𝑟𝑒𝑐𝑒𝑖𝑣𝑎𝑏𝑙𝑒𝑠 > 𝑡𝑟𝑎𝑑𝑒 𝑟𝑒𝑐𝑒𝑖𝑣𝑎𝑏𝑙𝑒𝑠 𝑎𝑡 𝐿𝑀𝐸 𝑙𝑒𝑣𝑒𝑙 or = 0
The trade payables surplus represents the trade receivables transfer needed to comply with the LME level (maximum of 60 days):
𝑡𝑟𝑎𝑑𝑒 𝑝𝑎𝑦𝑎𝑏𝑙𝑒𝑠 𝑠𝑢𝑟𝑝𝑙𝑢𝑠 = 𝑡𝑟𝑎𝑑𝑒 𝑝𝑎𝑦𝑎𝑏𝑙𝑒𝑠 − 𝑡𝑟𝑎𝑑𝑒 𝑝𝑎𝑦𝑎𝑏𝑙𝑒𝑠 𝑎𝑡 𝐿𝑀𝐸 𝑙𝑒𝑣𝑒𝑙 If 𝑡𝑟𝑎𝑑𝑒 𝑝𝑎𝑦𝑎𝑏𝑙𝑒𝑠 > 𝑡𝑟𝑎𝑑𝑒 𝑝𝑎𝑦𝑎𝑏𝑙𝑒𝑠 𝑎𝑡 𝐿𝑀𝐸 𝑙𝑒𝑣𝑒𝑙 or = 0 If 𝑡𝑟𝑎𝑑𝑒 𝑝𝑎𝑦𝑎𝑏𝑙𝑒𝑠 < 𝑡𝑟𝑎𝑑𝑒 𝑝𝑎𝑦𝑎𝑏𝑙𝑒𝑠 𝑎𝑡 𝐿𝑀𝐸 𝑙𝑒𝑣𝑒𝑙 regressions formulas 𝑒𝑚𝑝𝑙𝑜𝑦𝑚𝑒𝑛𝑡 𝑔𝑟𝑜𝑤𝑡ℎ = 𝜕 + 𝛽 × ∆𝑡𝑟𝑎𝑑𝑒 𝑏𝑎𝑙𝑎𝑛𝑐𝑒 (𝐼𝑉: 𝑡𝑟𝑎𝑑𝑒 𝑏𝑎𝑙𝑎𝑛𝑐𝑒 𝑠𝑢𝑟𝑝𝑙𝑢𝑠) + 𝛾 𝐸𝑚𝑝𝑙𝑜𝑦𝑒𝑒𝑠 𝑟𝑒𝑣𝑒𝑛𝑢𝑒 𝑔𝑟𝑜𝑤𝑡ℎ = 𝜕 + 𝛽 × ∆𝑡𝑟𝑎𝑑𝑒 𝑏𝑎𝑙𝑎𝑛𝑐𝑒 (𝐼𝑉: 𝑡𝑟𝑎𝑑𝑒 𝑏𝑎𝑙𝑎𝑛𝑐𝑒 𝑠𝑢𝑟𝑝𝑙𝑢𝑠) + 𝛾 𝑟𝑒𝑣𝑒𝑛𝑢𝑒s 𝑎𝑠𝑠𝑒𝑡 𝑔𝑟𝑜𝑤𝑡ℎ = 𝜕 + 𝛽 × ∆𝑡𝑟𝑎𝑑𝑒 𝑏𝑎𝑙𝑎𝑛𝑐𝑒 (𝐼𝑉: 𝑡𝑟𝑎𝑑𝑒 𝑏𝑎𝑙𝑎𝑛𝑐𝑒 𝑠𝑢𝑟𝑝𝑙𝑢𝑠) + 𝛾 𝑎𝑠𝑠𝑒𝑡𝑠 Where:
′∆trade balance’ represents the change from 2007 and 2017 of trade balance (the difference between customer receivables and the accounts payable) normalised to total assets of 2007. ′Trade balance surplus’ represents the trade balance surplus (in euros) compared to the respective level it would have in the event of payment to 60 days and normalised to total assets of 2007.
‘Assets’ represents the logarithm function applied to the net total assets of 2007.
‘Revenues’ represents the logarithm function applied to the level of revenues of 2007.
‘Employees’ represents the logarithm function applied to the number of employees of 2007.
Empirical analysis
A.
The data – Diane database
To measure the impact of the strict application of LME law on the French economy, we would need to perform an analysis on all the available data of French companies: the LME pre-implementation period in 2007 and the most available financial data in 2017. In this paper, we focused our analysis on the data provided by the Database “Diane”: this database contains comprehensive information on around 1.8 million French companies and provides all kinds of financial information yearly.
B.
Extraction of financial information
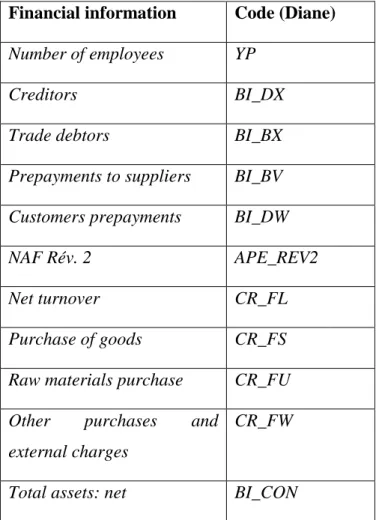
To implement our strategy explained in Chapter IV.C we would need to collect all the available data that would help us to construct and implement our theoretical model. We will then perform the extraction of the main financial information needed for our analysis from the Diane database:
Table 2- Financial information Diane codification Financial information Code (Diane)
Number of employees YP Creditors BI_DX Trade debtors BI_BX Prepayments to suppliers BI_BV Customers prepayments BI_DW NAF Rév. 2 APE_REV2 Net turnover CR_FL Purchase of goods CR_FS Raw materials purchase CR_FU Other purchases and
external charges
CR_FW
Total assets: net BI_CON
This table shows the codenames used by the database Diane to codify main financial data and their exact signification
C.
Data cleaning
From the 1.8 million companies available on the Diane database, we gathered our simple to obtain comprehensive and usable data. After extracting the data for both 2007 and 2017, we excluded some companies from the scope of our analysis based on the following criteria:
• We favored the data of the companies that were in activity in 2007 • We favored the data of companies that were in activity in 2017 • We excluded the public and para-public companies
• We excluded the financial services companies
• We excluded the companies from sectors that were initially exempted from LME law • Also, to avoid the impact of outliers’ data on the results of our analysis, we considered
the trade receivable (resp. trade payables) of companies characterised by trade credit below 0 or above 360 as missing data.
D.
Summary statistics - Global
In 2007, the average observation was a firm with total assets worth €6.5m, earns €5.1m and had 31 employees while in 2017 it grew to a company with total assets worth €10m, earns €7.8m and has 52 employees.
Table 3- Data summary for 2007
Observation Mean Employees number 188,398 31 Assets (€k) 444,304 6,507 Turnover (€k) 444,301 5,115 Purchase cost (€k) 444,301 3,879 Account receivables (€k) 423,196 769 Account payables (€k) 423,196 731
This table shows a summary of the data used during this paper and presents the mean of the main financial information used for the year 2007
Source: Author’s calculation based on data from Diane Database, 2019
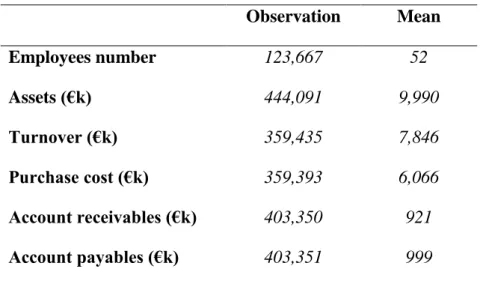
Table 4- Data summary for 2017 Observation Mean Employees number 123,667 52 Assets (€k) 444,091 9,990 Turnover (€k) 359,435 7,846 Purchase cost (€k) 359,393 6,066 Account receivables (€k) 403,350 921 Account payables (€k) 403,351 999
In addition, we notice that the average payment period for our sample companies was 49 days for receivables and 55 days for payables in 2007 where the trade balance payment period was around 12 days. In 2017 these periods were 48 days for trade receivables, 54 days for trade payables and 13 days for trade balance. One important element about these data is that they are completely in line with the data that were provided by “Banque de France” (Prost, 2019) presented in Chapter II.C
Table 5- Average trade credit for 2007 and 2017
(in days) Observation Mean
Trade receivables - 2007 404,477 49 Trade payables – 2007 414,293 55 Trade balance – 2007 414,498 12 Trade receivables - 2017 302,665 48 Trade payables – 2017 312,967 54 Trade balance – 2017 310,083 13
This table shows a summary of the data used during this paper and
presents the mean of the main financial information used for the year 2017 Source: Author’s calculation based on data from Diane Database, 2019
This table shows a summary of trade credit for the years 2007 and 2017. Trade receivables were computed as account receivables net of customers prepayments multiplied by 360 and divided by sales and Trade payables were computed as account payables net of prepayment to suppliers multiplied by 360 and divided by purchase cost
Results
This section presents the results of the implementation of the theoretical model. To increase the significance of our results and regressions, we added a final level of data cleaning by deleting the duplicates data from our samples and using a 5% trim process (excluding the largest and smallest data from the samples).
In this section, we will first confirm the validity of the instrumental variable before measuring the impact of the change of trade balance on our economic indicators.
A.
Validate the instrumental variable
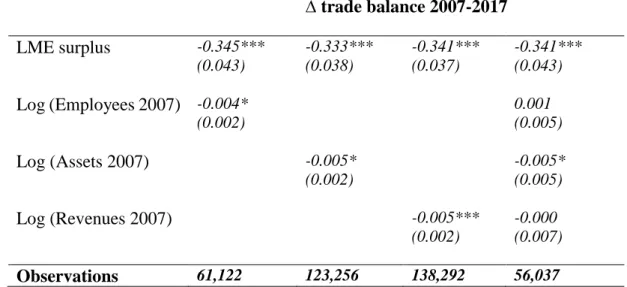
The validity of the instrumental variable depends on rank and exclusion conditions. We tested the rank condition through an Ordinary least square regressions (OLS) of the change in the trade balance on the instrumental variable as well as control variables: the logarithm of the number of employees in 2007, the logarithm of total assets in 2007 and the logarithm of revenues is 2007.
Table 6- OLS regressions results testing the validity of trade balance surplus as IV ∆ trade balance 2007-2017 LME surplus -0.345*** (0.043) -0.333*** (0.038) -0.341*** (0.037) -0.341*** (0.043) Log (Employees 2007) -0.004* (0.002) 0.001 (0.005) Log (Assets 2007) -0.005* (0.002) -0.005* (0.005) Log (Revenues 2007) -0.005*** (0.002) -0.000 (0.007) Observations 61,122 123,256 138,292 56,037
This table shows the OLS regression results of the ∆trade balance 2007-2017 on the LME surplus and control variables: the logarithm value of the number of employees, assets, and revenues. The LME surplus has a significant negative impact on the ∆ balance 2007-2017on all combinations of control variables
Note: the difference between the number of observations between the different
regressions in table 6 and compared to table 4 and 5 is due to the unavailability of data and the data cleaning criteria
Standard errors in parentheses *pi 0.1, **pi 0.05, *** pi 0.01 Source: Author’s calculation
The coefficient of the instrumental variable is very significant, which confirms that the condition of rank is respected. The exclusion condition is not formally testable but seems satisfied in this context.
B.
Impact of change in the trade balance
After performing the regressions, we found that a decrease in the trade balance between 2007 and 2017 has a significant positive impact on employment creation, revenues growth, and assets growth.
These results confirm that any reduction in the trade balance will help to create more employment and generate more revenues and assets.
Table 7- Regression of the impact of change in trade balance Employment growth Assets growth Revenues growth ∆trade balance 2007-2017 -0.924*** (0.293) -1.134*** (0.366) -1.209*** (0.259) Log (Employees 2017) -0.086*** (0.007) Log (Assets 2017) -0.102*** (0.008) Log (Revenues 2017) -0.036*** (0.004) Observations 25,649 116,986 101,2013
This table shows the IV regression results of employment growth, assets growth and revenues growth on ∆trade balance 2007-2017 (with LME surplus as an instrumental variable) and control variables: the logarithm value of the number of employees, assets, and revenues. The LME surplus has a significant negative impact on the ∆trade balance 2007-2017 on all combinations of control variables
Note: the difference between the number of observations between the different
regressions in table 7 and compared to table 4 and 5 is due to the unavailability of data and the data cleaning criteria
Standard errors in parentheses *pi 0.1, **pi 0.05, *** pi 0.01 Source: Author’s calculation
From these results, we conclude that the LME regulation helps in creating more employment opportunities through its effect on the trade balance of companies. It also led to a more optimal generation of additional revenues and assets.
Analysis of the benefit of the LME regulation on our
companies’ sample
We will also analyse the benefit of this regulation on various types of companies. To do so, the results will be aggregated by categories of companies, defined according to the criteria used by the French governmental authority responsible for following trade credit “l'Observatoire des Délais de paiement”.
SMEs are companies with less than 250 employees, with a turnover of less than €50 million or total assets under €43 million. Intermediate-sized enterprises (ETI) are companies that are not SMEs, employing less than 5,000 people and having a turnover of less than €1.5 billion or assets under €2 billion. Large companies are all companies that are neither SMEs nor intermediate-sized enterprises.
A.
The expected benefit from the introduction of the LME law in 2008
Analysis methodology
The introduction of the LME law in 2008 aimed to structure the inter-companies’ trade credit in France and reduce the payment delays.
In this section, we will briefly discuss the expected benefit from the LME law if all companies were fully compliant with the law at the time of its introduction.
The results that will be shown express a reality where all companies reduced both their customer loans (account receivables) and trade payables (account payables) to the limit imposed by the LME regulation (60 days).
Firstly, we will compute the LME surplus transfer which refers to the difference between the amount that a company needs to receive to meet the 60 days limit for its receivables and the amount it has to transfer to meet the 60 days limit of payment for its payables.
Secondly, the LME surplus transfer will directly impact the trade balance of a company. Any reduction in the receivables of a company will reduce its trade balance and any reduction in the payables will increase the trade balance of the company. We conclude that any LME surplus transfer will have an exact negative impact on the trade balance variation.
Finally, based on the regression results in chapter VI.B we calculate the impact of this trade balance variation in the economic indicators (employment growth, revenues growth, and assets growth) as fellow:
𝐸𝑚𝑝𝑙𝑜𝑦𝑚𝑒𝑛𝑡 𝑔𝑟𝑜𝑤𝑡ℎ = − 𝐿𝑀𝐸 𝑠𝑢𝑟𝑝𝑙𝑢𝑠 𝑡𝑟𝑎𝑛𝑠𝑓𝑒𝑟 × 𝑒𝑚𝑝𝑙𝑜𝑦𝑚𝑒𝑛𝑡 𝑟𝑒𝑔𝑟𝑒𝑠𝑠𝑖𝑜𝑛 𝑐𝑜𝑒𝑓𝑓𝑖𝑐𝑖𝑒𝑛𝑡 𝑅𝑒𝑣𝑒𝑛𝑢𝑒𝑠 𝑔𝑟𝑜𝑤𝑡ℎ = − 𝐿𝑀𝐸 𝑠𝑢𝑟𝑝𝑙𝑢𝑠 𝑡𝑟𝑎𝑛𝑠𝑓𝑒𝑟 × 𝑟𝑒𝑣𝑒𝑛𝑢𝑒𝑠 𝑟𝑒𝑔𝑟𝑒𝑠𝑠𝑖𝑜𝑛 𝑐𝑜𝑒𝑓𝑓𝑖𝑐𝑖𝑒𝑛𝑡 𝐴𝑠𝑠𝑒𝑡𝑠 𝑔𝑟𝑜𝑤𝑡ℎ = − 𝐿𝑀𝐸 𝑠𝑢𝑟𝑝𝑙𝑢𝑠 𝑡𝑟𝑎𝑛𝑠𝑓𝑒𝑟 × 𝑎𝑠𝑠𝑒𝑡𝑠 𝑟𝑒𝑔𝑟𝑒𝑠𝑠𝑖𝑜𝑛 𝑐𝑜𝑒𝑓𝑓𝑖𝑐𝑖𝑒𝑛𝑡
Where ‘LME surplus transfer’ represents the trade balance surplus (in euros) compared the respective level it would have in the event of payment to 60 days and normalised to total assets of 2007.
Analysis results
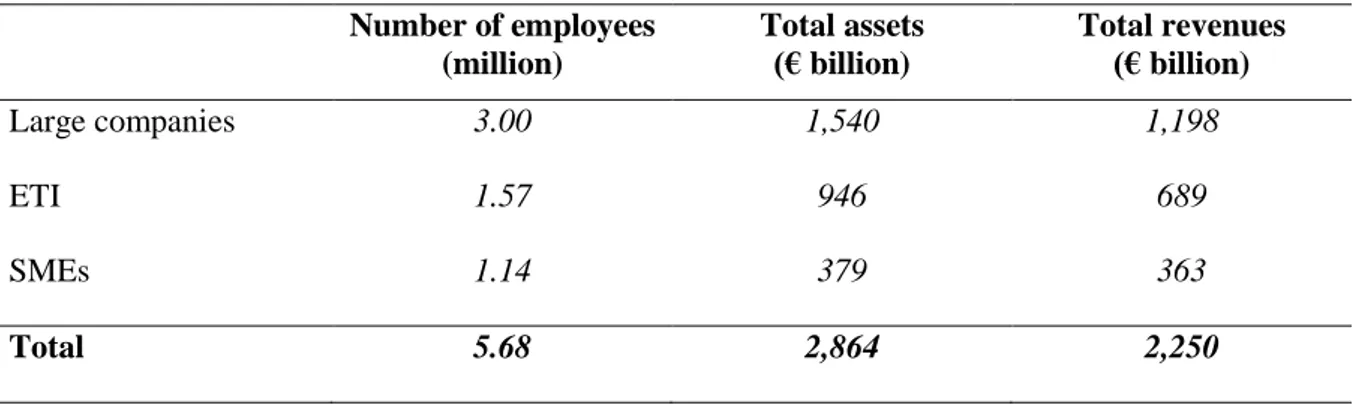
We consider the sample of companies used to perform our analysis in this paper as representing the French economy. Consequently, in 2017, the French economy was employing around 5.68 million workers generating €2,250 billion of turnover through €2,864 billion of assets.
Table 8- Main economic indicator by companies' category in 2007 (Size)
Number of employees (million)
Total assets
(€ billion) Total revenues (€ billion)
Large companies 3.00 1,540 1,198
ETI 1.57 946 689
SMEs 1.14 379 363
Total 5.68 2,864 2,250
Following the data of 2007, the French economy had a surplus of €7.64 billion compared to the limit imposed by the LME regulation. SMEs were representing 58% (€4.45 billion) of this surplus and thus will be the category that will be the most impacted by any benefits or drawbacks of the regulation.
This table shows a summary of the main economic indicators for 2007 studied in this paper (Number of employees, Total assets, Total revenues) by size of companies. These data represent only the data of companies that are constituting our sample and are limited due to the unavailability of data for some companies
Table 9- Impact of the strict application of the LME law LME surplus transfer (€ billion) Employment growth (%) Assets growth (%) Total revenues (%) Large companies 1.90 1.8 0.1 0.2 ETI 1.29 1.0 0.2 0.0 SMEs 4.45 2.3 1.3 1.7 Total 7.64 1.7 0.3 0.4
From the results of our analysis, we conclude that a strict application of the LME regulation if done at the introduction of the law would have created 1.7% addition employment for the French economy (represented by our sample). Total assets would have been increased by 0.3% while the French companies would have been generated an additional 0.4% of revenues. We note that SMEs would have benefited the most from employment creation and revenues generation while ETI would have been the least impacted by the regulation.
B.
The real benefit from the introduction of LME law during the last
decade
Analysis methodology
One decade after the introduction of the LME regulation, the number of employees has grown by 12.5% reaching 6.48 million employees when the total assets went up by c.53% and total turnover by c.24%.
This table shows the impact of the strict application of the LME law on employment growth, assets growth and revenues growth at the introduction of the law. These results could be considered as the expected results from the LME law.
Table 10- Main economic indicator by companies' category (Size) in 2017 Number of employees (million) Total assets (€ billion) Total revenues (€ billion) Large companies 1.68 2,197 1,305 ETI 2.50 1,506 983 SMEs 2.30 685 531 Total 6.48 4,388 2,819
In this section, we will assess the part of these performances that is due to the LME regulation. To reach our objectives, we will first compute the LME surplus transfer made during the decade between 2007 and 2017. This transfer is calculated as the difference between the LME surplus in 2007 and the LME surplus in 2017 rebased on a 2007 level (multiplied by the total assets in 2007 divided by the total assets in 2017). The LME surplus transfer will have an exact negative impact on the trade balance variation.
We will then obtain the performance of our economic indicators (due to the LME regulation) by using the regression coefficient found in Chapter VI.B:
∆𝑡𝑟𝑎𝑑𝑒 𝑏𝑎𝑙𝑎𝑛𝑐𝑒 = −∆𝐿𝑀𝐸 𝑠𝑢𝑟𝑝𝑙𝑢𝑠 𝑡𝑟𝑎𝑛𝑠𝑓𝑒𝑟
𝐸𝑚𝑝𝑙𝑜𝑦𝑚𝑒𝑛𝑡 𝑔𝑟𝑜𝑤𝑡ℎ = ∆𝑡𝑟𝑎𝑑𝑒 𝑏𝑎𝑙𝑎𝑛𝑐𝑒 × 𝐼𝑉 𝑒𝑚𝑝𝑙𝑜𝑦𝑚𝑒𝑛𝑡 𝑟𝑒𝑔𝑟𝑒𝑠𝑠𝑖𝑜𝑛 𝑐𝑜𝑒𝑓𝑓𝑖𝑐𝑖𝑒𝑛𝑡 𝑅𝑒𝑣𝑒𝑛𝑢𝑒𝑠 𝑔𝑟𝑜𝑤𝑡ℎ = ∆𝑡𝑟𝑎𝑑𝑒 𝑏𝑎𝑙𝑎𝑛𝑐𝑒 × 𝐼𝑉 𝑟𝑒𝑣𝑒𝑛𝑢𝑒𝑠 𝑟𝑒𝑔𝑟𝑒𝑠𝑠𝑖𝑜𝑛 𝑐𝑜𝑒𝑓𝑓𝑖𝑐𝑖𝑒𝑛𝑡 𝐴𝑠𝑠𝑒𝑡𝑠 𝑔𝑟𝑜𝑤𝑡ℎ = ∆𝑡𝑟𝑎𝑑𝑒 𝑏𝑎𝑙𝑎𝑛𝑐𝑒 × 𝐼𝑉 𝑎𝑠𝑠𝑒𝑡𝑠 𝑟𝑒𝑔𝑟𝑒𝑠𝑠𝑖𝑜𝑛 𝑐𝑜𝑒𝑓𝑓𝑖𝑐𝑖𝑒𝑛𝑡 Analysis results
Between 2007 and 2017 the LME surplus transfer (in euros) has globally increased due to the increase in balance sheets’ size of companies. However, when rebasing the data at the same level of assets as in 2007, we notice that the overall LME surplus has decreased due to positive transfer issued by the application of the regulation.
This table shows a summary of the main economic indicators for 2017 studied in this paper (Number of employees, Total assets, Total revenues) by size of companies. These data represent only the data of companies that are constituting our sample and are limited due to the unavailability of data for some companies
These surplus transfers have contributed to the overall improvement in the economic indicators between the two periods.
Table 11- Impact of the LME regulation between 2007 and 2017
LME surplus transfer (€ billion) Employment growth (%) Assets growth (%) Total revenues (%) Large companies 3.90 1.0 0.3 0.0 ETI -0.72 0.2 0.0 -0.2 SMEs 1.21 0.4 0.4 0.8 Total 4.39 0.7 0.2 0.1
However, these improvements remain limited compared to the potential improvement that could derive from a strict application of the LME regulation.
Table 12 - comparison between expected vs realised performances between 2007 - 2017
Employment growth (%) Assets growth (%) Total revenues (%)
Realised Expected Realised Expected Realised Expected
Large companies 1.0 1.8 0.3 0.1 0.0 0.2
ETI 0.2 1.0 0.0 0.2 -0.2 0.0
SMEs 0.4 2.3 0.4 1.3 0.8 1.7
Total 0.7 1.7 0.2 0.3 0.1 0.4
This Table shows the part of the growth in the main economic indicator between 2007 and 2017 that is due to the introduction of the LME. These results could be considered as the real impact of the LME law between 2007 and 2017
Source: Author’s calculation
This Table shows a comparison between the impact that was expected from the introduction of the LME law and the real impact that the law had on the French economy for the period between 2007 and 2017. Source: Author’s calculation based on Diane database, 2019
vs vs vs vs vs vs vs vs vs vs vs vs
This situation is mainly because the LME regulation was not strictly followed by the French companies since its introduction in 2008.
C.
The potential benefit from a strict application of LME regulation in
2017
Following the introduction of the LME regulation in 2008, the trade credit in France has decreased. However, this decrease has not been optimal to permit all the French companies to fully comply with the regulation and maintain their trade credit at a level below 60 days. Analysis methodology
In this section, we will discuss the potential benefit from a strict application of the LME regulation in 2017.
We will follow the same methodology used in chapter VII.A to measure the impact of a strict application of the LME regulation post-2017: we will start by computing the LME surplus transfer in 2017. We will then measure the impact of this transfer on the economic indicators (employment growth, revenues growth, and assets growth) as follows:
𝐸𝑚𝑝𝑙𝑜𝑦𝑚𝑒𝑛𝑡 𝑔𝑟𝑜𝑤𝑡ℎ = − 𝐿𝑀𝐸 𝑠𝑢𝑟𝑝𝑙𝑢𝑠 𝑡𝑟𝑎𝑛𝑠𝑓𝑒𝑟 × 𝑒𝑚𝑝𝑙𝑜𝑦𝑚𝑒𝑛𝑡 𝑟𝑒𝑔𝑟𝑒𝑠𝑠𝑖𝑜𝑛 𝑐𝑜𝑒𝑓𝑓𝑖𝑐𝑖𝑒𝑛𝑡 𝑅𝑒𝑣𝑒𝑛𝑢𝑒𝑠 𝑔𝑟𝑜𝑤𝑡ℎ = − 𝐿𝑀𝐸 𝑠𝑢𝑟𝑝𝑙𝑢𝑠 𝑡𝑟𝑎𝑛𝑠𝑓𝑒𝑟 × 𝑟𝑒𝑣𝑒𝑛𝑢𝑒𝑠 𝑟𝑒𝑔𝑟𝑒𝑠𝑠𝑖𝑜𝑛 𝑐𝑜𝑒𝑓𝑓𝑖𝑐𝑖𝑒𝑛𝑡 𝐴𝑠𝑠𝑒𝑡𝑠 𝑔𝑟𝑜𝑤𝑡ℎ = − 𝐿𝑀𝐸 𝑠𝑢𝑟𝑝𝑙𝑢𝑠 𝑡𝑟𝑎𝑛𝑠𝑓𝑒𝑟 × 𝑎𝑠𝑠𝑒𝑡𝑠 𝑟𝑒𝑔𝑟𝑒𝑠𝑠𝑖𝑜𝑛 𝑐𝑜𝑒𝑓𝑓𝑖𝑐𝑖𝑒𝑛𝑡
Where ‘LME surplus transfer’ represents the trade balance surplus (in euros) compared to the respective level it would have in the event of payment to 60 days and normalised to total assets of 2017.
Analysis results
Based on the data of 2017, the French economy had a surplus of €8.36 billion compared to the limit imposed by the LME regulation. SMEs were representing 74% (€6.17 billion) of this surplus transfer when ETI will benefit from a surplus transfer of €4.16. These transfers would be financed in part by the big companies, for €1.96 billion and by the financial institutions, the state, the local authorities, and non-residents for the remaining amount.
Table 13- Impact of the strict application of the LME law in 2017 LME surplus transfer (€ billion) Employment growth (%) Assets growth (%) Total revenues (%) Large companies -1.96 -0.2 -0.1 0.2 ETIs 4.16 1.1 0.3 0.1 SMEs 6.17 1.9 1.0 1.2 Total 8.36 1.1 0.2 0.3
The variation of the commercial balance generated by an application of the LME regulation would create an additional 1.1% employment opportunities and around 1.9% increase in employment among the SMEs. The impact on employment creation is also positive within the mid-sized companies, and negative at large companies.
D.
Analysis of the benefit of the LME regulation on the French
economy
To assess the real impact of the LME regulation on the French economy, we will extrapolate the performances reached on Chapter VII for companies in our sample to the overall economy. The LME surplus transfer has decreased from €35 billion before the implementation of the LME law (Betbèze & Kremp, 2008) to €13 billion in 2017 (Boileau & Gonzalez, 2019). This transfer would go in priority to SMEs providing them with additional cash of around €19 billion euros. The 26 billion transfer for SMEs and ETIs would be financed up to €13 billion by large companies and for €13 billion by the financial institutions, the state, the local authorities, and non-residents. (Boileau & Gonzalez, 2019)
This Table shows the impact of the strict application of the LME law on employment growth, assets growth and revenues growth in 2017. These results could be considered as the expected results from the LME law post-2017
Table 14- LME surplus transfer in 2017 for the overall French economy
LME surplus transfer 2017 (€ billion)
Large companies -13
ETIs 7
SMEs 19
Total 13
Based on the data provided by (INSEE, 2018) on the number of employees by category of companies, we could assess the real impact of the LME regulation on the French employment market if the regulation was strictly applied in 2017.
Table 15- Impact of the LME regulation on the French employment market in 2017
Number of employees (million) Employment growth (%) Employment opportunities (thousand) Large companies 4.24 -0.2 -8.4 ETIs 3.66 1.1 40.3 SMEs 7.00 1.9 133.0 Total 14.9 - 164.9
This Table shows the level of LME surplus for Large companies, ETIs and SMEs in 2017 and represents the transfer that should have happened in the entire French economy
Source: (Boileau & Gonzalez, 2019)
This Table shows the employment opportunities that would have been created if the LME regulation was strictly applied in 2017.
The overall employment market would have grown by approximatively 165 thousand jobs. The SMEs would have employed an additional 133 thousand and ETIs would have employed an additional 40 thousand. Large companies would have lost 8 thousand jobs due to the negative transfer that this category will have to pay in order to finance part of the transfer due to ETIs and SMEs.
Limits and potential extensions
Data limitationThe current use of the data from Diane database does not allow to verify which firms are impacted by the LME regulation. We have extrapolated our understanding of the legal texts to perform our analysis.
Also, the unavailability of the data was one of the most important barriers to the completion of our work. Firstly, Diane databased does not contain all the appropriate information for all the French firms: important financial information needed to measure and analyse the economic indicators performances were missing. Secondly, the unavailability of the data makes it difficult to compare the data for the same company for both 2007 and 2017.
We are expecting these issues to be fully surpassed in the future due to the upcoming updates to be made by the database Diane.
Possible work extension and updates
This work could be extended in three possible ways: Firstly, by studying the impact of trade credit on more economic indicators. This move will allow having a more complete and accurate view of the impact of the LME regulation on the overall economy.
Secondly, by studying the dynamics of the impact of the LME regulation yearly. Our work focused on the impact between 2007 and 2017 by considering only the data for the years 2007 and 2017. Understanding the impact for every year will allow having a better view of the effectiveness of the implementation of such regulation in the future.
Finally, by comparing the impact of the LME regulation in France with the impact of similar regulation in other countries. This move will help to understand the impact of country specificities on the implementation of a trade credit’ reduction regulation.
Conclusion
The introduction of the LME regulation has helped companies reducing their trade credit. This paper represents an analysis of the impact of the LME regulation and a reduction in inter-companies’ trade credit on the French economy.
Through this paper, we proved that a reduction in trade credit has a positive impact on job creation, revenues, and growth.
The LME regulation aims to force companies to reduce their trade credit to a 60 days level. This regulation aimed to help companies improve their performances: our analysis showed that a strict application of the regulation in 2008 would have created around 1.7% additional employment opportunities, generated 0.3% of additional revenues with an increase in the overall assets of about 0.4%.
However, around a decade after, many companies are still not strictly compliant with the regulation. This situation has strongly reduced the impact of the LME regulation. In the last decade, the real impact of the regulation was limited compared to the expected results if the regulation was strictly applied.
Finally, the strict application of the law in 2017 could create around 165 thousand new employment for the French economy and generate a 0.3% growth in revenues and 0.2% growth in assets.
Bibliography
Barrot, J.-N., & Nanda, R. 2018. The employment effects of faster payment: evidence from the federal quickpay reform. Harvard Business School Entrepreneurial Management
Working Paper(17-004).
Barrot, J.-N., & Sauvagnat, J. 2015. Délais de paiement : L’effet sur l’emploi du non-respect de la LME.
Barrot, J. N. 2016. Trade credit and industry dynamics: Evidence from trucking firms. The
Journal of Finance, 71(5): 1975-2016.
Beaumont, P., & Lenoir, C. 2018. Does trade credit provision dampen firm growth? Evidence from customer-supplier exports.
Betbèze, J., & Kremp, E. 2008. Rapport annuel de l’observatoire des délais de paiement 2008.
Banque de France.
Boileau, A., & Gonzalez, O. 2019. Bulletin de la Banque de France. Banque de France, 221/3
- JANVIER-FÉVRIER 2019.
CEDEF. 2019. Quels sont les délais de paiement applicables entre entreprises ? .
Connell, W. 2014. The Economic Impact of Late Payments. In E. Commission (Ed.), Vol. Economic Papers 531.
INSEE. 2018. Economie générale, édition 2018.
Lorenzi, J.-H. 2014. Rapport annuel de l'observatoire des délais de paiement: Observatoire des délais de paiement.
Murfin, J., & Njoroge, K. 2014. The implicit costs of trade credit borrowing by large firms. The
Review of Financial Studies, 28(1): 112-145.
Prost, J.-M. 2019. Rapport annuel de l’Observatoire des délais de paiement. In d. d. E. Banque de France (Ed.): Eurosystéme