Proc. of the Int. Conf. Applications of Structural Fire Engineering, 15-16 October 2015, Dubrovnik, Croatia
92
ANALYSIS OF A CONCRETE BUILDING EXPOSED TO NATURAL FIRE
Ana Saucaa, Thomas Gernaya, Fabienne Robertb, Jean Marc Franssenaa
University of Liege, Departament ArGEnCo, Liege, Belgium b
CERIB, Fire Testing Centre, Epernon, France
Abstract
In this paper is presented the analysis of a concrete building exposed to OZone fire.
The temperature development in the elements and the structural behaviour were calculated in SAFIR using beam elements for the columns and beams and shell elements for the floor slabs. The first floor was modelled and the effects of action from the upper storeys are applied as external loads. It is shown how the numerical analysis allows understanding the behaviour of the structure when exposed to a natural fire until complete cooling by analysing the evolution of displacements, the distributions of bending moments in the beams, the membrane forces in the slab, and the stresses in the elements. All this detailed information would not be available from an experimental test.
Keywords: numerical analysis, SAFIR, concrete building, fully-developed fire
1 INTRODUCTION
In this study an overall analysis of an office building is undertaken. It consists in a numerical assessment of the structural performance of an eight storey concrete building when subjected to a fire located on the ground floor of the building.
The temperature-time curve of the critical fire design scenario has been obtained with Ozone model. The behaviour of structure was studied using SAFIR (Franssen., 2005).
2 DESCRIPTION OF THE STRUCTURE
2.1 General description
Fig. 1 Plan view of the concrete structure [m]
The studied building is an open-plan office building composed of reinforced continuous concrete beams and columns, supporting concrete slabs (Biasioli et al., 2014). The building is divided into two basement levels, a ground floor and five floors above, which are open to the public. The ground floor has a height of 4 m whereas the upper storeys have a height of 3 m.The length is divided into five structural bays, and the width into two bays. Each bay is 6 m by 7.125 m as shown in Fig.1.
93 2.1 Description of the structural members
The structure includes three kinds of structural members: reinforced concrete columns, beams and slabs. The materials used are: concrete C25/30 for beams and slabs, C30/37 for columns; hot rolled steel, grade 500 class B. The column section is 0.50x0.50 m2 with 4 m height (level 0, where the fire was considered). The section of the beam is 0.25x0.40 m2. The thickness of the slab is equal to 0.18 m. Table 1 presents the reinforcement used for structural members and the axis distance for the rebars.
Table 1 Reinforcement and the axis distance for each structural member [mm]
Column
Beam Slab
Perimeter
support Mid-span
Intermediate
support X direction Y direction
Re-bars Top 12φ 20 7φ 12 2φ 10 9φ 12 φ 14/125mm φ 16/125mm Bottom 3φ 16 3φ 16 3φ 16 φ 12/125mm φ 12/250mm φ 14/250mm Axis distance Top 52 mm 42 mm 42 mm 42 mm 37 mm 52 mm Bottom 44 mm 44 mm 44 mm 36 mm 49 mm Stirrups φ 12/200 φ 8/175 - -
Stress-strain relationships of concrete and steel are taken from EN 1992-1-2. An explicit model for transient strain has been applied (Gernay et al., 2014). Tensile strength of concrete has been considered.
2.2 Loads
A dead load of 1.5 kN/m2 representing the finishing, pavement, embedded services, and partitions is added to the self-weight of the structural elements. A value of 4 kN/m2 was considered as the variable load for offices.
The mechanical action in fire situation was determined in accordance with EN1990and EN1991-1-2. Consequently, the load combination described by Eq.(1) was used:
(1) Where: G is sum of all the permanents loads,
Qi is dominant live load ψ2,i=0.6 (office open to public, meeting rooms). Note: No wind action was considered (ψ2,i =0 for wind).
Distributed loads used are thus 8.40 kN/m2 for slabs, 10.50 kN/m for exterior beams and 2.50 kN/m for interior beams.
3 THERMAL RESPONSE OF THE STRUCTURE
Several fire developments (fully-developed fire) were examined in order to select a critical fire design scenario corresponding to a characteristic fuel load of 1140 MJ/m² and 15% glazing breakage (Heidari et al., 2015). Using OZone model the temperature-time curve of this critical fire design scenario has been obtained and is presented in Fig. 2.
94
Fig. 2 Critical design fire selected for the structural analysis
The following thermal and physical properties for thermal transfer were taken into account: water content: 1.5 % off mass; concrete density: 2300 kg/m3; thermal conductivity: lower limit given in EC2-1-2; Siliceous aggregates; emissivity related to the concrete surface: 0.7. The coefficient of heat transfer by convection is taken as 35 W/m².K on exposed side and 4 W/m².K on unexposed side.
4 MECHANICAL RESPONSE OF THE STRUCTURE
4.1 Structural model
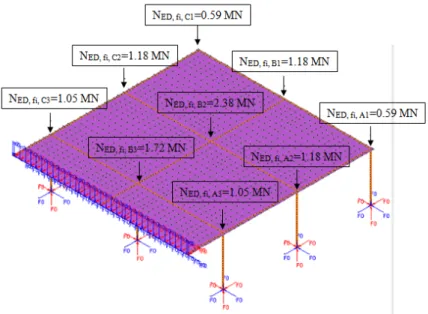
Fig. 3 SAFIR structural model of the building with applied boundary conditions and the vertical forces representing the above floors
For the structural model in SAFIR, only the first floor was considered, the above floors were represented by vertical forces acting on the top part of the column. Due to the symmetry of the building only half of the first floor was modelled.
A typical view of the structural model in SAFIR and boundary conditions are presented in Fig. 3. The columns were fully fixed at the bottom. For the slab, the rotation along y and z axes was restrained at the symmetry line, as well as the displacements along the x axis.
4.2 Displacements
The vertical displacement of the slabs increases until approximately 160 minutes, even in the decay phase, once the temperature in the compartment starts to decrease, reaching the maximum value of
95
0.20 m in the point 1-2/B-C. After reaching this value, the displacement decreases, with residual value equal to 0.14 m after 400 minutes. No collapse is observed (Fig. 4).
Fig. 4 First bay slab displacements
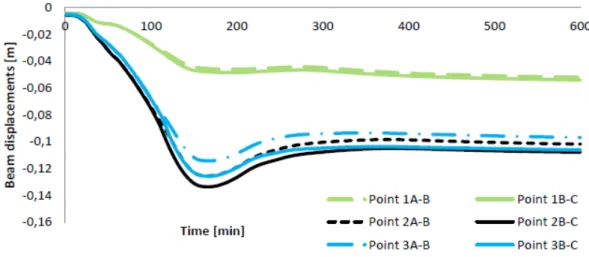
Fig. 5 shows that the maximum displacement is equal to 0.134 m for beam axis 2 in the span between B-C (Point 2B-C).
Fig. 5 Beam vertical displacements – axes 1,2,3
For the exterior beam (axis 1) the displacement increases until the end of analysis, coming to the final displacement of 0.052 m (Point 1A-B and Point 1B-C).
For the interior beams (axes 2 and 3), after reaching the maximum value around 160 minutes, a decrease can be noticed until 300 minutes of fire exposure, after which the displacement is nearly constant.
For transversal beams, the evolution of displacements is as for the longitudinal ones, but with smaller values.
4.3 Beams bending moments
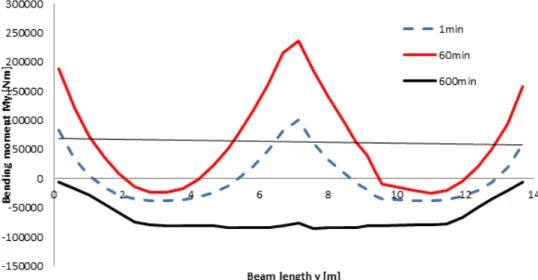
The evolution of the bending moment for the beam in axis 2 is presented in Fig. 6. The supports bending moment are increasing in time, reaching the maximum value after 1 hour of fire exposure. After 10 hours of exposure, sagging supports bending moment can be observed, due to the thermal expansion of the columns.
96
Fig. 6 Beam axis 2 bending moment for different time steps
4.4 Distribution of membrane forces in the slabs
The distribution and orientation of the principal membrane forces in the slab during the fire are shown in Fig. 7. Compressive membrane forces are shown as thick dark arrows, while tensile membrane forces are represented by light thin arrow. The length of the arrows indicates the magnitude of the membrane action.
At the start of fire exposure (1min), the calculated membrane forces in the slab are very low. At this stage, the loads on the slab are resisted by bending action. At the beginning of the fire, the slab is compressed because the thermal expansion of the slab is restrained by beams.
After 60 min of fire exposure, the analysis predicts significant membrane forces in the slab. The membrane action consists of a tension field in the center surrounded by a compression ring at the edge of the heated region. This distribution of membrane forces is attributed to the deflected shape of the slab; the sagging mid-span deflection produces tension in the mid-span region which is resisted by compressive membrane forces along the beams.
After 300 min, the temperature in the top part of the slab increases, while in the bottom part the temperature decreases and thus the behaviour of the slab changes. The tensile force in the central mid-span regions decreases, the compressive action spreads instead.
1 min 60 min 600 min
Fig. 7 Membrane force distribution at different time steps
4.5 Behaviour of the central column B2
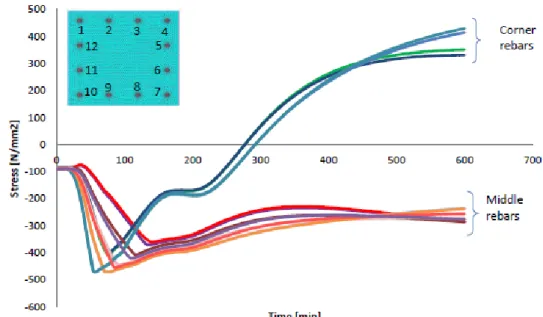
Fig. 8 shows the evolution of stresses for corner reinforcements and for middle rebars. When exposed to fire, the exterior part of the section starts to extend, while the interior part is still cold. Even in the decay phase, the thermal gradient is moving inside the section heating the middle part,
97
while the exterior one will start to cool down. The central heated part will extend, introducing tension in the cold exterior part of the section. This is the reason why, the corner rebars are tensioned from around 300 minutes until the end of analysis.
Fig. 8 Rebar stresses. Central column (top)
5 CONCLUSIONS
A numerical analysis in SAFIR was performed for a concrete building exposed to a critical OZone fire design scenario. After 10 hours of fire exposure no failure occurred. It was possible to investigate in details the behavior of the building by plotting the displacements and the efforts in the structural elements.
Numerical analysis allows performing a detailed investigation of the structural behavior. The evolution of displacements, the effect of actions, strains and stresses, and rotation are accessible. This gives to the designer a very powerful tool to understand the physical behavior of the structure to see the effect of varying different design options in the design and, finally, to carry out a performance based analysis. Graphic tools are mandatory to perform the analysis of the results. REFERENCES
Biasioli F. et al, 2014. Eurocode 2 : BACKGROUND & APPLICATION, DESIGN OF CONCRETE
BUILDING, Worked Example. Publication Office of the European Union, Luxembourg.
Eurocode 2: Design of concrete structures-Part 1-2: General rules — Structural fire, European Standard EN
1992-1-2, 2004-CEN, Brussels.
EN 1990: Eurocode - Basis of structural, European Standard EN 1990-1-1, 2002,CEN, Brussels.
Franssen J.-M., 2005. SAFIR:A thermal/structural program for modeling structures under fire. American
Institute of Steel construction , Vols. 42(3), pp. 143-158.
Gernay T., Franssen J.M.,2012. A formulation of Eurocode concrete model at elevated temperature that
includes an explicit terms for transient creep. Fire Safety Journal, vol. 51, pp. 1-9.
Heidari M. , Robert F., Rein G., 2015. Probabilistic Study of the Resistance of a Concrete Structure according to Eurocode Natural Fire, in 2nd European Symposium of Fire Safety Science (ESFSS), 16-18 June 2015, Nicosia, Cyprus.
![Fig. 1 Plan view of the concrete structure [m]](https://thumb-eu.123doks.com/thumbv2/123doknet/5640737.136379/1.892.256.686.764.1000/fig-plan-view-concrete-structure-m.webp)
![Table 1 Reinforcement and the axis distance for each structural member [mm]](https://thumb-eu.123doks.com/thumbv2/123doknet/5640737.136379/2.892.98.840.277.527/table-reinforcement-axis-distance-structural-member-mm.webp)